
11 KiB
Name
支撑阻力策略结合动态风险管理系统-Support-and-Resistance-Strategy-with-Dynamic-Risk-Management-System
Author
ChaoZhang
Strategy Description
[trans]
概述
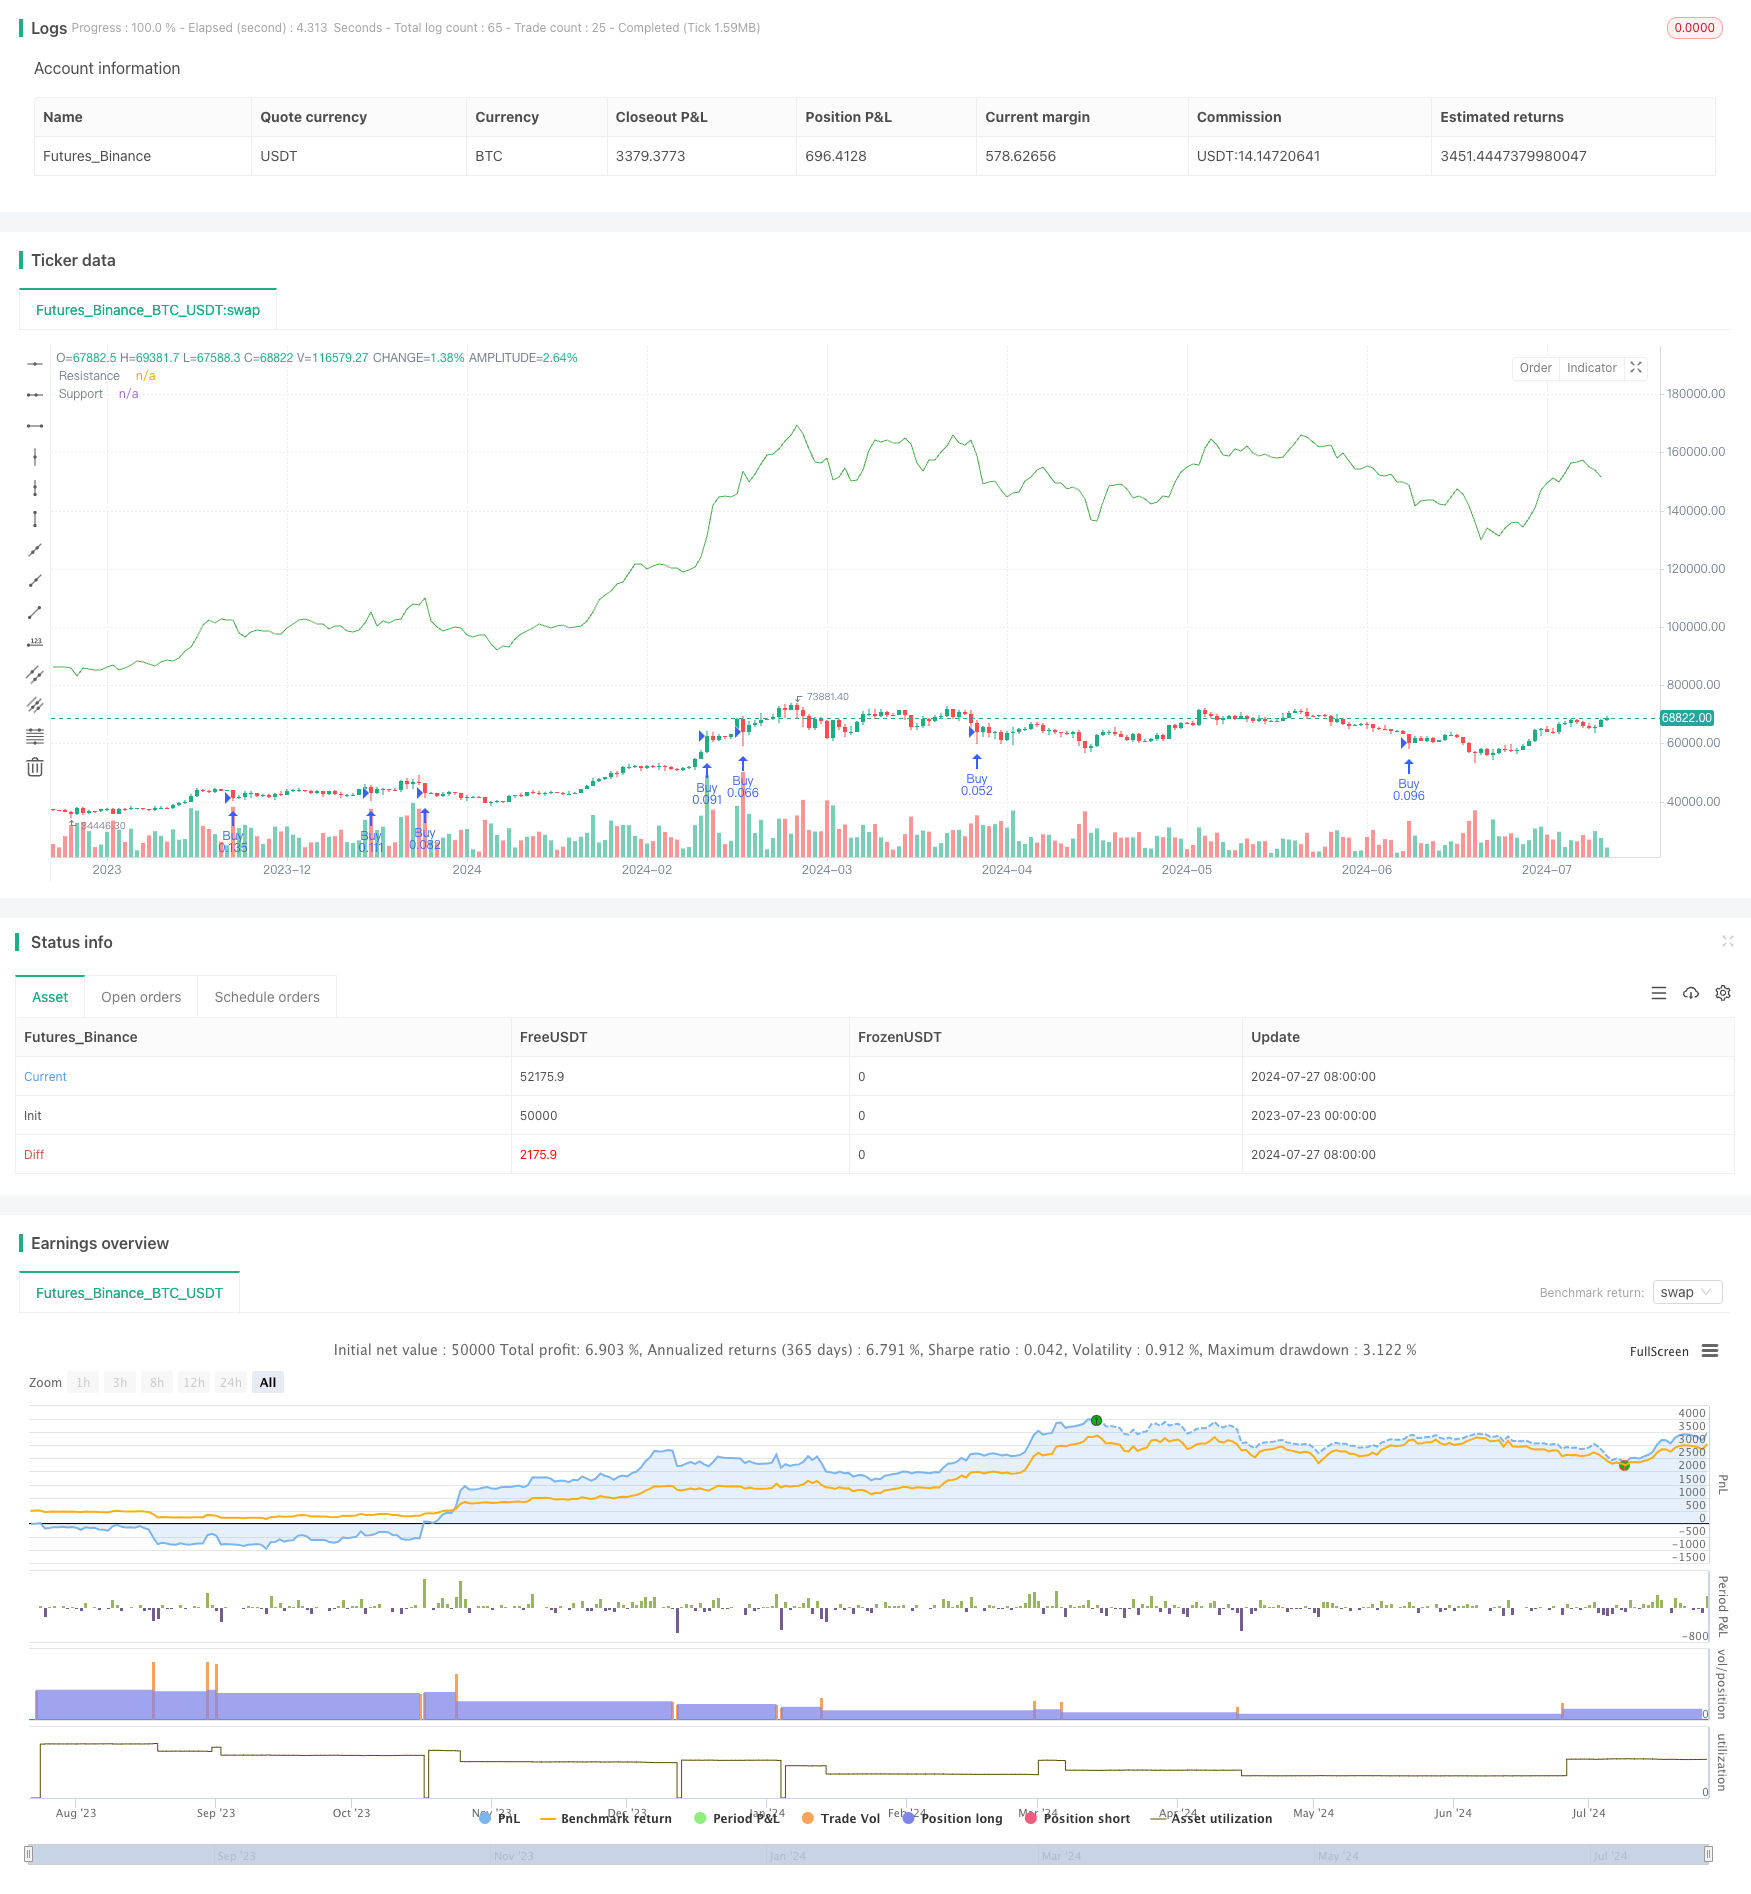
这个量化交易策略基于支撑位和阻力位的概念,结合了动态风险管理系统。它利用枢轴点(Pivot Points)来确定潜在的支撑和阻力水平,并在价格触及这些关键水平时进行交易。该策略还incorporates了自适应真实波幅(ATR)指标来动态调整止损和获利水平,以适应市场波动性的变化。此外,策略还考虑了资金管理和风险控制,通过限制每笔交易的最大金额和使用杠杆来优化资金利用率。
策略原理
-
支撑和阻力识别:
- 使用枢轴点计算方法来确定潜在的支撑和阻力水平。
- 枢轴点计算公式: (前一日最高价 + 前一日最低价 + 前一日收盘价) / 3
-
入场信号:
- 当价格触及或突破支撑位时,产生做多信号。
- 当价格触及或突破阻力位时,产生做空信号。
-
风险管理:
- 使用ATR指标来动态设置止损和获利水平。
- 止损设置为当前价格 +/- (2 * ATR)。
- 获利目标设置为当前价格 +/- (3 * ATR)。
-
仓位规模:
- 基于风险百分比和最大交易金额计算仓位大小。
- 考虑了杠杆因素,以优化资金利用。
-
交易执行:
- 使用策略.entry()函数执行交易。
- 使用策略.exit()函数管理止损和获利。
策略优势
-
动态适应性:通过使用ATR指标,策略能够根据市场波动性自动调整止损和获利水平,这使得策略在不同市场条件下都能保持有效性。
-
风险管理:策略incorporates了多层风险控制措施,包括动态止损、固定风险百分比和最大交易金额限制,有助于保护资金安全。
-
杠杆优化:通过合理使用杠杆,策略能够在控制风险的同时提高资金利用效率。
-
技术指标结合:策略combines了经典的技术分析概念(支撑阻力)与现代量化指标(ATR),形成了一个全面的交易系统。
-
灵活性:策略参数可以根据不同的市场和个人风险偏好进行调整,具有良好的适应性。
策略风险
-
假突破风险:在横盘市场中,价格可能频繁触及支撑阻力位但不形成真正的突破,导致频繁的假信号。
-
趋势市场表现:在强趋势市场中,策略可能会过早平仓,错过大幅度行情。
-
资金管理风险:虽然策略限制了每笔交易的最大金额,但在连续亏损情况下仍可能面临较大的回撤。
-
杠杆风险:使用高杠杆可能会放大亏损,特别是在市场剧烈波动时。
-
滑点和交易成本:策略未考虑滑点和交易成本,这可能会影响实际交易结果。
策略优化方向
-
趋势过滤:引入趋势指标(如移动平均线)来过滤交易信号,只在趋势方向上进行交易,以减少假突破。
-
多时间周期分析:结合更高时间周期的支撑阻力水平,提高交易信号的可靠性。
-
动态调整参数:使用自适应算法动态调整ATR乘数和风险百分比,以适应不同的市场状态。
-
增加交易过滤器:添加成交量确认、波动率过滤等额外条件,提高交易质量。
-
优化资金管理:实施动态的资金管理策略,根据账户盈利情况调整风险水平。
-
加入反转交易:在支撑位做多的同时,考虑在阻力位做空,以充分利用市场机会。
-
考虑基本面因素:整合经济日历数据,避免在重要新闻发布前后交易。
总结
支撑阻力策略结合动态风险管理系统是一个全面的量化交易策略,它巧妙地结合了传统技术分析与现代量化方法。通过使用枢轴点来识别关键价格水平,并利用ATR进行动态风险管理,该策略展现了适应不同市场条件的潜力。然而,为了进一步提高策略的稳健性和盈利能力,建议进行多方面的优化,包括增加趋势过滤、多时间周期分析和更复杂的资金管理技术。通过持续改进和回测,这个策略有潜力成为一个可靠的交易系统,为量化交易者提供价值。
||
Overview
This quantitative trading strategy is based on the concept of support and resistance levels, combined with a dynamic risk management system. It utilizes Pivot Points to determine potential support and resistance levels, and executes trades when the price touches these key levels. The strategy also incorporates the Adaptive True Range (ATR) indicator to dynamically adjust stop-loss and take-profit levels, adapting to changes in market volatility. Additionally, the strategy considers money management and risk control by limiting the maximum amount per trade and using leverage to optimize capital utilization.
Strategy Principles
-
Support and Resistance Identification:
- Uses Pivot Point calculation method to determine potential support and resistance levels.
- Pivot Point formula: (Previous Day High + Previous Day Low + Previous Day Close) / 3
-
Entry Signals:
- Generates a long signal when the price touches or breaks through the support level.
- Generates a short signal when the price touches or breaks through the resistance level.
-
Risk Management:
- Uses the ATR indicator to dynamically set stop-loss and take-profit levels.
- Stop-loss is set at current price +/- (2 * ATR).
- Take-profit target is set at current price +/- (3 * ATR).
-
Position Sizing:
- Calculates position size based on risk percentage and maximum trade amount.
- Considers leverage factor to optimize capital utilization.
-
Trade Execution:
- Uses strategy.entry() function to execute trades.
- Uses strategy.exit() function to manage stop-loss and take-profit.
Strategy Advantages
-
Dynamic Adaptability: By using the ATR indicator, the strategy can automatically adjust stop-loss and take-profit levels based on market volatility, making it effective under different market conditions.
-
Risk Management: The strategy incorporates multiple layers of risk control measures, including dynamic stop-loss, fixed risk percentage, and maximum trade amount limit, helping to protect capital safety.
-
Leverage Optimization: Through reasonable use of leverage, the strategy can improve capital efficiency while controlling risk.
-
Technical Indicator Combination: The strategy combines classic technical analysis concepts (support and resistance) with modern quantitative indicators (ATR), forming a comprehensive trading system.
-
Flexibility: Strategy parameters can be adjusted according to different markets and personal risk preferences, showing good adaptability.
Strategy Risks
-
False Breakout Risk: In range-bound markets, prices may frequently touch support and resistance levels without forming true breakouts, leading to frequent false signals.
-
Performance in Trending Markets: In strong trend markets, the strategy may close positions too early, missing out on significant price movements.
-
Money Management Risk: Although the strategy limits the maximum amount per trade, it may still face significant drawdowns in case of consecutive losses.
-
Leverage Risk: Using high leverage can amplify losses, especially during extreme market volatility.
-
Slippage and Trading Costs: The strategy does not consider slippage and trading costs, which may affect actual trading results.
Strategy Optimization Directions
-
Trend Filtering: Introduce trend indicators (such as moving averages) to filter trade signals, only trading in the direction of the trend to reduce false breakouts.
-
Multi-Timeframe Analysis: Incorporate support and resistance levels from higher timeframes to improve the reliability of trading signals.
-
Dynamic Parameter Adjustment: Use adaptive algorithms to dynamically adjust ATR multipliers and risk percentages to adapt to different market states.
-
Add Trading Filters: Include additional conditions such as volume confirmation and volatility filters to improve trade quality.
-
Optimize Money Management: Implement a dynamic money management strategy, adjusting risk levels based on account performance.
-
Add Reversal Trades: While going long at support levels, consider going short at resistance levels to fully utilize market opportunities.
-
Consider Fundamental Factors: Integrate economic calendar data to avoid trading before and after important news releases.
Conclusion
The Support and Resistance Strategy with Dynamic Risk Management System is a comprehensive quantitative trading strategy that cleverly combines traditional technical analysis with modern quantitative methods. By using Pivot Points to identify key price levels and utilizing ATR for dynamic risk management, the strategy demonstrates potential to adapt to different market conditions. However, to further improve the strategy's robustness and profitability, it is recommended to implement various optimizations, including adding trend filters, multi-timeframe analysis, and more sophisticated money management techniques. Through continuous improvement and backtesting, this strategy has the potential to become a reliable trading system, providing value for quantitative traders.
[/trans]
Source (PineScript)
/*backtest
start: 2023-07-23 00:00:00
end: 2024-07-28 00:00:00
period: 1d
basePeriod: 1h
exchanges: [{"eid":"Futures_Binance","currency":"BTC_USDT"}]
*/

//@version=5
strategy('Mon Robot de Trading', overlay=true)

// Paramètres
capital = 2000  // Capital initial de 2000 euros
maxAmountPerTrade = 2000  // Montant maximum à utiliser par trade
leverage = 20  // Effet de levier de 1:20
spread = 0.5  // Spread moyen en pips
riskPerTrade = 0.2  // 20% du capital initial par transaction
atrLength = 14  // Longueur de l'ATR pour le trailing stop

// Calcul des points de pivot
pivotHigh = high[1] + low[1] + close[1] / 3
pivotLow = high[1] + low[1] + close[1] / 3

// Plot des points de pivot sur le graphique
plot(pivotHigh, color=color.new(color.red, 0), linewidth=1, title='Resistance')
plot(pivotLow, color=color.new(color.green, 0), linewidth=1, title='Support')

// Calcul de l'ATR pour la gestion du risque et du trailing stop
atrValue = ta.atr(atrLength)

// Calcul de la taille de la position basée sur le pourcentage de risque du capital et le montant maximum par trade
riskAmount = capital * riskPerTrade
positionSize = math.min(maxAmountPerTrade * leverage / (atrValue * 2), riskAmount / (atrValue * 2))  // Taille de la position en lots limitée par le montant maximum par trade et le risque autorisé

// Implémentation de la stratégie avec trailing stop et take-profit
if low <= pivotLow
    strategy.entry('Buy', strategy.long, qty=positionSize)

    // Définition de l'exit pour les achats (longs)
    stopLossPrice = close - (atrValue * 2 + spread / 10)
    takeProfitPrice = close + atrValue * 3 - spread / 10
    strategy.exit('Exit Buy', 'Buy', stop=stopLossPrice, limit=takeProfitPrice)

if high >= pivotHigh
    strategy.entry('Sell', strategy.short, qty=positionSize)

    // Définition de l'exit pour les ventes (courts)
    stopLossPrice = close + atrValue * 2 + spread / 10
    takeProfitPrice = close - (atrValue * 3 - spread / 10)
    strategy.exit('Exit Sell', 'Sell', stop=stopLossPrice, limit=takeProfitPrice)
Detail
https://www.fmz.com/strategy/458035
Last Modified
2024-07-29 14:01:49