
5.1 KiB
Name
捕捉底部策略Bottom-Catching-Strategy
Author
ChaoZhang
Strategy Description
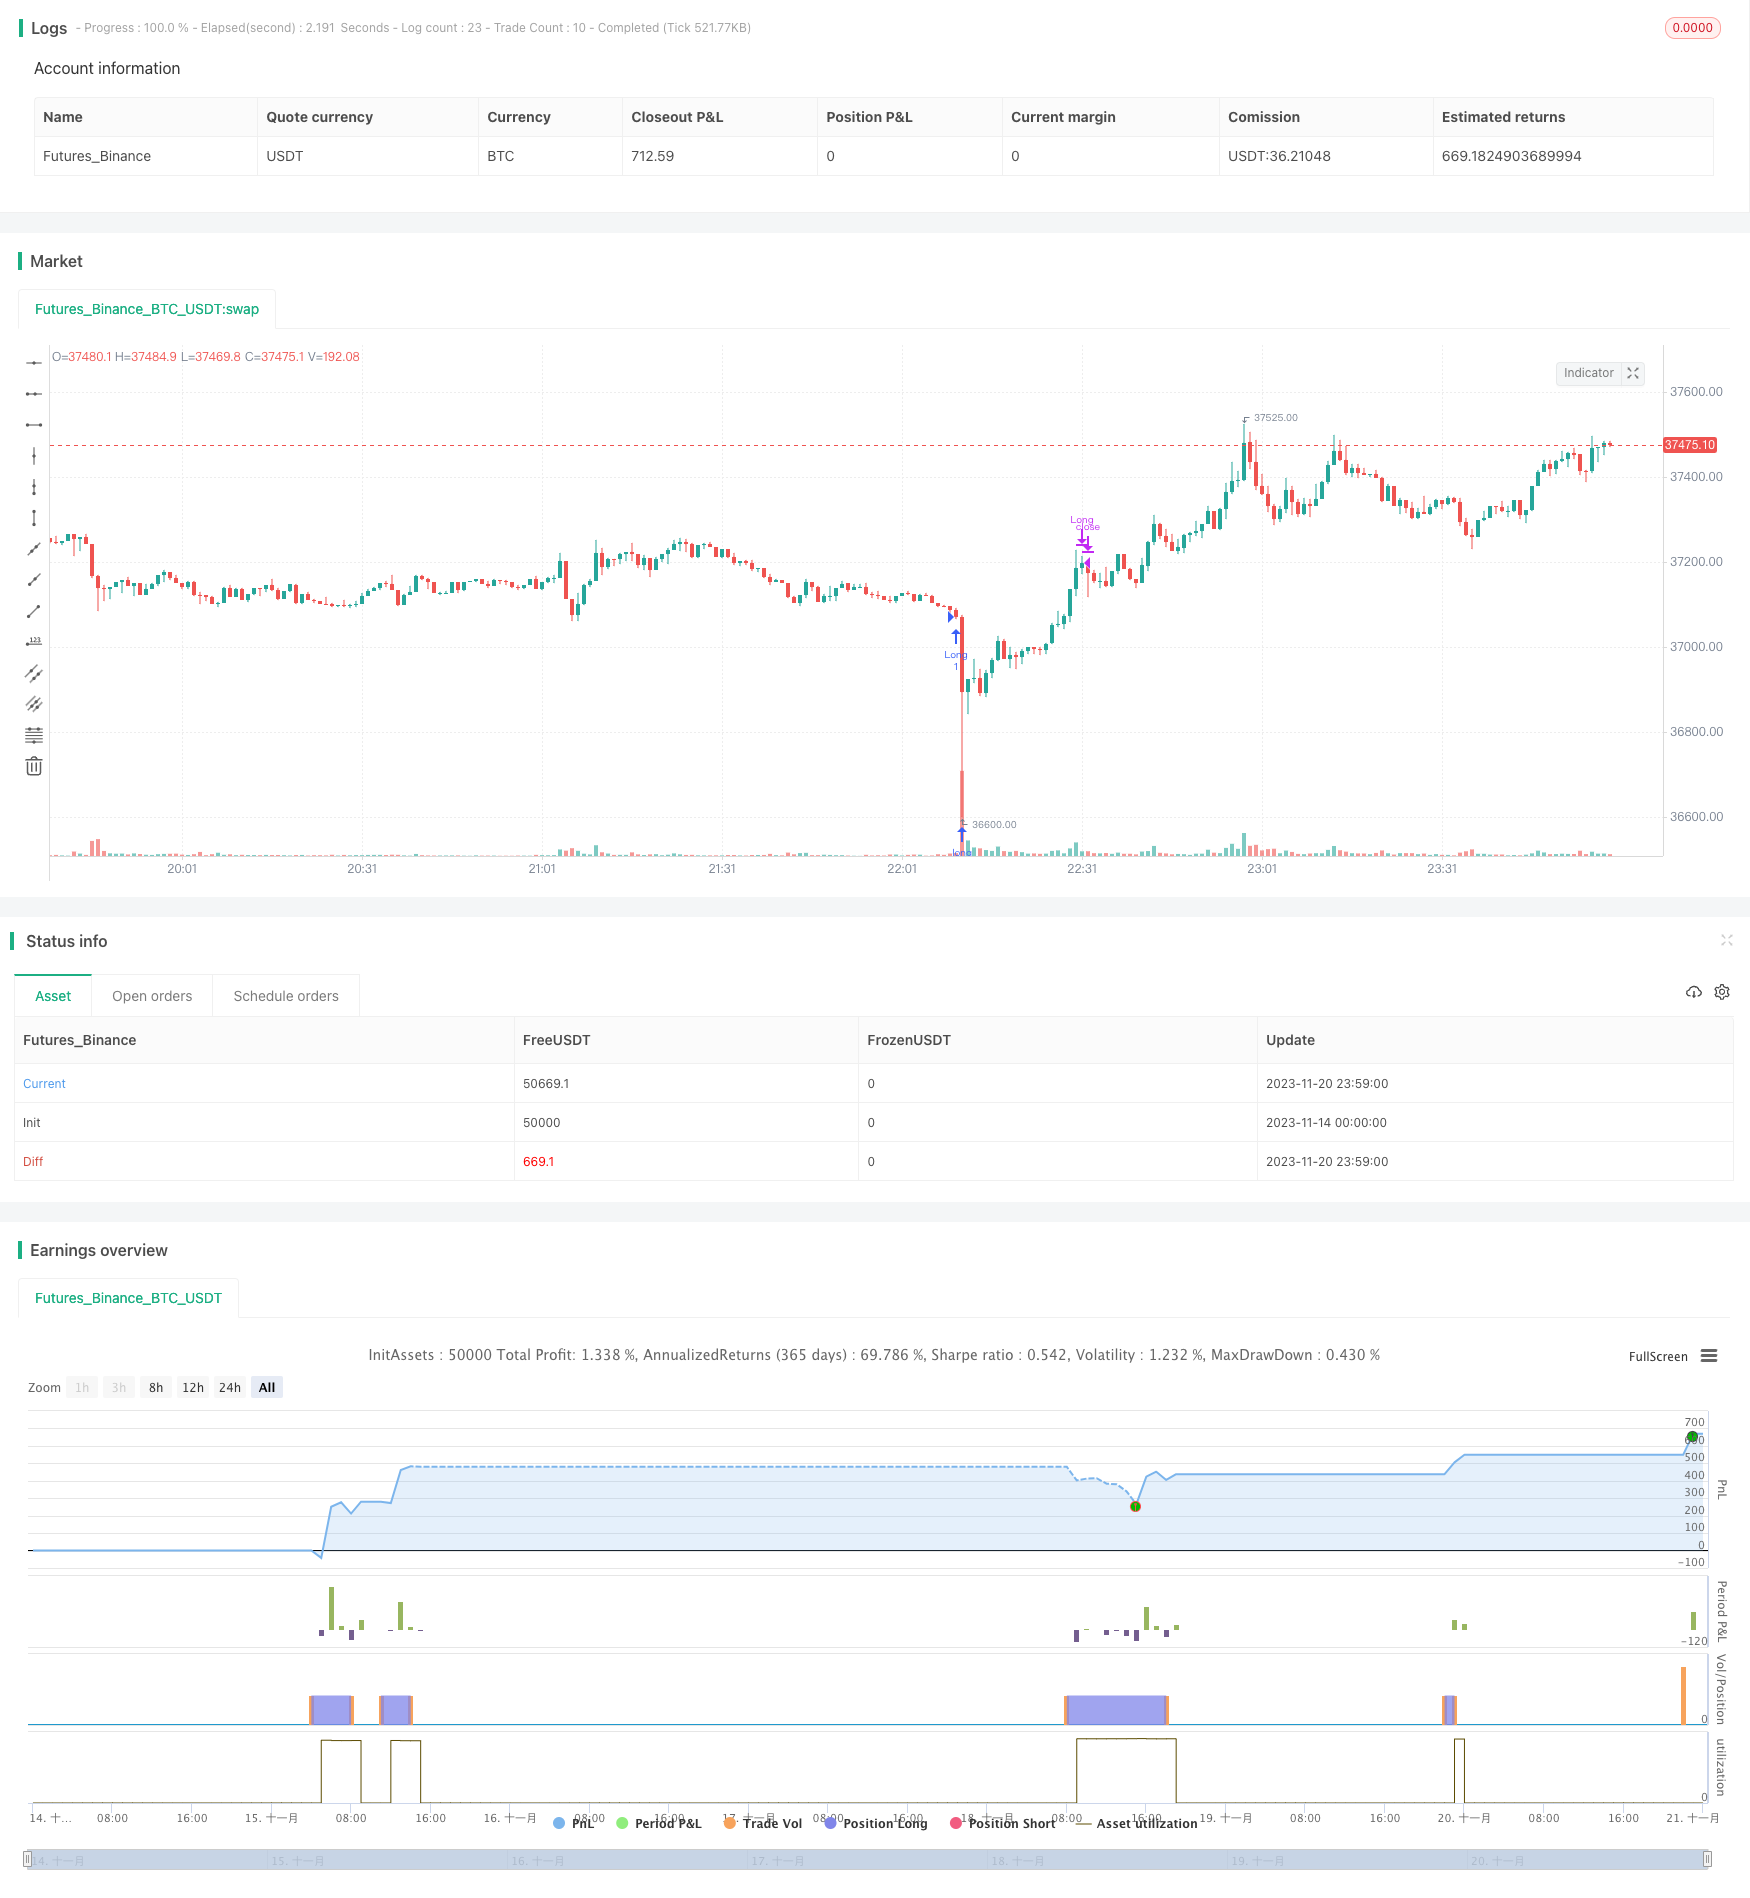
[trans]
概述
该策略利用RSI和EMA指标来决定入场和退出。它在熊市中表现良好,可以捕捉底部反弹机会。
策略原理
该策略基于以下买入和卖出条件:
买入条件:
- RSI < 40
- RSI 比昨日下降3点
- 50日EMA下穿100日EMA
卖出条件:
- RSI > 65
- 9日EMA上穿50日EMA
这样可以在跌势中买入,在反弹中高位卖出,捕捉底部反弹机会。
优势分析
该策略具有以下优势:
- 利用RSI捕捉超跌机会
- EMA形态判断趋势变化点
- 回测结果良好,特别在熊市中表现抗跌
- 可配置参数调整策略
风险分析
该策略也存在以下风险:
- 参数设置不当可能导致过早买入或迟滞卖出
- 反弹不一定能及时出现或无法持续
- 交易费用和滑点也会影响实际盈利
可通过调整参数优化策略,或结合其他指标判断多空格局。
优化方向
该策略可以从以下方向进行优化:
- 根据不同币种分别测试参数组合
- 结合交易量变化判断买卖信号效力
- 增加止损点,降低单笔亏损风险
- 考虑动态调整仓位规模
总结
该捕捉底部策略整体来说逻辑清晰,在熊市中能较好发挥作用。通过参数调整和优化空间还大,可望获得更好回测指标。但实盘过程中也需要关注风险,无法完全规避亏损情况。
||
Overview
This strategy utilizes the RSI and EMA indicators to determine entries and exits. It performs well in bear markets and can catch bottom rebound opportunities.
Strategy Logic
The strategy is based on the following entry and exit conditions:
Entry conditions:
- RSI < 40
- RSI is 3 points lower than previous day
- 50-day EMA crosses below 100-day EMA
Exit conditions:
- RSI > 65
- 9-day EMA crosses above 50-day EMA
This allows buying on dips and selling at highs during bounces, catching bottom rebound opportunities.
Advantage Analysis
The strategy has the following advantages:
- Utilize RSI to catch oversold opportunities
- EMA patterns to spot trend change points
- Good backtesting results, especially resilience in bear markets
- Configurable parameters to adjust strategy
Risk Analysis
The strategy also has the following risks:
- Improper parameter tuning may cause premature entries or delayed exits
- Rebounds may not materialize or sustain
- Trading fees and slippage also affect actual profit
Parameters can be optimized, or other indicators combined to determine market structure.
Optimization Directions
The strategy can be improved in the following ways:
- Test parameter combinations separately for different coins
- Incorporate volume changes to confirm signals
- Add stop loss to limit single trade loss
- Consider dynamic position sizing
Conclusion
The bottom catching strategy has clear logic and works well in bear markets. More parameter tuning and optimizations can lead to better backtest results. But risks need to be monitored in live trading, and losses cannot be entirely avoided.
[/trans]
Strategy Arguments
| Argument | Default | Description |
|---|---|---|
| v_input_1 | true | Show Date Range |
| v_input_2 | 14 | length |
Source (PineScript)
/*backtest
start: 2023-11-14 00:00:00
end: 2023-11-21 00:00:00
period: 1m
basePeriod: 1m
exchanges: [{"eid":"Futures_Binance","currency":"BTC_USDT"}]
*/

// This source code is subject to the terms of the Mozilla Public License 2.0 at https://mozilla.org/MPL/2.0/
// © Coinrule

//@version=5
strategy("V3 - Catching the Bottom",
         overlay=true)

showDate = input(defval=true, title='Show Date Range')
timePeriod = time >= timestamp(syminfo.timezone, 2022, 4, 1, 0, 0)
notInTrade = strategy.position_size <= 0

//==================================Buy Conditions============================================

//RSI
length = input(14)
vrsi = ta.rsi(close, length)

buyCondition1 = vrsi < 40

//RSI decrease
decrease = 3
buyCondition2 = (vrsi < vrsi[1] - decrease)
//sellCondition1 = request.security(syminfo.tickerid, "15", buyCondition2)

//EMAs
fastEMA = ta.sma(close, 50)
slowEMA = ta.sma(close, 100)
buyCondition3 = ta.crossunder(fastEMA, slowEMA)
//buyCondition2 = request.security(syminfo.tickerid, "15", buyCondition3)

if(buyCondition1 and buyCondition2 and buyCondition3 and timePeriod)
    strategy.entry(id='Long', direction = strategy.long)

//==================================Sell Conditions============================================

sellCondition1 = vrsi > 65

EMA9 = ta.sma(close, 9)
EMA50 = ta.sma(close, 50)
sellCondition2 = ta.crossover(EMA9, EMA50)

if(sellCondition1 and sellCondition2 and timePeriod)
    strategy.close(id='Long')

//Best on: ETH 5mins (7.59%), BNB 5mins (5.42%), MATIC 30mins (15.61%), XRP 45mins (10.14%) ---> EMA
//Best on: MATIC 2h (16.09%), XRP 15m (5.25%), SOL 15m (4.28%), AVAX 5m (3.19%)
Detail
https://www.fmz.com/strategy/432897
Last Modified
2023-11-22 15:46:19