
7.2 KiB
Name
指数移动平均线交叉结合动态止损策略-EMA-Crossover-Strategy-with-Dynamic-Trailing-Stop-Loss
Author
ianzeng123
Strategy Description
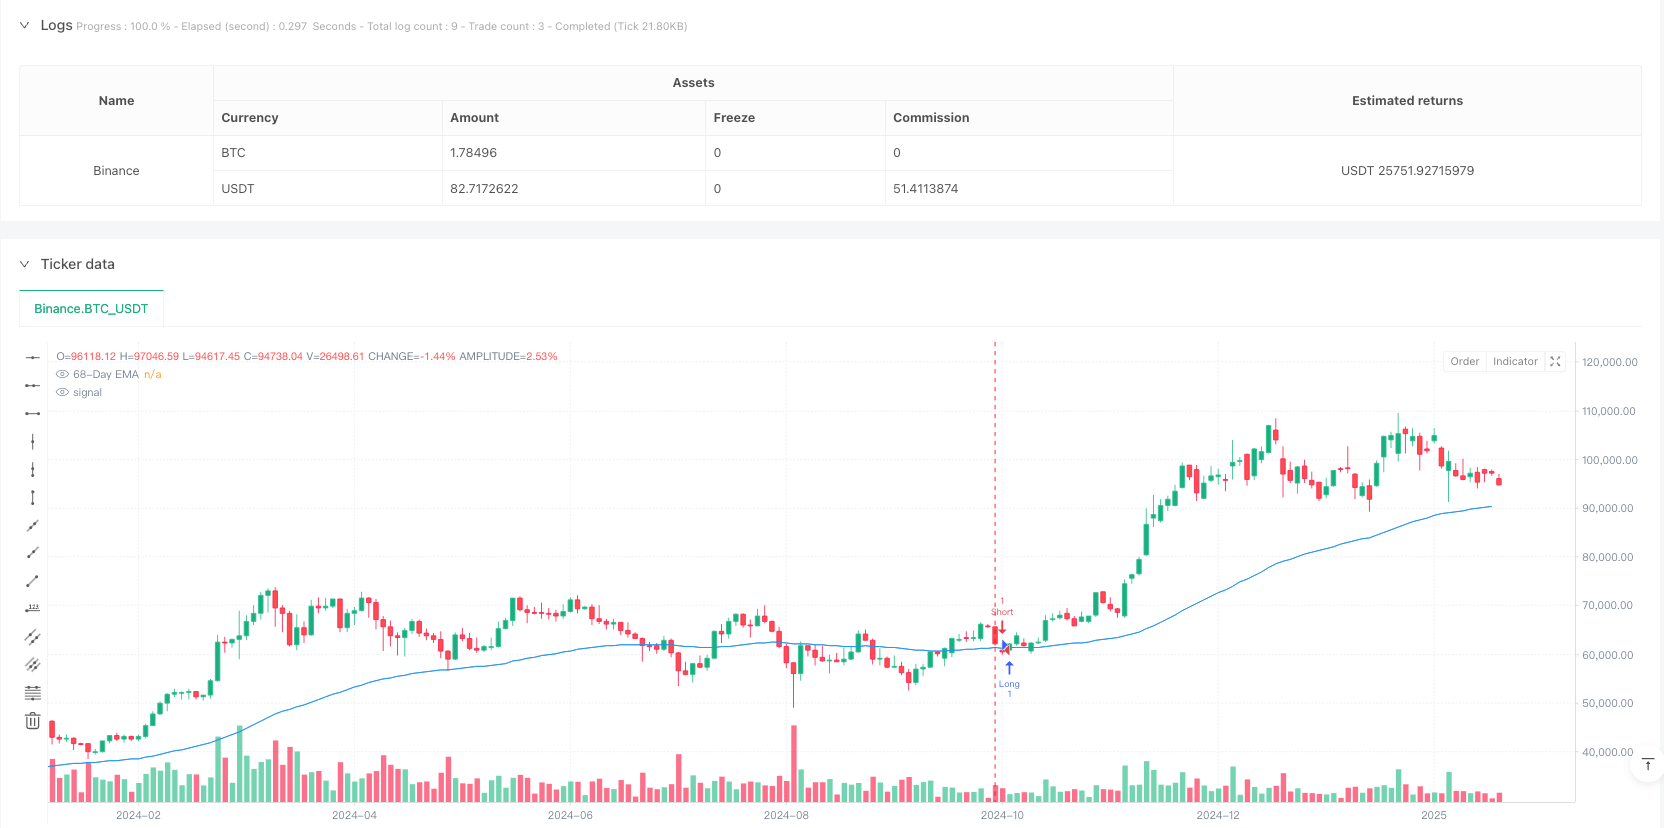
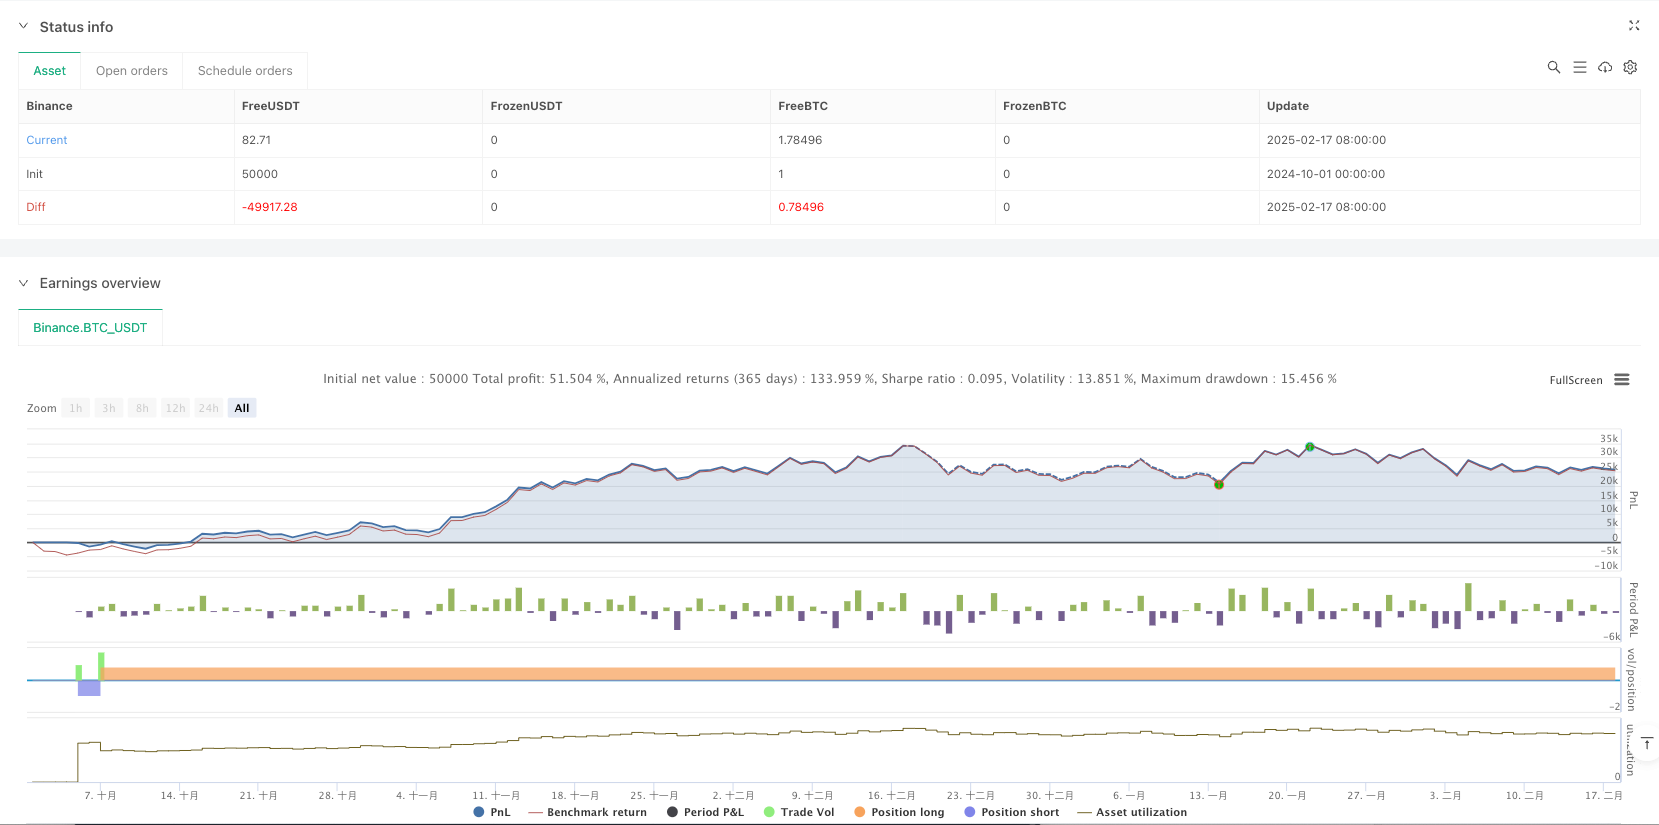
[trans]
概述
本策略是一个基于68周期指数移动平均线(EMA)的趋势跟踪交易系统,结合了动态止损机制。该策略通过价格与EMA的交叉来识别市场趋势,同时运用初始止损和追踪止损来管理风险,实现在趋势市场中的稳健交易。
策略原理
策略运用68周期EMA作为核心指标来判断市场趋势。当价格向上穿越EMA时,系统开立多头仓位;当价格向下穿越EMA时,系统开立空头仓位。为了有效管理风险,策略设置了两层止损保护机制:初始止损和追踪止损。初始止损距离入场价格20个点,当价格朝有利方向移动超过初始止损距离时,止损价格会随之调整10个点,从而锁定部分盈利。
策略优势
- 趋势跟踪能力强:68周期EMA能有效过滤市场噪音,捕捉中长期趋势。
- 风险控制完善:双重止损机制既保护本金又能锁定利润。
- 参数可调性强:EMA周期、止损点数等参数可根据不同市场特征灵活调整。
- 策略逻辑清晰:入场、出场条件明确,便于实盘操作和监控。
- 自动化程度高:策略可完全实现程序化交易,减少人为干预。
策略风险
-
震荡市场风险:在横盘震荡市场中可能频繁触发止损。 建议措施:增加趋势确认指标,如ADX等。
-
跳空风险:市场大幅跳空可能导致实际止损价格偏离预期。 建议措施:考虑使用期权对冲或调整持仓规模。
-
参数优化风险:过度优化参数可能导致策略失效。 建议措施:采用走样本外测试,确保参数稳定性。
策略优化方向
-
趋势确认机制:建议引入趋势强度指标(如ADX、MACD等),提高趋势判断准确性。
-
动态参数调整:可根据市场波动率自动调整EMA周期和止损参数。
-
仓位管理优化:引入基于波动率的动态仓位管理系统。
-
多周期协同:结合更长周期趋势判断,提高交易方向准确性。
总结
该策略通过结合EMA趋势跟踪和动态止损管理,构建了一个完整的交易系统。策略的核心优势在于其清晰的交易逻辑和完善的风险控制机制。通过建议的优化方向,策略的稳定性和盈利能力有望得到进一步提升。策略适合追求稳健收益的中长期投资者使用。 ||
Overview
This strategy is a trend-following trading system based on the 68-period Exponential Moving Average (EMA) combined with a dynamic stop-loss mechanism. It identifies market trends through price-EMA crossovers while employing initial and trailing stop-losses for risk management, enabling robust trading in trending markets.
Strategy Principles
The strategy utilizes a 68-period EMA as its core indicator for trend determination. Long positions are initiated when price crosses above the EMA, while short positions are taken when price crosses below. Risk management is implemented through a dual stop-loss mechanism: an initial stop-loss and a trailing stop-loss. The initial stop-loss is set at 20 points from the entry price, and when price moves favorably beyond the initial stop-loss distance, the stop-loss price adjusts by 10 points to lock in partial profits.
Strategy Advantages
- Strong trend-following capability: 68-period EMA effectively filters market noise and captures medium to long-term trends.
- Comprehensive risk control: Dual stop-loss mechanism protects capital while securing profits.
- Flexible parameters: EMA period and stop-loss points can be adjusted according to different market characteristics.
- Clear strategy logic: Well-defined entry and exit conditions facilitate live trading and monitoring.
- High automation level: Strategy can be fully automated, reducing manual intervention.
Strategy Risks
-
Sideways market risk: Frequent stop-losses may be triggered in range-bound markets. Recommended solution: Add trend confirmation indicators like ADX.
-
Gap risk: Large market gaps may cause actual stop-loss prices to deviate from expected levels. Recommended solution: Consider options hedging or position size adjustment.
-
Parameter optimization risk: Over-optimization may lead to strategy failure. Recommended solution: Implement out-of-sample testing to ensure parameter stability.
Strategy Optimization Directions
-
Trend confirmation mechanism: Suggest incorporating trend strength indicators (such as ADX, MACD) to improve trend identification accuracy.
-
Dynamic parameter adjustment: Automatically adjust EMA period and stop-loss parameters based on market volatility.
-
Position management optimization: Introduce volatility-based dynamic position sizing system.
-
Multi-timeframe correlation: Incorporate longer-term trend analysis to improve trade direction accuracy.
Summary
This strategy builds a complete trading system by combining EMA trend following with dynamic stop-loss management. Its core strengths lie in clear trading logic and comprehensive risk control mechanisms. Through the suggested optimization directions, the strategy's stability and profitability can be further enhanced. The strategy is suitable for medium to long-term investors seeking steady returns.[/trans]
Source (PineScript)
/*backtest
start: 2024-10-01 00:00:00
end: 2025-02-18 08:00:00
period: 2d
basePeriod: 2d
exchanges: [{"eid":"Binance","currency":"BTC_USDT"}]
*/

//@version=5
strategy("EMA 68 with Trailing Stop-Loss", overlay=true)

// Inputs for customization
length_ema = input(68, title="EMA Length")
initial_stop_loss_points = input(20, title="Initial Stop Loss in Points")
trail_distance = input(10, title="Trailing Stop Adjustment in Points")

ema68 = ta.ema(close, length_ema)

// Plot EMA
plot(ema68, color=color.blue, title="68-Day EMA")

var float entry_price = na // Store entry price
var bool is_long = false // Track if we are in a long trade
var bool is_short = false // Track if we are in a short trade

// Buy Condition: Close above 68-day EMA
if ta.crossover(close, ema68)
    strategy.entry("Long", strategy.long)
    entry_price := close
    is_long := true
    is_short := false

// Sell Condition: Close below 68-day EMA
if ta.crossunder(close, ema68)
    strategy.entry("Short", strategy.short)
    entry_price := close
    is_long := false
    is_short := true

// Long Exit Conditions
if is_long
    stop_loss = entry_price - initial_stop_loss_points
    trail_price = entry_price + initial_stop_loss_points
    if close >= trail_price
        stop_loss := entry_price + trail_distance
    strategy.exit("LongExit", "Long", stop=stop_loss, when=close < ema68)

// Short Exit Conditions
if is_short
    stop_loss = entry_price + initial_stop_loss_points
    trail_price = entry_price - initial_stop_loss_points
    if close <= trail_price
        stop_loss := entry_price - trail_distance
    strategy.exit("ShortExit", "Short", stop=stop_loss, when=close > ema68)
Detail
https://www.fmz.com/strategy/482840
Last Modified
2025-02-20 14:17:56