
17 KiB
Name
指数移动平均突破倒轨交易系统-Exponential-Moving-Average-Breakout-Reversal-Trading-System
Author
ianzeng123
Strategy Description
[trans]
概述
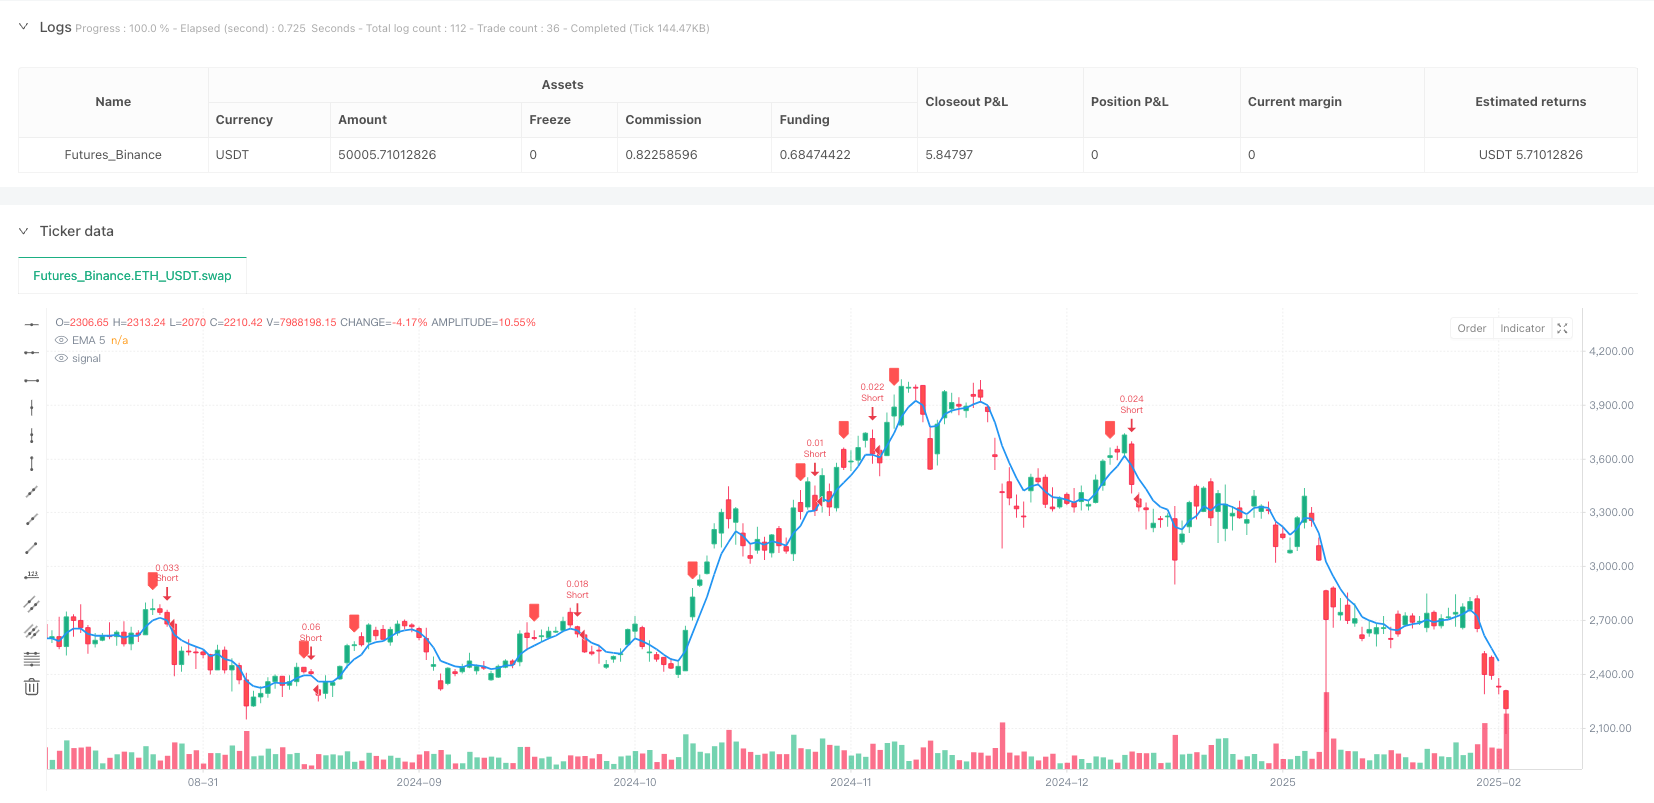
指数移动平均突破倒轨交易系统是一种基于短期EMA(指数移动平均线)交互作用的量化交易策略,主要针对市场反转点进行精准做空操作。该策略核心在于识别与5周期EMA的特殊关系模式,通过"预警蜡烛"的形成和随后的价格突破,捕捉短期下跌趋势的开始。系统采用动态仓位计算方法,根据预警蜡烛的波动范围自动调整交易数量,确保每笔交易固定风险额度,实现精确的资金管理。
策略原理
该策略的运作基于几个关键的技术组件和精确的执行逻辑:
-
EMA交互检测机制: 系统监控价格与5周期EMA的关系,要求前三根蜡烛必须触及或接近EMA,而当前蜡烛必须明显高于EMA(不触及)。这种脱离EMA的行为是潜在反转的第一个信号。
-
预警蜡烛识别: 当满足上述EMA交互条件时,当前蜡烛被标记为"预警蜡烛",系统记录其高点和低点作为后续交易的参考点。
-
做空入场条件: 系统等待下一根蜡烛突破预警蜡烛的低点。当这一突破发生时,触发做空入场信号。
-
动态仓位计算:
- 预警蜡烛范围 = 高点 - 低点
- 仓位大小 = 固定风险($2) / 预警蜡烛范围
- 使用资金 = 仓位大小 × 做空入场价格
-
风险管理参数:
- 止损位: 设置在预警蜡烛的高点
- 获利目标: 等于止损距离(1:1风险回报比)
-
视觉辅助工具: 策略在图表上提供直观的视觉标记,包括EMA线、预警蜡烛标记、交易设置线(入场、止损、获利)以及使用资金标签。
代码实现了一套完整的条件逻辑,确保只有在满足所有条件后才执行交易,同时通过持久变量(varip)存储关键价格水平和交易状态,保持策略的连续性和准确性。
策略优势
-
简单有效的反转捕捉: 该策略能够通过明确的技术指标组合,有效识别潜在的市场反转点,尤其适合捕捉短期下跌趋势的开始。
-
精确的风险控制: 通过固定每笔交易的风险金额($2),实现了一致性的风险管理,避免了情绪化决策可能带来的过度风险。
-
动态仓位调整: 策略根据市场实际波动性(预警蜡烛范围)动态计算仓位大小,在不同波动条件下自动调整,使系统能够适应不同市场环境。
-
清晰的视觉反馈: 交易信号、入场点、止损和获利目标都在图表上直观显示,使交易者能够轻松理解和执行交易决策。
-
自动化执行: 策略完全可编程,允许自动执行交易,减少了人为干预和情绪偏差的影响。
-
资金使用透明: 每笔交易的资金使用量都清晰显示在图表上,帮助交易者实时监控资金使用情况。
策略风险
-
假突破风险: 市场可能产生假突破,导致价格突破预警蜡烛低点后又迅速反弹,触发止损。可以通过增加确认指标(如成交量确认)或等待突破后的回测来减少假突破风险。
-
1:1风险回报比限制: 策略使用1:1的风险回报比设置获利目标,这在某些市场条件下可能不够优化。考虑实施动态获利目标或尾随止损可能会提高整体收益表现。
-
过度交易风险: 在横盘或低波动性市场中,策略可能会生成过多的预警蜡烛信号,导致过度交易。可以添加额外的市场环境过滤器,如波动性指标或趋势强度过滤器。
-
单一指标依赖: 策略主要依赖于与5EMA的关系,没有使用其他技术指标进行确认。这可能导致在某些市场条件下的信号质量下降。建议增加辅助指标,如RSI或MACD进行信号确认。
-
固定风险金额限制: 尽管固定风险($2)提供了一致性,但它可能不适合所有账户规模。较大账户可能需要更大的风险金额,而较小账户可能需要更小的风险金额。建议将风险金额设置为账户总额的百分比。
策略优化方向
-
多时间框架分析集成: 通过添加更高时间框架的趋势确认,可以显著提高信号质量。例如,只在日线趋势向下时执行15分钟图表上的做空信号,可以减少逆势交易的风险。
-
自适应风险回报比: 根据市场波动性或支撑阻力水平调整风险回报比,而不是固定使用1:1。在强劲下跌趋势中,可以设置更大的获利目标(如1:2或1:3)。
-
动态EMA周期: 当前策略使用固定的5周期EMA。实施自适应EMA周期,根据市场波动性自动调整(例如,在低波动性环境中使用更短的EMA,在高波动性环境中使用更长的EMA),可能会提高策略适应性。
-
添加成交量确认: 成交量是确认价格行为有效性的关键指标。通过要求突破预警蜡烛低点时有高于平均的成交量,可以减少假突破交易。
-
整合市场环境过滤器: 添加市场环境分类逻辑(如趋势、横盘、高波动、低波动),并根据不同环境调整策略参数或甚至完全避免在不利环境中交易。
-
止损优化: 考虑使用更智能的止损放置方法,如基于ATR(平均真实范围)的止损或最近N根蜡烛的最高点,可能比使用预警蜡烛高点更有效。
总结
指数移动平均突破倒轨交易系统是一个设计精良的量化交易策略,特别适合短线交易者捕捉市场反转点和短期下跌趋势。其核心优势在于结合了明确的技术指标(5EMA)、精确的入场条件(预警蜡烛和突破)以及系统化的资金管理(动态仓位计算)。
该策略的风险管理框架通过固定每笔交易的风险金额并基于实际市场波动性动态调整仓位,提供了一种纪律严明的交易方法。策略的视觉辅助系统也增强了执行的便捷性和清晰度。
然而,为了提高策略的稳健性和适应性,建议考虑整合多时间框架分析、增加辅助确认指标、优化风险回报设置以及添加市场环境过滤器。这些优化可以减少假信号,提高盈利交易的比例,并使策略在不同市场条件下都能保持良好表现。
总的来说,这是一个结构清晰、逻辑严密的交易系统,既适合经验丰富的交易者作为主要策略使用,也适合新手交易者学习量化交易的基本原则。通过持续的回测和优化,该策略有潜力成为一个可靠的交易工具,为投资组合带来稳定回报。 ||
Overview
The Exponential Moving Average Breakout Reversal Trading System is a quantitative trading strategy based on short-term EMA (Exponential Moving Average) interactions, specifically designed for precise short-selling at market reversal points. The core of this strategy lies in identifying special relationship patterns with the 5-period EMA, capturing the beginning of short-term downtrends through the formation of an "Alert Candle" and subsequent price breakdowns. The system employs a dynamic position sizing calculation method, automatically adjusting trading quantities based on the Alert Candle's range to ensure a fixed risk amount per trade, achieving precise capital management.
Strategy Principles
The operation of this strategy is based on several key technical components and precise execution logic:
-
EMA Interaction Detection Mechanism: The system monitors the relationship between price and the 5-period EMA, requiring the previous three candles to touch or be close to the EMA, while the current candle must be significantly above the EMA (not touching it). This separation from the EMA serves as the first signal of a potential reversal.
-
Alert Candle Identification: When the above EMA interaction conditions are met, the current candle is marked as an "Alert Candle," and the system records its high and low points as reference points for subsequent trades.
-
Short Entry Condition: The system waits for the next candle to break below the low of the Alert Candle. When this breakthrough occurs, a short entry signal is triggered.
-
Dynamic Position Sizing Calculation:
- Alert Candle Range = High - Low
- Position Size = Fixed Risk ($2) / Alert Candle Range
- Capital Used = Position Size × Short Entry Price
-
Risk Management Parameters:
- Stop Loss: Set at the high of the Alert Candle
- Profit Target: Equal to the stop loss distance (1:1 risk-reward ratio)
-
Visual Aid Tools: The strategy provides intuitive visual markers on the chart, including the EMA line, Alert Candle marker, trade setup lines (entry, stop loss, take profit), and a capital used label.
The code implements a complete conditional logic set, ensuring trades are executed only when all conditions are met, while using persistent variables (varip) to store key price levels and trade status, maintaining strategy continuity and accuracy.
Strategy Advantages
-
Simple and Effective Reversal Capture: The strategy can effectively identify potential market reversal points through a clear combination of technical indicators, particularly suitable for capturing the beginning of short-term downtrends.
-
Precise Risk Control: By fixing the risk amount for each trade ($2), the strategy achieves consistent risk management, avoiding the excessive risk that might come from emotional decision-making.
-
Dynamic Position Adjustment: The strategy dynamically calculates position size based on actual market volatility (Alert Candle range), automatically adjusting under different volatility conditions, allowing the system to adapt to various market environments.
-
Clear Visual Feedback: Trading signals, entry points, stop losses, and profit targets are all visually displayed on the chart, making it easy for traders to understand and execute trading decisions.
-
Automated Execution: The strategy is fully programmable, allowing for automated execution of trades, reducing the impact of human intervention and emotional bias.
-
Transparent Capital Usage: The amount of capital used for each trade is clearly displayed on the chart, helping traders monitor capital usage in real-time.
Strategy Risks
-
False Breakout Risk: The market may produce false breakouts, causing the price to break below the Alert Candle's low and then quickly rebound, triggering the stop loss. This risk can be reduced by adding confirmation indicators (such as volume confirmation) or waiting for a retest after the breakout.
-
1:1 Risk-Reward Ratio Limitation: The strategy uses a 1:1 risk-reward ratio to set profit targets, which may not be optimal under certain market conditions. Consider implementing dynamic profit targets or trailing stops to potentially improve overall performance.
-
Overtrading Risk: In sideways or low-volatility markets, the strategy may generate too many Alert Candle signals, leading to overtrading. Additional market environment filters, such as volatility indicators or trend strength filters, can be added.
-
Single Indicator Dependency: The strategy primarily relies on the relationship with the 5 EMA without using other technical indicators for confirmation. This may lead to decreased signal quality under certain market conditions. It is recommended to add auxiliary indicators such as RSI or MACD for signal confirmation.
-
Fixed Risk Amount Limitation: Although a fixed risk ($2) provides consistency, it may not be suitable for all account sizes. Larger accounts may need a larger risk amount, while smaller accounts may need a smaller risk amount. It is recommended to set the risk amount as a percentage of the total account.
Strategy Optimization Directions
-
Multi-Timeframe Analysis Integration: Signal quality can be significantly improved by adding higher timeframe trend confirmation. For example, executing short signals on a 15-minute chart only when the daily trend is downward can reduce the risk of counter-trend trading.
-
Adaptive Risk-Reward Ratio: Adjust the risk-reward ratio based on market volatility or support/resistance levels, rather than using a fixed 1:1 ratio. In strong downtrends, larger profit targets (such as 1:2 or 1:3) can be set.
-
Dynamic EMA Period: The current strategy uses a fixed 5-period EMA. Implementing an adaptive EMA period that automatically adjusts according to market volatility (e.g., using a shorter EMA in low volatility environments and a longer EMA in high volatility environments) may improve strategy adaptability.
-
Adding Volume Confirmation: Volume is a key indicator for confirming the validity of price action. Requiring above-average volume when breaking below the Alert Candle's low can reduce false breakout trades.
-
Integrating Market Environment Filters: Add market environment classification logic (such as trend, sideways, high volatility, low volatility) and adjust strategy parameters based on different environments or even completely avoid trading in unfavorable environments.
-
Stop Loss Optimization: Consider using smarter stop loss placement methods, such as ATR (Average True Range) based stops or the highest point of the last N candles, which may be more effective than using the Alert Candle's high.
Summary
The Exponential Moving Average Breakout Reversal Trading System is a well-designed quantitative trading strategy, particularly suitable for short-term traders to capture market reversal points and short-term downtrends. Its core advantages lie in combining clear technical indicators (5 EMA), precise entry conditions (Alert Candle and breakout), and systematic capital management (dynamic position sizing).
The strategy's risk management framework provides a disciplined trading approach by fixing the risk amount for each trade and dynamically adjusting positions based on actual market volatility. The strategy's visual assistance system also enhances execution convenience and clarity.
However, to improve the strategy's robustness and adaptability, it is recommended to consider integrating multi-timeframe analysis, adding auxiliary confirmation indicators, optimizing risk-reward settings, and adding market environment filters. These optimizations can reduce false signals, improve the proportion of profitable trades, and maintain good performance under different market conditions.
Overall, this is a clearly structured and logically rigorous trading system, suitable both for experienced traders as a primary strategy and for novice traders to learn the basic principles of quantitative trading. Through continuous backtesting and optimization, this strategy has the potential to become a reliable trading tool, bringing stable returns to the portfolio.[/trans]
Source (PineScript)
/*backtest
start: 2024-03-03 00:00:00
end: 2025-03-01 08:00:00
period: 1d
basePeriod: 1d
exchanges: [{"eid":"Futures_Binance","currency":"ETH_USDT"}]
*/

//@version=5
strategy("EMA 5 Alert Candle Short", overlay=true)

// Define EMA
emaLength = 5
emaValue = ta.ema(close, emaLength)

// Risk Management Parameters
capital = 1000
riskPerTrade = 2  // Fixed risk per trade in dollars

// Check if previous candles touched EMA, but the current candle is far above EMA
candleTouchesEMA = low <= emaValue
alertCandle = not candleTouchesEMA[0] and candleTouchesEMA[1] and candleTouchesEMA[2] and candleTouchesEMA[3]

// Persistent Variables to Store Alert Levels
varip float validAlertLow = na
varip float validAlertHigh = na
varip bool isAlertActive = false
varip float positionSize = na
varip float capitalUsed = na

// When an alert candle is identified, store its high and low
if alertCandle
    validAlertLow := low
    validAlertHigh := high
    isAlertActive := true

// Calculate Position Sizing
if isAlertActive
    alertCandleRange = validAlertHigh - validAlertLow
    positionSize := riskPerTrade / alertCandleRange  // Shares or contracts
    capitalUsed := positionSize * validAlertLow      // Capital used in dollars

// Check if the next candle breaks the alert candle low (entry condition)
shortTrigger = isAlertActive and low < validAlertLow
if shortTrigger
    shortEntry = validAlertLow
    stopLoss = validAlertHigh
    target = shortEntry - (stopLoss - shortEntry)
    isAlertActive := false  // Disable alert after trade execution

    // Execute trade
    strategy.entry("Short", strategy.short, qty=positionSize, stop=shortEntry)
    strategy.exit("Take Profit", from_entry="Short", limit=target, stop=stopLoss)

// Reset alert candle if next candle does not break low but also does not touch 5EMA
if not shortTrigger and not candleTouchesEMA[0]
    validAlertLow := low
    validAlertHigh := high
    isAlertActive := true

// Plot EMA
plot(emaValue, title="EMA 5", color=color.blue, linewidth=2)

// Mark alert candle
plotshape(alertCandle, location=location.abovebar, color=color.red, style=shape.labeldown, title="Alert Candle")
Detail
https://www.fmz.com/strategy/484574
Last Modified
2025-03-03 09:44:20