
7.0 KiB
Name
抛物线SAR指标背离交易策略-Parabolic-SAR-Divergence-Trading-Strategy
Author
ChaoZhang
Strategy Description
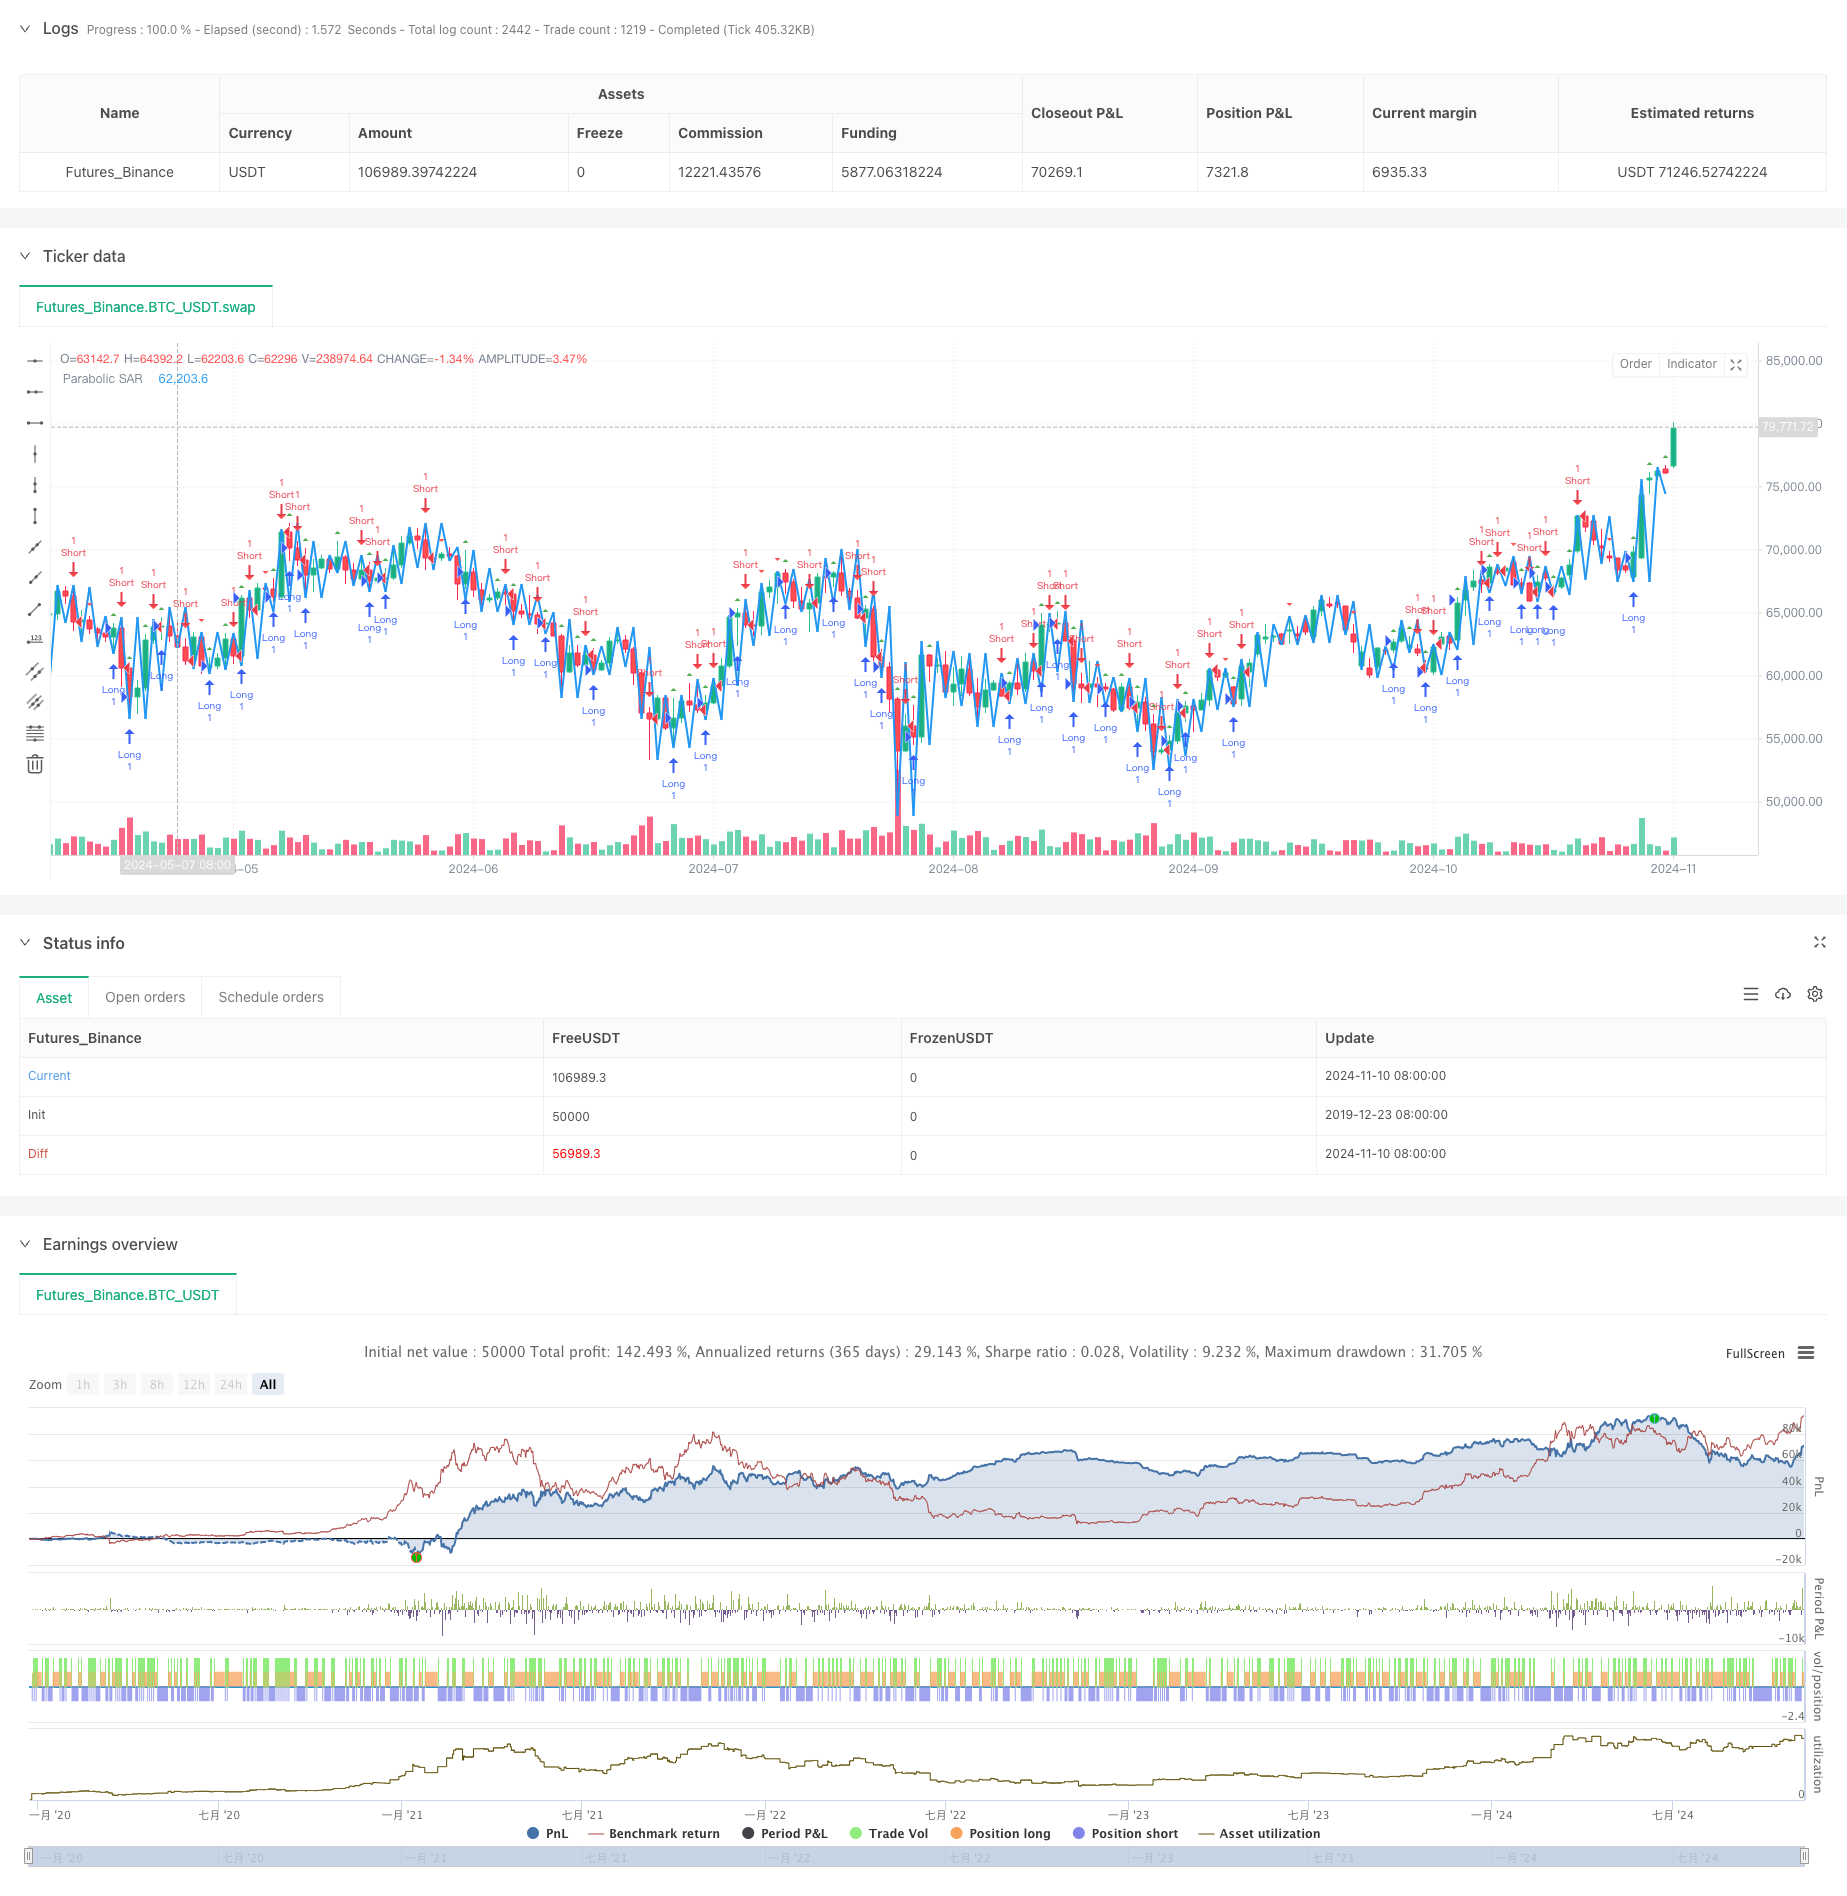
[trans]
概述
该策略是一个基于抛物线SAR指标与价格之间背离关系的交易系统。通过监测SAR指标与价格走势之间的背离现象来识别潜在的趋势反转点,从而捕捉市场转折机会。策略采用了经典的抛物线SAR指标作为核心技术指标,结合背离分析方法,构建了一个完整的趋势跟踪交易系统。
策略原理
策略的核心逻辑包含以下几个关键要素:
- 使用抛物线SAR指标跟踪价格趋势,该指标具有动态调整加速因子的特点
- 通过设定回溯期(lookback)来检测价格与SAR指标之间的背离
- 当出现看涨背离时(价格创新低而SAR未创新低),触发做多信号
- 当出现看跌背离时(价格创新高而SAR未创新高),触发做空信号
- 系统通过shape.triangleup和shape.triangledown在图表上标注交易信号
- 集成了警报功能,可在出现交易信号时及时通知交易者
策略优势
- 指标选择科学
- 抛物线SAR是一个经过市场检验的成熟指标
- 指标参数可根据不同市场特征灵活调整
- 信号机制可靠
- 背离信号具有较强的趋势预测能力
- 结合价格走势和指标走势,降低假信号
- 系统设计完整
- 包含完整的信号生成、执行和监控机制
- 集成图形界面和警报功能,便于操作
策略风险
- 参数敏感性
- SAR参数设置不当可能导致过度交易
- 背离检测周期选择会影响信号质量
- 市场适应性
- 在剧烈波动市场可能产生虚假信号
- 横盘市场中可能频繁出现无效信号
- 风险控制不足
- 缺乏止损机制
- 没有仓位管理系统
策略优化方向
- 增强信号过滤
- 加入趋势过滤器,仅在主趋势方向交易
- 结合成交量指标验证信号有效性
- 完善风险控制
- 添加动态止损机制
- 设计仓位管理系统
- 优化参数调整
- 开发自适应参数系统
- 根据不同市场条件动态调整参数
总结
这是一个基于经典技术指标的趋势跟踪策略,通过背离分析方法捕捉市场转折点。策略设计思路清晰,实现方法简洁,具有良好的可操作性。但在实际应用中仍需要根据具体市场特征进行优化,特别是在风险控制方面需要进一步完善。通过增加过滤机制、完善风险控制系统,该策略有望获得更稳定的交易表现。
||
Overview
This strategy is a trading system based on divergence relationships between the Parabolic SAR indicator and price movement. By monitoring divergence phenomena between SAR indicator and price trends, it identifies potential trend reversal points to capture market turning opportunities. The strategy employs the classic Parabolic SAR indicator as its core technical indicator, combined with divergence analysis methods to construct a complete trend-following trading system.
Strategy Principles
The core logic includes several key elements:
- Uses Parabolic SAR indicator to track price trends, featuring dynamic adjustment of acceleration factors
- Detects divergence between price and SAR indicator through a set lookback period
- Triggers long signals when bullish divergence occurs (price makes new lows while SAR doesn't)
- Triggers short signals when bearish divergence occurs (price makes new highs while SAR doesn't)
- Marks trading signals on charts using shape.triangleup and shape.triangledown
- Integrates alert functionality to notify traders of trading signals promptly
Strategy Advantages
- Scientific Indicator Selection
- Parabolic SAR is a market-tested mature indicator
- Indicator parameters can be flexibly adjusted for different market characteristics
- Reliable Signal Mechanism
- Divergence signals have strong trend prediction capability
- Combines price and indicator trends to reduce false signals
- Complete System Design
- Includes comprehensive signal generation, execution, and monitoring mechanisms
- Integrates graphical interface and alert functions for easy operation
Strategy Risks
- Parameter Sensitivity
- Improper SAR parameter settings may lead to overtrading
- Divergence detection period selection affects signal quality
- Market Adaptability
- May generate false signals in volatile markets
- Frequent invalid signals may occur in ranging markets
- Insufficient Risk Control
- Lacks stop-loss mechanism
- No position management system
Strategy Optimization Directions
- Enhanced Signal Filtering
- Add trend filters to trade only in main trend direction
- Incorporate volume indicators to verify signal validity
- Improved Risk Control
- Add dynamic stop-loss mechanism
- Design position management system
- Optimized Parameter Adjustment
- Develop adaptive parameter system
- Dynamically adjust parameters based on market conditions
Summary
This is a trend-following strategy based on classic technical indicators, capturing market turning points through divergence analysis. The strategy design is clear, implementation methods are concise, and it has good operability. However, in practical application, it still needs optimization according to specific market characteristics, especially in risk control aspects. Through adding filtering mechanisms and improving the risk control system, this strategy has the potential to achieve more stable trading performance.[/trans]
Source (PineScript)
/*backtest
start: 2019-12-23 08:00:00
end: 2024-11-11 00:00:00
period: 1d
basePeriod: 1d
exchanges: [{"eid":"Futures_Binance","currency":"BTC_USDT"}]
*/

//@version=5
strategy("SAR Divergence Strategy", overlay=true)

// --- Inputs ---
length = input.int(14, title="SAR Length", minval=1)
accelerationFactor = input.float(0.02, title="Acceleration Factor", minval=0.01)
maximumFactor = input.float(0.2, title="Maximum Factor", minval=0.01)

// --- SAR Calculation ---
sar = ta.sar(length, accelerationFactor, maximumFactor)

// --- Divergence Detection ---
lookback = 5

// Bullish Divergence
bullCond = close[lookback] < close[lookback + 1] and sar[lookback] > sar[lookback + 1]

// Bearish Divergence
bearCond = close[lookback] > close[lookback + 1] and sar[lookback] < sar[lookback + 1]

// --- Strategy Logic ---
if (bullCond)
    strategy.entry("Long", strategy.long)

if (bearCond)
    strategy.entry("Short", strategy.short)

// --- Plotting ---
plot(sar, color=color.blue, linewidth=2, title="Parabolic SAR")

plotshape(bullCond, style=shape.triangleup, color=color.green, size=size.small, title="Bullish Divergence")
plotshape(bearCond, style=shape.triangledown, color=color.red, size=size.small, title="Bearish Divergence")

// --- Alerts ---
alertcondition(bullCond, title="Bullish SAR Divergence", message="Bullish Divergence detected")
alertcondition(bearCond, title="Bearish SAR Divergence", message="Bearish Divergence detected")
Detail
https://www.fmz.com/strategy/471696
Last Modified
2024-11-12 15:12:33