
17 KiB
Name
抛物线停损反转与布林带趋势识别量化交易策略-Parabolic-SAR-and-Bollinger-Bands-Trend-Identification-Quantitative-Trading-Strategy
Author
ianzeng123
Strategy Description
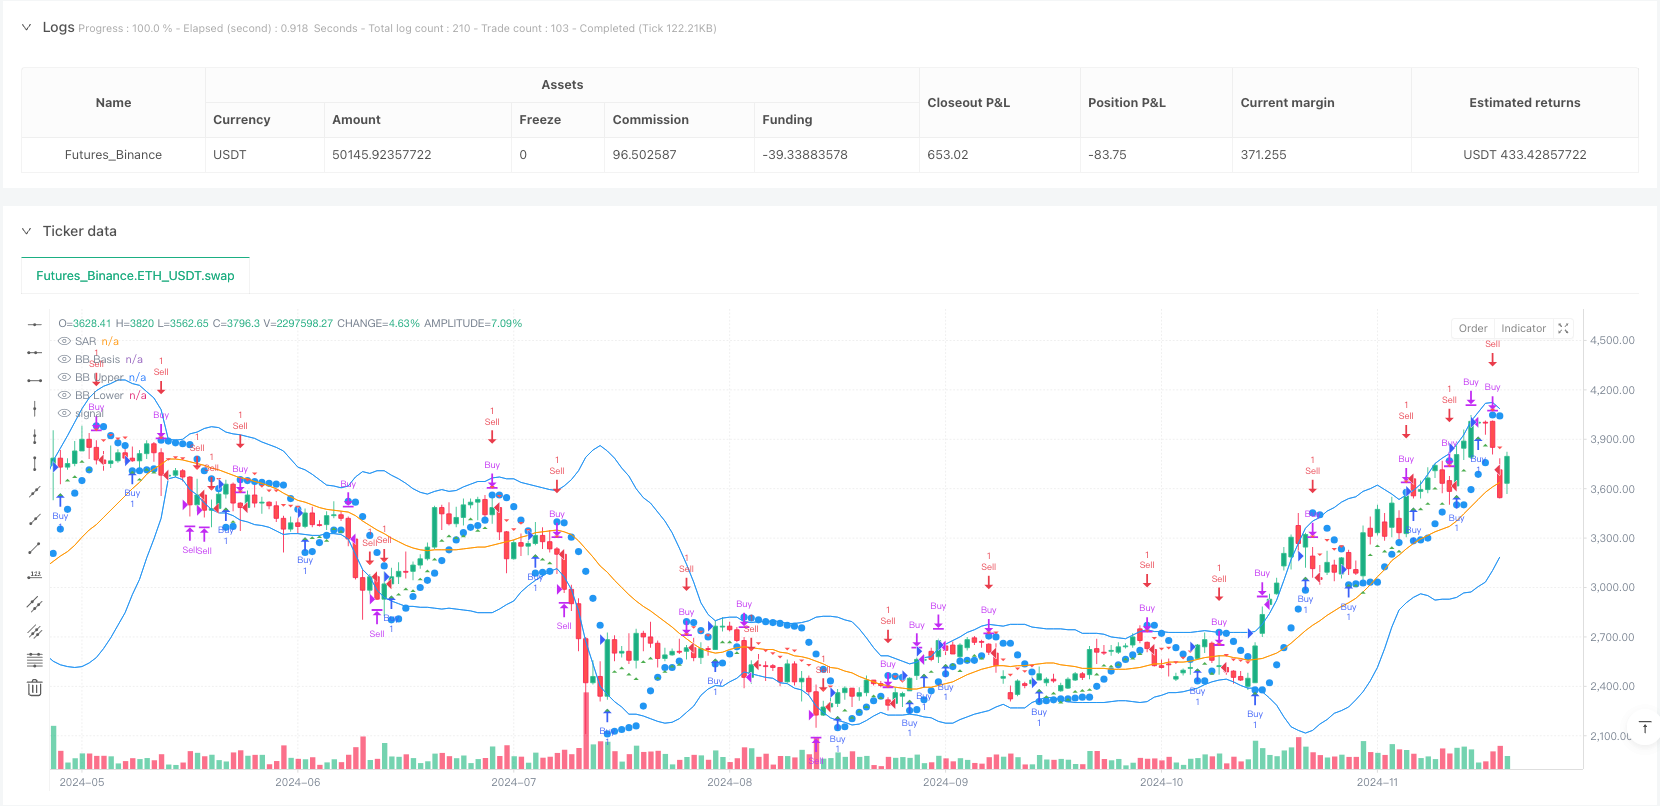
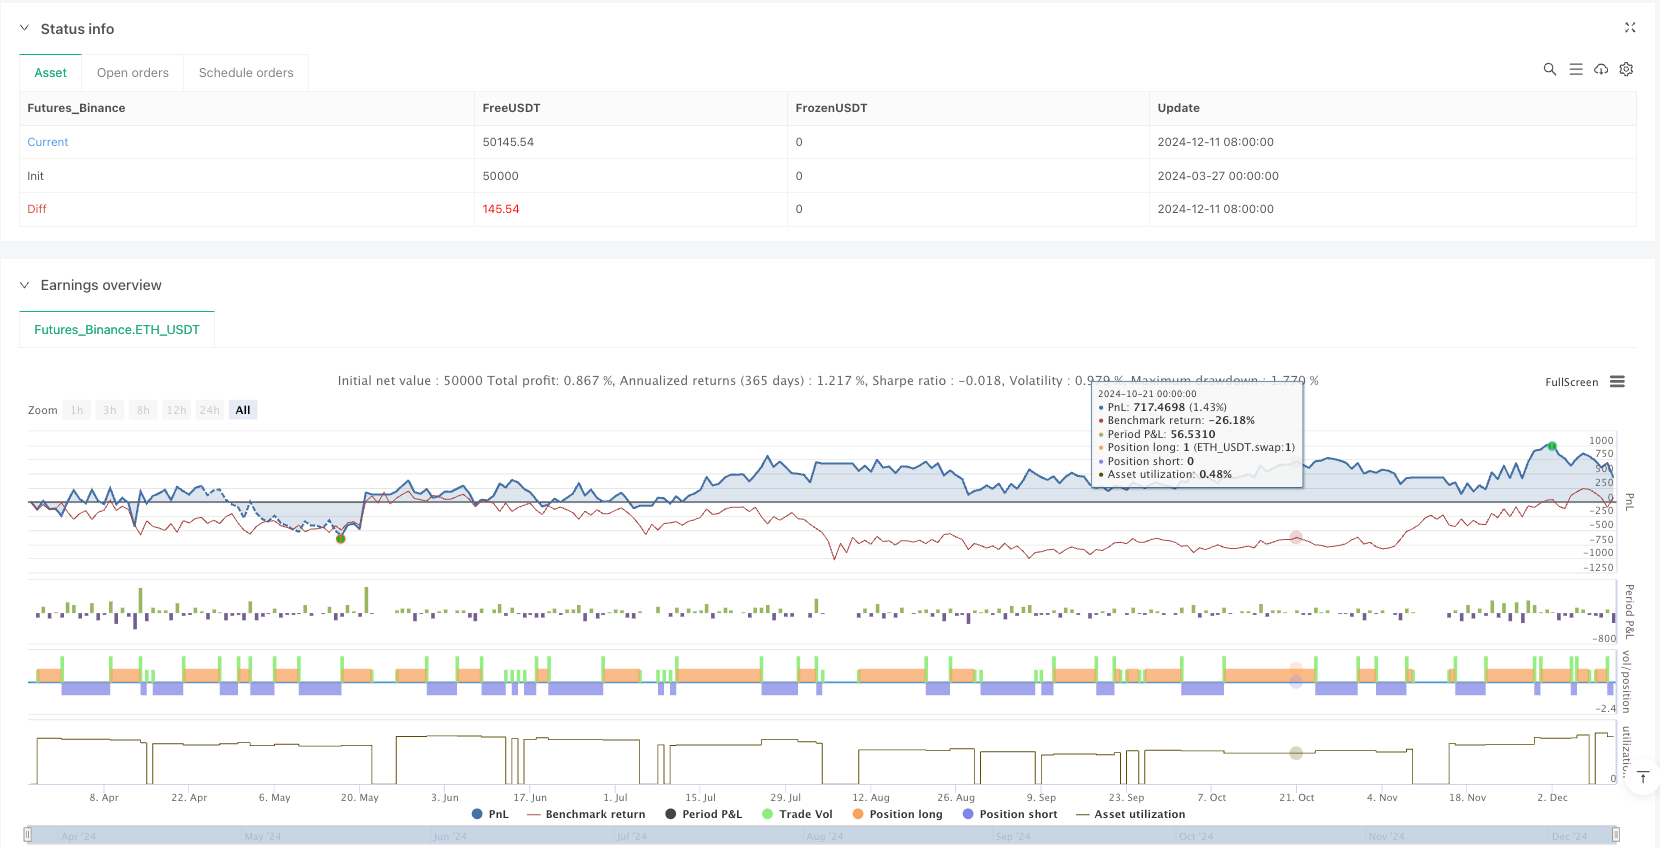
[trans]
概述
抛物线停损反转与布林带趋势识别量化交易策略是一种结合抛物线SAR指标和布林带指标的量化交易策略。该策略通过抛物线SAR识别市场趋势方向,利用布林带判断价格的波动范围,当价格符合特定条件时进行买入或卖出操作。策略核心思想是在确认趋势的情况下,避免在价格极端位置入场,从而降低风险同时提高交易成功率。
策略原理
该策略基于两个核心技术指标的协同作用:
-
抛物线SAR(停损和反转): 这是一个趋势跟踪指标,它在价格图表上以点的形式呈现,通常用于识别潜在的价格反转点和设置止损位置。当价格位于SAR点之上时,表明市场处于上升趋势;当价格位于SAR点之下时,表明市场处于下降趋势。
-
布林带: 这是一种衡量价格波动性的指标,由三条线组成:中轨(通常是20周期移动平均线)、上轨(中轨加上两倍标准差)和下轨(中轨减去两倍标准差)。布林带帮助识别价格是否处于超买或超卖区域。
策略的交易逻辑如下:
- 买入条件: 当收盘价高于SAR点(表明上升趋势)并且低于布林带上轨(避免在超买区域买入)时,系统生成买入信号。
- 卖出条件: 当收盘价低于SAR点(表明下降趋势)并且高于布林带下轨(避免在超卖区域卖出)时,系统生成卖出信号。
- 平仓条件:
- 多头平仓:当收盘价低于SAR点(趋势反转)或收盘价高于或等于布林带上轨(达到超买区域)时。
- 空头平仓:当收盘价高于SAR点(趋势反转)或收盘价低于或等于布林带下轨(达到超卖区域)时。
这种组合利用了趋势确认和波动范围判断的双重优势,有效规避了单一指标可能带来的虚假信号。
策略优势
-
趋势确认与波动防护相结合: 通过抛物线SAR确认趋势方向,同时利用布林带避免在价格极端位置入场,这种双重过滤机制可以有效减少虚假信号,提高交易质量。
-
自适应性强: 抛物线SAR指标的步长和最大值参数可调整,使策略能够适应不同市场环境;布林带的周期和倍数也可根据市场波动特性进行定制。
-
视觉清晰: 策略提供了清晰的视觉信号,通过在图表上绘制指标线和交易信号图形,使交易者能够直观理解交易逻辑和入场点位。
-
风险管理内置: 策略的平仓规则内置了风险管理机制,当趋势反转或价格达到极端位置时自动平仓,这有助于控制单笔交易的亏损范围。
-
适用多种时间周期和市场: 该策略的设计原理使其可以应用于不同的时间周期和市场类型,特别适合具有明显趋势特性的市场。
策略风险
-
震荡市场表现不佳: 在价格横盘震荡、没有明显趋势的市场环境下,该策略可能会产生频繁且错误的信号,导致多次小额亏损。解决方法是增加一个趋势强度过滤器,例如ADX指标,只在趋势强度足够时才激活策略。
-
参数敏感性: 策略性能对SAR步长、SAR最大值、布林带周期和倍数等参数高度敏感。不当的参数设置可能导致过早入场或过晚出场。建议通过历史回测找到适合特定市场的最优参数组合。
-
滞后性问题: 由于SAR和布林带都是基于历史数据计算的指标,它们在快速变化的市场中可能会表现出一定的滞后性,错过最佳入场点或延迟出场。可以考虑减小指标周期以降低滞后性,但这也可能增加虚假信号。
-
缺乏交易量确认: 现有策略没有考虑交易量因素,而交易量往往是确认价格趋势可靠性的重要指标。建议增加交易量过滤条件,例如要求趋势改变时伴随交易量增加。
-
止损设置不足: 虽然策略有内置的平仓条件,但没有设置固定的止损位置,在极端市场条件下可能导致较大亏损。建议增加基于百分比或ATR的硬性止损设置。
策略优化方向
-
增加趋势过滤器: 引入ADX(平均方向指数)或类似指标,只在ADX高于特定阈值(如25)时才执行交易,以避免在无趋势市场中产生虚假信号。这样优化可以显著减少震荡市场中的亏损交易。
-
优化入场时机: 考虑在当前入场条件的基础上,增加RSI或随机指标等辅助确认,例如在上升趋势中当RSI从超卖区域回升时才买入,以获得更好的入场价格。
-
加入交易量确认: 要求入场信号伴随交易量增加,可以使用交易量加权移动平均线(VWMA)替代简单移动平均线(SMA)来计算布林带,或者单独检查交易量是否高于其移动平均线。
-
动态止损策略: 实现追踪止损功能,例如在有利润的交易中将止损点逐渐移动到SAR点位置,以保护已获利润同时允许趋势继续发展。
-
考虑时间过滤: 某些市场在特定的时间段波动性和流动性更好,策略可以增加时间过滤器,只在最有利的交易时段执行交易信号。
-
增加头寸管理: 基于市场波动性(如ATR)或账户风险百分比动态调整头寸大小,在低波动期间增加头寸,在高波动期间减少头寸,以实现更均衡的风险回报比。
-
添加多周期确认: 使用多时间周期分析,要求较大时间周期和较小时间周期的信号方向一致,这可以减少虚假突破信号。
总结
抛物线停损反转与布林带趋势识别量化交易策略巧妙地结合了趋势跟踪和波动范围判断两种交易理念,通过抛物线SAR识别市场趋势方向,布林带控制入场区域,有效避免了在趋势反向或价格极端位置入场的风险。该策略具有视觉直观、参数可调、内置风险管理等优点,但在震荡市场中表现可能不佳,且对参数设置较为敏感。
通过引入趋势强度过滤、交易量确认、动态止损和多周期分析等优化措施,策略的稳定性和盈利能力有望进一步提升。特别是增加ADX等趋势强度指标和优化头寸管理,可能对策略性能产生显著改善。
这一策略适合有一定交易经验的量化交易者,他们可以根据自己交易的特定市场特性,调整参数并加入个性化的优化措施,从而构建一个更加稳健的交易系统。最终,与所有交易策略一样,严格的资金管理和情绪控制是成功应用该策略的关键因素。 ||
Overview
The Parabolic SAR and Bollinger Bands Trend Identification Quantitative Trading Strategy is a quantitative trading approach that combines the Parabolic SAR indicator with Bollinger Bands. This strategy identifies market trend direction using Parabolic SAR while utilizing Bollinger Bands to determine price volatility ranges. When prices meet specific conditions, buy or sell signals are generated. The core concept is to confirm trends before entering positions while avoiding extreme price levels, thereby reducing risk and improving trade success rates.
Strategy Principles
This strategy is based on the synergistic effect of two core technical indicators:
-
Parabolic SAR (Stop and Reverse): This trend-following indicator appears as dots on a price chart, typically used to identify potential price reversal points and set stop-loss positions. When the price is above the SAR dots, it indicates an uptrend; when price is below the SAR dots, it indicates a downtrend.
-
Bollinger Bands: This volatility indicator consists of three lines: the middle band (typically a 20-period moving average), the upper band (middle band plus two standard deviations), and the lower band (middle band minus two standard deviations). Bollinger Bands help identify whether prices are in overbought or oversold territories.
The trading logic works as follows:
- Buy Condition: When the closing price is above the SAR point (indicating an uptrend) AND below the upper Bollinger Band (avoiding buying in overbought areas), the system generates a buy signal.
- Sell Condition: When the closing price is below the SAR point (indicating a downtrend) AND above the lower Bollinger Band (avoiding selling in oversold areas), the system generates a sell signal.
- Exit Conditions:
- Long exit: When the closing price falls below the SAR point (trend reversal) or reaches/exceeds the upper Bollinger Band (reaching overbought territory).
- Short exit: When the closing price rises above the SAR point (trend reversal) or reaches/falls below the lower Bollinger Band (reaching oversold territory).
This combination leverages the dual advantages of trend confirmation and volatility range assessment, effectively avoiding false signals that might arise from using a single indicator.
Strategy Advantages
-
Combination of Trend Confirmation and Volatility Protection: By confirming trends with Parabolic SAR while using Bollinger Bands to avoid entering at extreme price levels, this dual-filtering mechanism effectively reduces false signals and improves trade quality.
-
Strong Adaptability: The Parabolic SAR's step and maximum parameters can be adjusted to adapt to different market environments; similarly, the Bollinger Bands' period and multiplier can be customized based on market volatility characteristics.
-
Visual Clarity: The strategy provides clear visual signals by plotting indicator lines and trade signal shapes on the chart, allowing traders to intuitively understand trading logic and entry points.
-
Built-in Risk Management: The strategy's exit rules incorporate risk management mechanisms, automatically closing positions when trends reverse or prices reach extreme levels, helping to control the range of losses in individual trades.
-
Applicable to Multiple Timeframes and Markets: The design principles of this strategy make it applicable to different timeframes and market types, particularly suitable for markets with distinct trend characteristics.
Strategy Risks
-
Poor Performance in Ranging Markets: In sideways or choppy markets with no clear trends, this strategy may generate frequent and incorrect signals, resulting in multiple small losses. A solution is to add a trend strength filter, such as the ADX indicator, activating the strategy only when trend strength is sufficient.
-
Parameter Sensitivity: Strategy performance is highly sensitive to parameters such as SAR step, SAR maximum, Bollinger Band period, and multiplier. Improper parameter settings may lead to premature entries or delayed exits. It is recommended to find optimal parameter combinations for specific markets through historical backtesting.
-
Lag Issues: Since both SAR and Bollinger Bands are indicators calculated based on historical data, they may exhibit certain lag in rapidly changing markets, missing optimal entry points or delaying exits. Consider reducing indicator periods to decrease lag, though this may increase false signals.
-
Lack of Volume Confirmation: The current strategy does not consider volume factors, which are often important indicators for confirming price trend reliability. Adding volume filter conditions is recommended, such as requiring increased volume when trends change.
-
Insufficient Stop Loss Settings: Although the strategy has built-in exit conditions, it lacks fixed stop-loss positions, which may lead to significant losses under extreme market conditions. Consider adding hard stop-loss settings based on percentages or ATR.
Strategy Optimization Directions
-
Add Trend Filters: Introduce ADX (Average Directional Index) or similar indicators, executing trades only when ADX is above a specific threshold (e.g., 25) to avoid false signals in trendless markets. This optimization can significantly reduce losing trades in ranging markets.
-
Optimize Entry Timing: Consider adding RSI or stochastic indicators as auxiliary confirmation on top of current entry conditions, for example, buying only when RSI rebounds from oversold territory in uptrends, to get better entry prices.
-
Add Volume Confirmation: Require entry signals to be accompanied by increased volume; consider using Volume Weighted Moving Average (VWMA) instead of Simple Moving Average (SMA) to calculate Bollinger Bands, or separately check if volume is above its moving average.
-
Dynamic Stop Loss Strategy: Implement trailing stop functionality, for example, gradually moving stop loss points to SAR positions in profitable trades to protect profits while allowing trends to continue developing.
-
Consider Time Filters: Some markets have better volatility and liquidity during specific time periods; the strategy could add time filters to execute trading signals only during the most favorable trading sessions.
-
Enhance Position Sizing: Dynamically adjust position sizes based on market volatility (such as ATR) or account risk percentage, increasing positions during low volatility periods and reducing them during high volatility periods to achieve a more balanced risk-reward ratio.
-
Add Multi-Timeframe Confirmation: Use multi-timeframe analysis, requiring signal directions to be consistent across larger and smaller timeframes, which can reduce false breakout signals.
Summary
The Parabolic SAR and Bollinger Bands Trend Identification Quantitative Trading Strategy cleverly combines trend following and volatility range assessment trading concepts. It identifies market trend direction through Parabolic SAR and controls entry zones with Bollinger Bands, effectively avoiding the risks of entering against trends or at extreme price levels. This strategy has advantages including visual intuitiveness, adjustable parameters, and built-in risk management, but it may not perform well in ranging markets and is sensitive to parameter settings.
By introducing trend strength filtering, volume confirmation, dynamic stop losses, and multi-timeframe analysis, the strategy's stability and profitability can be further enhanced. In particular, adding trend strength indicators like ADX and optimizing position management may significantly improve strategy performance.
This strategy is suitable for quantitative traders with some trading experience who can adjust parameters and add personalized optimization measures based on the specific characteristics of the markets they trade, thereby building a more robust trading system. Ultimately, as with all trading strategies, strict money management and emotional control are key factors in successfully applying this strategy.[/trans]
Source (PineScript)
/*backtest
start: 2024-03-27 00:00:00
end: 2024-12-12 00:00:00
period: 1d
basePeriod: 1d
exchanges: [{"eid":"Futures_Binance","currency":"ETH_USDT"}]
*/

//@version=5
strategy("Parabolic SAR + Bollinger Bands Strategy", overlay=true)

// ———— Inputs ———— //
// Parabolic SAR Inputs
sar_step = input.float(0.02, "SAR Step", minval=0.001, maxval=0.1)
sar_max = input.float(0.2, "SAR Max", minval=0.1, maxval=0.5)

// Bollinger Bands Inputs
bb_length = input.int(20, "BB Length")
bb_mult = input.float(2.0, "BB Multiplier")

// ———— Calculate Indicators ———— //
// Parabolic SAR
sar = ta.sar(sar_step, sar_max, sar_max)
plot(sar, "SAR", color=color.blue, style=plot.style_circles)

// Bollinger Bands
bb_basis = ta.sma(close, bb_length)
bb_dev = bb_mult * ta.stdev(close, bb_length)
bb_upper = bb_basis + bb_dev
bb_lower = bb_basis - bb_dev

// Plot Bollinger Bands
plot(bb_basis, "BB Basis", color=color.orange)
plot(bb_upper, "BB Upper", color=color.blue)
plot(bb_lower, "BB Lower", color=color.blue)

// ———— Strategy Logic ———— //
// Long Condition: Price closes above SAR (uptrend) AND below Upper BB
longCondition = close > sar and close < bb_upper

// Short Condition: Price closes below SAR (downtrend) AND above Lower BB
shortCondition = close < sar and close > bb_lower

// Exit Conditions
exitLong = close < sar or close >= bb_upper
exitShort = close > sar or close <= bb_lower

// ———— Execute Orders ———— //
if (longCondition)
    strategy.entry("Buy", strategy.long)
if (exitLong)
    strategy.close("Buy")

if (shortCondition)
    strategy.entry("Sell", strategy.short)
if (exitShort)
    strategy.close("Sell")

// ———— Visual Alerts ———— //
plotshape(longCondition, style=shape.triangleup, location=location.belowbar, color=color.green, size=size.small)
plotshape(shortCondition, style=shape.triangledown, location=location.abovebar, color=color.red, size=size.small)
Detail
https://www.fmz.com/strategy/488417
Last Modified
2025-03-27 14:20:59