
15 KiB
Name
技术指标策略-风险管理策略-自适应趋势跟踪策略Technical-Indicator-Strategy-Risk-Management-Strategy-Adaptive-Trend-Following-Strategy
Author
ChaoZhang
Strategy Description
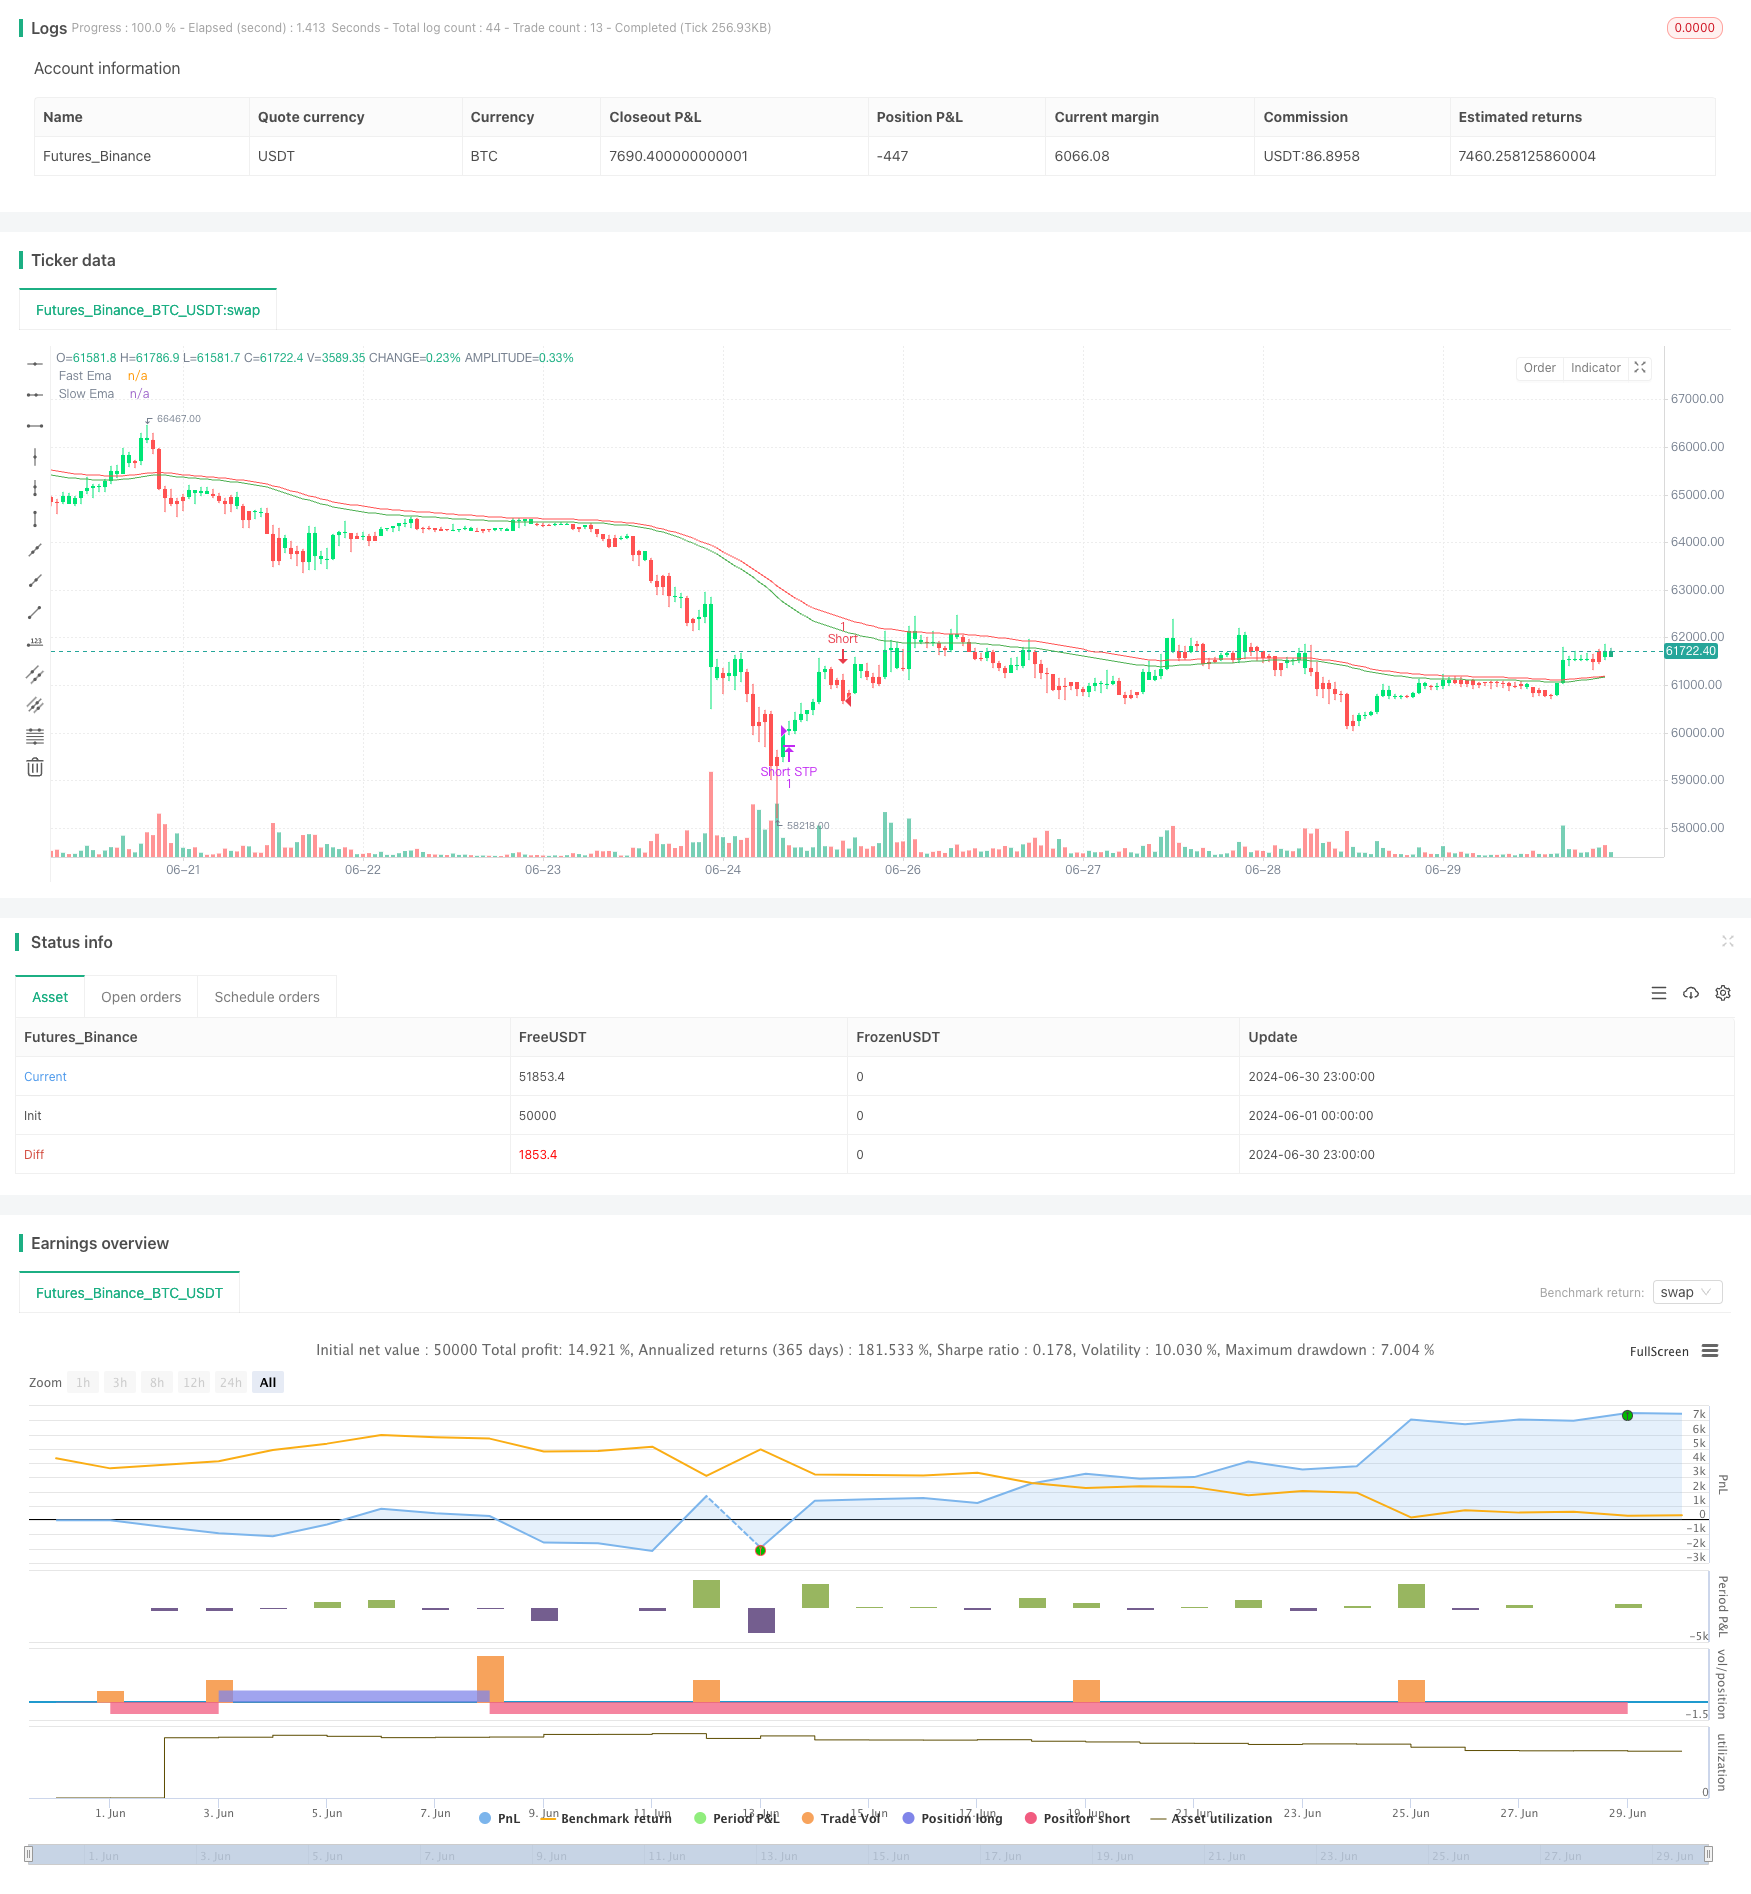
[trans]
概述
本策略是一种基于指数移动平均线(EMA)和平滑方向指标(SDI)的自适应趋势跟踪交易系统。它结合了多个技术指标和风险管理工具,旨在捕捉市场趋势并控制风险。该策略利用快速和慢速EMA的交叉以及SDI的方向来确定市场趋势,并据此生成买入和卖出信号。此外,该策略还包含了止盈、止损和追踪止损等风险管理功能,以保护盈利并限制损失。
该策略的核心在于其自适应性和全面的风险管理方法。通过使用可调整的参数,如EMA周期、SDI平滑度和风险管理阈值,交易者可以根据不同的市场条件和个人风险偏好来优化策略。杠杆和仓位大小的灵活设置进一步增强了策略的适应性,使其能够适用于不同的交易风格和资金规模。
策略原理
-
指标计算:
- 计算快速和慢速EMA,以及它们的平滑版本。
- 计算SDI,包括正向和负向方向指标。
-
交易信号生成:
- 多头条件:正向DI大于负向DI,且快速EMA大于慢速EMA。
- 空头条件:负向DI大于正向DI,且快速EMA小于慢速EMA。
-
仓位管理:
- 使用可调整的杠杆和股权百分比来确定交易规模。
- 在满足进场条件时,平掉反向仓位并开设新仓位。
-
风险管理:
- 实现可选的止盈、止损和追踪止损功能。
- 动态调整追踪止损水平,以锁定盈利。
-
时间过滤:
- 可设置交易的开始和结束日期,在指定时间范围外自动平仓。
策略优势
-
趋势捕捉能力:结合EMA和SDI,有效识别和跟踪市场趋势。
-
自适应性强:通过可调参数,适应不同市场条件。
-
全面的风险管理:集成止盈、止损和追踪止损,全方位控制风险。
-
灵活的仓位控制:可调整杠杆和资金使用比例,适应不同风险偏好。
-
回测友好:支持历史数据回测,便于策略优化。
-
情绪中立:基于客观指标,减少主观情绪影响。
-
多功能性:可用于不同时间周期和交易品种。
策略风险
-
过度交易:在震荡市场可能产生频繁交易,增加成本。
-
滞后性:EMA和SDI为滞后指标,可能在趋势反转时反应较慢。
-
假突破风险:可能在短期波动中误判趋势,导致错误交易。
-
参数敏感性:性能高度依赖于参数设置,需要持续优化。
-
市场环境依赖:在某些市场条件下可能表现不佳。
-
杠杆风险:高杠杆可能放大损失,需谨慎使用。
-
技术依赖:依赖于稳定的技术环境,系统故障可能造成损失。
策略优化方向
-
动态参数调整:实现EMA和SDI参数的自适应调整,以适应不同市场阶段。
-
多时间框架分析:整合多个时间周期的信号,提高趋势判断准确性。
-
波动性过滤:加入ATR等波动指标,在高波动期调整交易规则。
-
市场状态识别:引入市场状态分类(趋势/震荡),针对性优化交易逻辑。
-
资金管理优化:实现动态仓位调整,根据账户盈亏状况自动调整风险。
-
指标组合:考虑加入其他互补指标,如RSI或MACD,增强信号可靠性。
-
机器学习整合:引入机器学习算法,优化参数选择和信号生成。
总结
该EMA和SDI结合的自适应趋势跟踪策略展现了强大的市场适应性和风险管理能力。通过灵活的参数设置和全面的风险控制措施,它为交易者提供了一个可靠的量化交易框架。策略的核心优势在于其对趋势的敏感捕捉和对风险的严格管控,使其能够在不同市场环境下保持稳定表现。
然而,交易者仍需注意策略固有的滞后性和参数敏感性等潜在风险。通过持续的优化和改进,特别是在动态参数调整、多时间框架分析和市场状态识别等方面,该策略有望进一步提升其性能和稳定性。
总的来说,这个策略为量化交易提供了一个坚实的基础,适合那些寻求系统化、纪律化交易方法的投资者。通过深入理解策略原理并结合个人交易风格,交易者可以有效利用这一工具来增强其在金融市场中的竞争优势。
||
Overview
This strategy is an adaptive trend-following trading system based on Exponential Moving Averages (EMA) and Smoothed Directional Indicators (SDI). It combines multiple technical indicators and risk management tools to capture market trends and control risk. The strategy uses crossovers of fast and slow EMAs along with the direction of SDI to determine market trends and generate buy and sell signals. Additionally, the strategy incorporates risk management features such as take profit, stop loss, and trailing stops to protect profits and limit losses.
The core strength of this strategy lies in its adaptability and comprehensive risk management approach. Through the use of adjustable parameters such as EMA periods, SDI smoothing, and risk management thresholds, traders can optimize the strategy for different market conditions and personal risk preferences. The flexible setting of leverage and position size further enhances the strategy's adaptability, making it suitable for various trading styles and capital sizes.
Strategy Principles
-
Indicator Calculations:
- Calculate fast and slow EMAs, along with their smoothed versions.
- Compute SDI, including positive and negative directional indicators.
-
Trade Signal Generation:
- Long condition: Positive DI is greater than negative DI, and fast EMA is above slow EMA.
- Short condition: Negative DI is greater than positive DI, and fast EMA is below slow EMA.
-
Position Management:
- Use adjustable leverage and equity percentage to determine trade size.
- Close opposite positions and open new ones when entry conditions are met.
-
Risk Management:
- Implement optional take profit, stop loss, and trailing stop features.
- Dynamically adjust trailing stop levels to lock in profits.
-
Time Filtering:
- Set start and end dates for trading, automatically closing positions outside the specified time range.
Strategy Advantages
-
Trend Capturing Ability: Effectively identifies and follows market trends by combining EMA and SDI.
-
High Adaptability: Adapts to different market conditions through adjustable parameters.
-
Comprehensive Risk Management: Integrates take profit, stop loss, and trailing stops for all-round risk control.
-
Flexible Position Control: Adjustable leverage and capital usage ratio to suit different risk appetites.
-
Backtesting Friendly: Supports historical data backtesting for strategy optimization.
-
Emotion Neutral: Based on objective indicators, reducing the impact of subjective emotions.
-
Versatility: Can be applied to different timeframes and trading instruments.
Strategy Risks
-
Overtrading: May generate frequent trades in choppy markets, increasing costs.
-
Lagging Nature: EMA and SDI are lagging indicators, potentially slow to react to trend reversals.
-
False Breakout Risk: May misinterpret short-term fluctuations as trends, leading to incorrect trades.
-
Parameter Sensitivity: Performance highly dependent on parameter settings, requiring continuous optimization.
-
Market Environment Dependency: May underperform in certain market conditions.
-
Leverage Risk: High leverage can amplify losses, requiring cautious use.
-
Technology Dependence: Relies on stable technical environment, system failures may cause losses.
Strategy Optimization Directions
-
Dynamic Parameter Adjustment: Implement adaptive adjustment of EMA and SDI parameters to suit different market phases.
-
Multi-Timeframe Analysis: Integrate signals from multiple time periods to improve trend judgment accuracy.
-
Volatility Filtering: Incorporate volatility indicators like ATR to adjust trading rules during high volatility periods.
-
Market State Recognition: Introduce market state classification (trend/range) to optimize trading logic accordingly.
-
Capital Management Optimization: Implement dynamic position adjustment based on account profit and loss status.
-
Indicator Combination: Consider adding complementary indicators like RSI or MACD to enhance signal reliability.
-
Machine Learning Integration: Introduce machine learning algorithms to optimize parameter selection and signal generation.
Conclusion
This adaptive trend-following strategy combining EMA and SDI demonstrates powerful market adaptability and risk management capabilities. Through flexible parameter settings and comprehensive risk control measures, it provides traders with a reliable quantitative trading framework. The core advantages of the strategy lie in its sensitive trend capture and strict risk control, enabling it to maintain stable performance across different market environments.
However, traders still need to be aware of potential risks inherent in the strategy, such as lag and parameter sensitivity. Through continuous optimization and improvement, especially in areas like dynamic parameter adjustment, multi-timeframe analysis, and market state recognition, the strategy has the potential to further enhance its performance and stability.
Overall, this strategy provides a solid foundation for quantitative trading, suitable for investors seeking systematic and disciplined trading methods. By deeply understanding the strategy principles and combining them with personal trading styles, traders can effectively use this tool to enhance their competitive edge in the financial markets.
[/trans]
Source (PineScript)
/*backtest
start: 2024-06-01 00:00:00
end: 2024-06-30 23:59:59
period: 1h
basePeriod: 15m
exchanges: [{"eid":"Futures_Binance","currency":"BTC_USDT"}]
*/

// This source code is subject to the terms of the Mozilla Public License 2.0 at https://mozilla.org/MPL/2.0/
// © erdas0

//@version=5
strategy("Strategy SEMA SDI Webhook", overlay=true, slippage = 1, commission_value = 0.035, default_qty_type=strategy.percent_of_equity, default_qty_value=50, initial_capital = 1000, calc_on_order_fills = true, process_orders_on_close = true)
// Start and end dates
dts=input(false,"",inline="dts")
dte=input(false,"",inline="dte")
start_date = input(timestamp("2023-01-01 00:00:00"), "Start Date",inline="dts")
end_date = input(timestamp("2124-01-01"), "End Date",inline="dte")
times = true
// Initial capital
leverage= input.int(10, "Leverage", minval=1,inline="qty") //Leverage Test
usdprcnt= input.int(50, "%", minval=1,inline="qty")
qty= input(false,"Inital USDT ◨",inline="qty")
initial_capital = qty ? (strategy.initial_capital+strategy.netprofit)/close*leverage*usdprcnt/100 : na
//Level Inputs
tpon=input(false,"TP ◨",group ="Take Profit/Stop Loss", inline="1")
sloc=input(true,"SL ◨",group ="Take Profit/Stop Loss", inline="1")
tron=input(true,"Trailing ◨",group ="Take Profit/Stop Loss", inline="1")

tp = tpon ? input.float(25, "Take Profit %", minval=0.1,step=0.1,group ="Take Profit/Stop Loss", inline="2") : na
sl = sloc ? input.float(4.8, "Stop Loss %", minval=0.1,step=0.1,group ="Take Profit/Stop Loss", inline="2") : na
tr = tron ? input.float(1.9, "Trailing Stop ", minval=0.1,step=0.1,group ="Take Profit/Stop Loss", inline="4") : na

// Take profit and stop loss levels
dir=strategy.position_size/math.abs(strategy.position_size) //Directions
newtrade=strategy.closedtrades>strategy.closedtrades[1]
pftpcnt=dir<0 ? (strategy.position_avg_price-low)/strategy.position_avg_price*100 : dir>0 ? (high-strategy.position_avg_price)/strategy.position_avg_price*100 : na //max profit

pftpr= (1 + pftpcnt*dir/100) * strategy.position_avg_price //Trailing Price
take_profit = (1 + tp*dir/100) * strategy.position_avg_price
stop_loss = (1 - sl*dir/100) * strategy.position_avg_price

var float maxpft=na //max profit percent
maxpft := newtrade ? 0 : strategy.openprofit > 0 ?  math.max(pftpcnt,maxpft) : maxpft
var float Tr=na //Trailing
Tr := newtrade ? na : pftpcnt >= tr and maxpft-pftpcnt >= tr ?  close : Tr

//Inputs
ocema=input(true, title='EMA ◨',group="Inputs",inline="2")
ocsd=input(true, title='SDI ◨',group="Inputs",inline="2")
ocsm=input(true, title='Smooth ◨',group="Inputs",inline="2")
lenf = input.int(58, "Fast Ema", minval=1,group ="Inputs", inline="3")
lens = input.int(70, "Slow Ema", minval=1,group ="Inputs", inline="3")
slen = input.int(3, "Smooth", minval=1,group ="Inputs", inline="4")
dilen = input.int(1, title="DI Length", minval=1,group ="SDI", inline="5")
sdi = input.int(6, title="DI Smooth", minval=1,group ="SDI", inline="5")

//EMA
emaf=ta.ema(close,lenf)
emas=ta.ema(close,lens)
semaf=ta.ema(emaf,slen)
semas=ta.ema(emas,slen)
//SDI
dirmov(len,smt) =>
	up = ta.change(high)
	down = -ta.change(low)
	plusDM = na(up) ? na : (up > down and up > 0 ? up : 0)
	minusDM = na(down) ? na : (down > up and down > 0 ? down : 0)
	truerange = ta.rma(ta.tr, len)
	plus = ta.ema(fixnan(100 * ta.rma(plusDM, len) / truerange),smt)
	minus = ta.ema(fixnan(100 * ta.rma(minusDM, len) / truerange),smt)
	[plus, minus]
[plus,minus]=dirmov(dilen,sdi)
pm=ta.ema(plus-minus,10)
sdcl= plus>minus ? color.new(color.green,80) :plus<minus ? color.new(color.red,80) : na
cpm= pm>pm[1] ? color.lime : pm<pm[1] ? color.red : color.yellow
barcolor(cpm,title="PM Color")

//Plot
plot(ocsm ? semaf:emaf,"Fast Ema",color=color.green)
plot(ocsm ? semas:semas,"Slow Ema",color=color.red)
// Conditions
Long = (ocsd ? plus>minus:true) and (ocema ? (ocsm ? semaf:emaf)>(ocsm ? semas:emas):true)
Short = (ocsd ? plus<minus:true) and (ocema ? (ocsm ? semaf:emaf)<(ocsm ? semas:emas):true)

// Strategy conditions
if Long and times
    strategy.close("Short","Close S")
    strategy.entry("Long", strategy.long, comment="L",qty = initial_capital)
if strategy.position_size>0
    strategy.exit("Long LTP", "Long", limit=take_profit, stop=stop_loss, comment="LSL",comment_profit = "LTP")
if Tr and strategy.position_size>0
    strategy.exit("Long LTP", "Long", limit=take_profit, stop=pftpr, comment="Tr",comment_profit = "LTP")

if Short and times
    strategy.close("Long","Close L")
    strategy.entry("Short", strategy.short, comment="S",qty = initial_capital)
if strategy.position_size<0
    strategy.exit("Short STP", "Short", limit=take_profit, stop=stop_loss, comment="SSL",comment_profit ="STP" )
if Tr and strategy.position_size<0
    strategy.exit("Short STP", "Short", limit=take_profit, stop=pftpr, comment="Tr",comment_profit = "STP")

if not times
    strategy.close_all()
Detail
https://www.fmz.com/strategy/458084
Last Modified
2024-07-29 17:25:26