
17 KiB
Name
技术图形确认型多周期动量策略-Technical-Chart-Pattern-Confirmation-Momentum-Strategy
Author
ianzeng123
Strategy Description
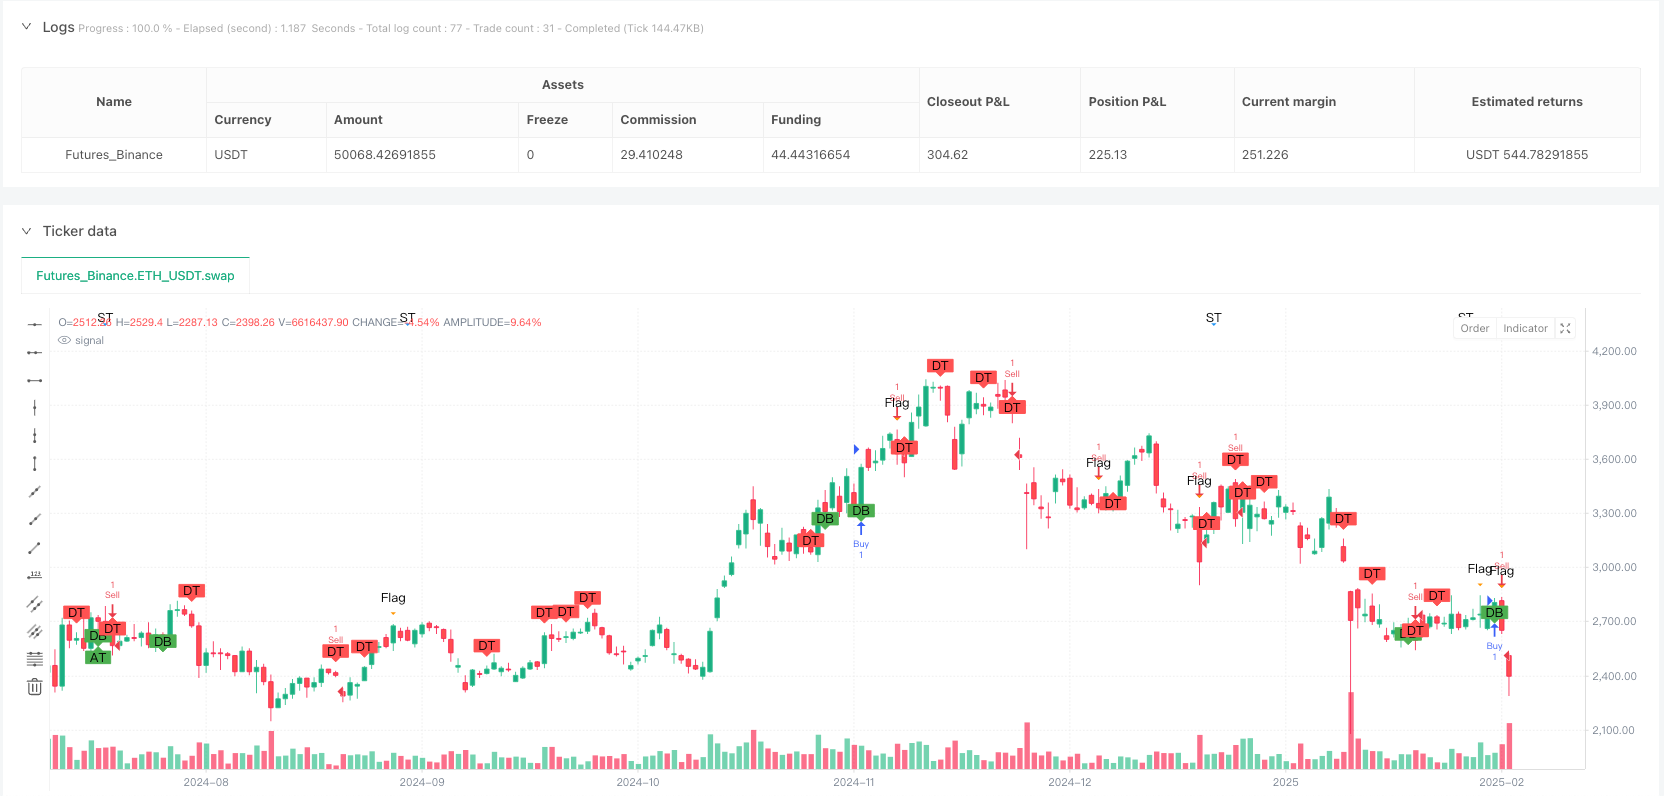
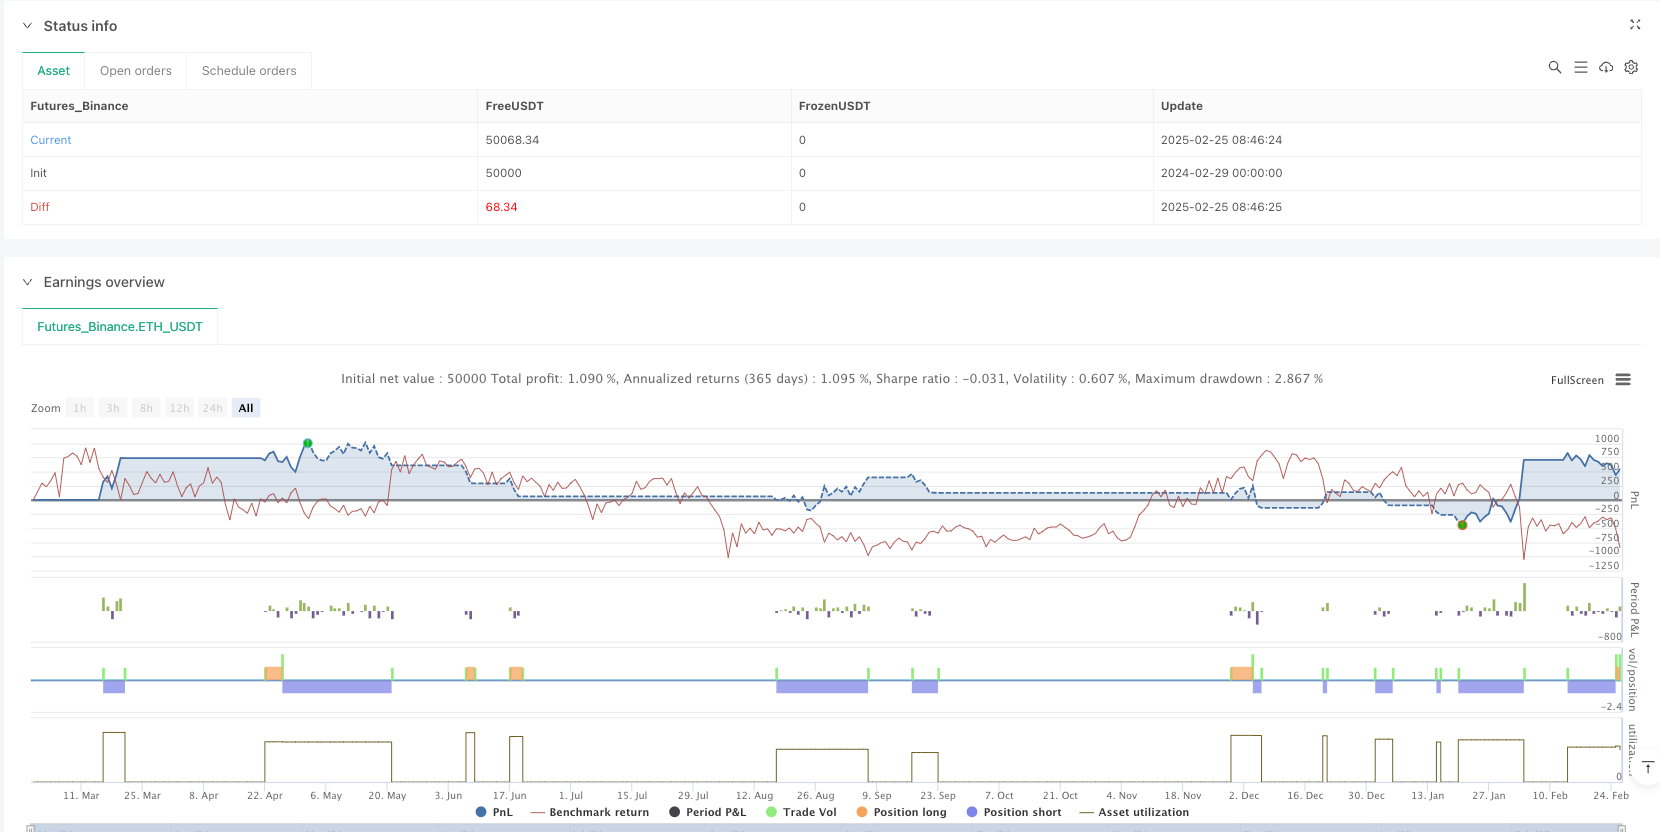
[trans]
概述
技术图形确认型多周期动量策略是一种基于多种经典图表形态识别并结合动量确认的交易系统。该策略主要通过识别市场中常见的技术形态,如头肩顶、头肩底、双顶、双底、三角形(对称、上升、下降)、旗形、楔形等,并在形态突破时确认入场信号。策略巧妙地结合了ATR指标来设置动态止损和止盈水平,有效控制风险并锁定利润。该策略不仅能够捕捉市场中各种转折点,还通过形态突破的确认机制提高了交易信号的可靠性,减少了假突破带来的风险。
策略原理
策略的核心原理是通过一系列条件函数识别不同的图表形态,并在价格突破关键水平时确认交易信号:
-
头肩顶/头肩底识别:通过比较连续高点/低点的相对位置关系,识别头肩形态的特征结构。当高点1大于高点0、2、3、4,且高点0小于高点2和3时,形成头肩形态。
-
双顶/双底识别:通过分析高点/低点序列来识别双顶和双底形态。双顶形态中,高点1需大于周围高点;双底形态中,低点1需小于周围低点。
-
三角形形态识别:
- 对称三角形:高点下降而低点上升,形成收敛形态
- 上升三角形:高点保持相对稳定而低点上升,形成看涨形态
- 下降三角形:高点下降而低点保持相对稳定,形成看跌形态
-
旗形/三角旗识别:通过分析高点和低点的连续变化模式来识别。
-
交易信号确认:
- 多头信号:当识别到头肩底、双底或上升三角形,且收盘价突破前一根K线高点时触发
- 空头信号:当识别到双顶、下降三角形或旗形形态,且收盘价跌破前一根K线低点时触发
-
风险管理:
- 使用14周期ATR计算动态止损和止盈水平
- 止损设置为1.5倍ATR
- 止盈设置为3倍ATR,风险回报比为1:2
策略优势
-
系统化的形态识别:策略通过定义明确的条件函数,实现了对多种经典图表形态的自动识别,降低了主观判断带来的偏差。
-
信号确认机制:策略不仅识别图表形态,还需要价格突破关键水平作为确认,减少了假突破带来的风险。
-
动态风险管理:使用ATR指标设置动态止损和止盈水平,使风险控制更适应市场波动性的变化。
-
多形态覆盖:策略包含了多种经典图表形态,增加了交易机会,适应不同市场环境。
-
可视化展示:策略通过plotshape函数在图表上直观显示识别到的各种形态,有助于交易者理解和验证策略逻辑。
-
风险回报比合理:策略设置3倍ATR作为止盈,1.5倍ATR作为止损,风险回报比为1:2,符合有效风险管理原则。
策略风险
-
形态识别精度有限:当前的形态识别算法相对简化,可能会产生误判或漏判,尤其是在市场噪音较大的情况下。
-
参数敏感性:ATR周期设置以及止损、止盈的倍数设置对策略表现有显著影响,需要根据不同市场和时间框架进行优化。
-
假突破风险:尽管有确认机制,但市场中仍然存在假突破现象,可能导致不必要的交易损失。
-
形态重复识别:当前代码中的某些形态识别函数逻辑相似(如头肩顶和双顶),可能导致同一市场情况下触发多个信号,增加交易频率和成本。
-
缺乏趋势过滤:策略没有考虑整体市场趋势方向,可能在强趋势中产生反向信号,导致逆势交易。
风险规避方法:
- 增加额外的过滤条件,如成交量确认、趋势指标过滤
- 优化形态识别算法,增加更多条件验证
- 实施更保守的仓位管理
- 考虑增加时间过滤,避免在重要新闻或事件前后交易
- 进行更广泛的回测,找到最优参数组合
策略优化方向
-
改进形态识别算法:
- 增加更多验证条件,如形态的大小、形成时间、价格变化幅度等
- 区分头肩顶和双顶等相似形态的识别标准
- 增加更复杂的形态,如杯柄形态、上升/下降楔形等
-
加入成交量确认:
- 在形态突破时,增加成交量放大的确认条件
- 分析形态形成过程中的成交量变化模式
-
趋势过滤:
- 加入趋势指标(如移动平均线、ADX等),只在趋势方向与形态信号一致时交易
- 考虑更长时间周期的市场结构
-
优化风险管理:
- 测试不同的ATR倍数设置
- 实现基于波动率的动态仓位管理
- 考虑分批止盈策略,锁定部分利润
-
增加时间过滤:
- 避免在低波动时段或重要新闻发布前后交易
- 考虑市场季节性因素
-
多时间框架分析:
- 在更高时间框架上确认趋势方向
- 在更低时间框架上优化入场点
这些优化方向会显著提高策略的稳健性和效率,原因是:
- 更精确的形态识别减少错误信号
- 成交量确认增加信号可靠性
- 趋势过滤避免逆势交易
- 优化风险管理提高资金效率和保护
- 多时间框架分析提供更全面的市场视角
总结
技术图形确认型多周期动量策略是一种系统化、规则明确的交易系统,通过识别多种经典图表形态并结合突破确认来生成交易信号。策略采用ATR指标进行动态风险管理,设定了合理的风险回报比。虽然当前版本的形态识别算法相对简化,但为进一步优化提供了良好基础。通过加入成交量确认、趋势过滤、优化风险管理和多时间框架分析等改进,该策略有潜力成为一个强大而稳健的交易系统。这种基于技术形态的策略特别适合波动性市场和价格行为明显的品种,可以帮助交易者系统地捕捉市场转折点和突破机会。 ||
Overview
The Technical Chart Pattern Confirmation Momentum Strategy is a trading system based on the recognition of multiple classic chart patterns combined with momentum confirmation. This strategy primarily identifies common market technical formations such as Head and Shoulders, Inverse Head and Shoulders, Double Tops, Double Bottoms, Triangles (Symmetrical, Ascending, Descending), Flags, Wedges, and others, generating signals when breakouts from these patterns occur. The strategy cleverly incorporates the ATR indicator to set dynamic stop-loss and take-profit levels, effectively controlling risk and securing profits. This approach not only captures various market turning points but also enhances signal reliability through pattern breakout confirmation mechanisms, reducing risks associated with false breakouts.
Strategy Principles
The core principle of the strategy is to identify different chart patterns through a series of condition functions and confirm trading signals when prices break through key levels:
-
Head and Shoulders/Inverse Head and Shoulders Detection: Identifies the characteristic structure of head and shoulders formations by comparing the relative positions of consecutive high/low points. A head and shoulders pattern forms when high point 1 is greater than high points 0, 2, 3, and 4, and high point 0 is less than high points 2 and 3.
-
Double Top/Double Bottom Detection: Analyzes sequences of highs/lows to identify double top and double bottom patterns. In a double top, high point 1 needs to be greater than surrounding highs; in a double bottom, low point 1 needs to be less than surrounding lows.
-
Triangle Pattern Detection:
- Symmetrical Triangle: Highs descend while lows ascend, forming a convergence pattern
- Ascending Triangle: Highs remain relatively stable while lows ascend, forming a bullish pattern
- Descending Triangle: Highs descend while lows remain relatively stable, forming a bearish pattern
-
Flag/Pennant Detection: Identifies these patterns by analyzing consecutive changes in high and low points.
-
Trade Signal Confirmation:
- Long Signal: Triggered when an Inverse Head and Shoulders, Double Bottom, or Ascending Triangle is identified, and the closing price breaks above the previous bar's high
- Short Signal: Triggered when a Double Top, Descending Triangle, or Flag pattern is identified, and the closing price breaks below the previous bar's low
-
Risk Management:
- Uses 14-period ATR to calculate dynamic stop-loss and take-profit levels
- Stop-loss is set at 1.5 times ATR
- Take-profit is set at 3 times ATR, providing a risk-reward ratio of 1:2
Strategy Advantages
-
Systematic Pattern Recognition: The strategy implements automatic identification of multiple classic chart patterns through clearly defined condition functions, reducing biases associated with subjective judgment.
-
Signal Confirmation Mechanism: The strategy not only identifies chart patterns but also requires price breakouts of key levels as confirmation, reducing risks from false breakouts.
-
Dynamic Risk Management: Uses the ATR indicator to set dynamic stop-loss and take-profit levels, adapting risk control to market volatility changes.
-
Multi-Pattern Coverage: The strategy includes various classic chart patterns, increasing trading opportunities and adapting to different market environments.
-
Visual Display: The strategy uses plotshape functions to visually display identified patterns on the chart, helping traders understand and verify strategy logic.
-
Reasonable Risk-Reward Ratio: The strategy sets take-profit at 3 times ATR and stop-loss at 1.5 times ATR, providing a risk-reward ratio of 1:2, consistent with effective risk management principles.
Strategy Risks
-
Limited Pattern Recognition Accuracy: The current pattern recognition algorithms are relatively simplified and may produce false identifications or miss valid patterns, especially in noisy market conditions.
-
Parameter Sensitivity: ATR period settings and the multiples used for stop-loss and take-profit significantly impact strategy performance and need optimization for different markets and timeframes.
-
False Breakout Risk: Despite confirmation mechanisms, false breakouts still occur in markets and may lead to unnecessary trading losses.
-
Pattern Redundancy: Some pattern recognition functions in the current code have similar logic (such as Head and Shoulders and Double Top), potentially triggering multiple signals in the same market situation, increasing trading frequency and costs.
-
Lack of Trend Filtering: The strategy doesn't consider overall market trend direction and may generate counter-trend signals in strong trends, leading to adverse trading.
Risk mitigation methods:
- Add additional filtering conditions, such as volume confirmation and trend indicator filtering
- Optimize pattern recognition algorithms with more validation conditions
- Implement more conservative position management
- Consider adding time filters to avoid trading before and after important news or events
- Conduct more extensive backtesting to find optimal parameter combinations
Strategy Optimization Directions
-
Improve Pattern Recognition Algorithms:
- Add more validation conditions, such as pattern size, formation time, price change magnitude
- Differentiate recognition criteria between similar patterns like Head and Shoulders and Double Tops
- Add more complex patterns like Cup and Handle, Rising/Falling Wedges
-
Add Volume Confirmation:
- Add volume expansion confirmation conditions during pattern breakouts
- Analyze volume change patterns during formation development
-
Trend Filtering:
- Add trend indicators (such as moving averages, ADX) to only trade when trend direction aligns with pattern signals
- Consider longer timeframe market structure
-
Optimize Risk Management:
- Test different ATR multiple settings
- Implement volatility-based dynamic position sizing
- Consider partial profit-taking strategies to secure profits
-
Add Time Filtering:
- Avoid trading during low volatility periods or before/after important news releases
- Consider market seasonality factors
-
Multi-Timeframe Analysis:
- Confirm trend direction on higher timeframes
- Optimize entry points on lower timeframes
These optimization directions would significantly improve the strategy's robustness and efficiency because:
- More precise pattern recognition reduces erroneous signals
- Volume confirmation increases signal reliability
- Trend filtering avoids counter-trend trading
- Optimized risk management improves capital efficiency and protection
- Multi-timeframe analysis provides a more comprehensive market perspective
Summary
The Technical Chart Pattern Confirmation Momentum Strategy is a systematic trading system with clear rules, generating trading signals by identifying multiple classic chart patterns combined with breakout confirmation. The strategy employs the ATR indicator for dynamic risk management with a reasonable risk-reward ratio. While the current version's pattern recognition algorithms are relatively simplified, they provide a good foundation for further optimization. By adding volume confirmation, trend filtering, risk management optimization, and multi-timeframe analysis, this strategy has the potential to become a powerful and robust trading system. This chart pattern-based approach is particularly suitable for volatile markets and instruments with distinctive price action, helping traders systematically capture market turning points and breakout opportunities.[/trans]
Source (PineScript)
/*backtest
start: 2024-02-29 00:00:00
end: 2025-02-26 08:00:00
period: 1d
basePeriod: 1d
exchanges: [{"eid":"Futures_Binance","currency":"ETH_USDT"}]
*/

//@version=5
strategy("Chart Pattern Strategy - Full Set", overlay=true)

// ATR settings for stop loss and take profit
atrLength = input.int(14, title="ATR Length")
atrValue = ta.atr(atrLength)
stopLoss = atrValue * 1.5  // Stop loss 1.5 ATR
takeProfit = atrValue * 3  // Take profit 3 ATR

// Head and Shoulders Detection
isHeadAndShoulders() =>
    high[1] > high[2] and high[1] > high[0] and high[1] > high[3] and high[1] > high[4] and high[0] < high[2] and high[0] < high[3]

// Double Top Detection
isDoubleTop() =>
    high[1] > high[2] and high[1] > high[0] and high[1] > high[3] and high[1] > high[4] and high[0] < high[2] and high[0] < high[3]

// Double Bottom Detection
isDoubleBottom() =>
    low[1] < low[2] and low[1] < low[0] and low[1] < low[3] and low[1] < low[4] and low[0] > low[2] and low[0] > low[3]

// Symmetrical Triangle Detection
isSymmetricalTriangle() =>
    high[2] > high[1] and low[2] < low[1] and high[3] < high[2] and low[3] > low[2]

// Ascending Triangle Detection (Bullish)
isAscendingTriangle() =>
    high[2] < high[1] and low[2] > low[1] and high[3] < high[2] and low[3] > low[2]

// Descending Triangle Detection (Bearish)
isDescendingTriangle() =>
    high[2] > high[1] and low[2] < low[1] and high[3] < high[2] and low[3] < low[2]

// Flags/Pennants Detection
isFlagPattern() =>
    high[1] < high[0] and low[1] > low[0] and high[2] < high[1] and low[2] < low[1]

// Entry Logic (Confirmation based on Breakouts)
longSignal = (isHeadAndShoulders() or isDoubleBottom() or isAscendingTriangle()) and close > high[1]
shortSignal = (isDoubleTop() or isDescendingTriangle() or isFlagPattern()) and close < low[1]

// Plotting Chart Patterns on the Chart
plotshape(isHeadAndShoulders(), title="Head and Shoulders", location=location.abovebar, color=color.red, style=shape.labelup, text="HS")
plotshape(isDoubleTop(), title="Double Top", location=location.abovebar, color=color.red, style=shape.labelup, text="DT")
plotshape(isDoubleBottom(), title="Double Bottom", location=location.belowbar, color=color.green, style=shape.labeldown, text="DB")
plotshape(isSymmetricalTriangle(), title="Symmetrical Triangle", location=location.top, color=color.blue, style=shape.triangledown, text="ST")
plotshape(isAscendingTriangle(), title="Ascending Triangle", location=location.belowbar, color=color.green, style=shape.labelup, text="AT")
plotshape(isDescendingTriangle(), title="Descending Triangle", location=location.abovebar, color=color.red, style=shape.labeldown, text="DT")
plotshape(isFlagPattern(), title="Flag Pattern", location=location.abovebar, color=color.orange, style=shape.triangledown, text="Flag")

// Executing Trades based on Patterns
if (longSignal)
    strategy.entry("Buy", strategy.long)
    strategy.exit("Take Profit/Stop Loss", from_entry="Buy", stop=close - stopLoss, limit=close + takeProfit)

if (shortSignal)
    strategy.entry("Sell", strategy.short)
    strategy.exit("Take Profit/Stop Loss", from_entry="Sell", stop=close + stopLoss, limit=close - takeProfit)
Detail
https://www.fmz.com/strategy/484094
Last Modified
2025-02-28 09:50:41