
12 KiB
Name
应用贝叶斯条件判断的RSI交易策略Bayesian-Condition-RSI-Trading-Strategy
Author
ChaoZhang
Strategy Description
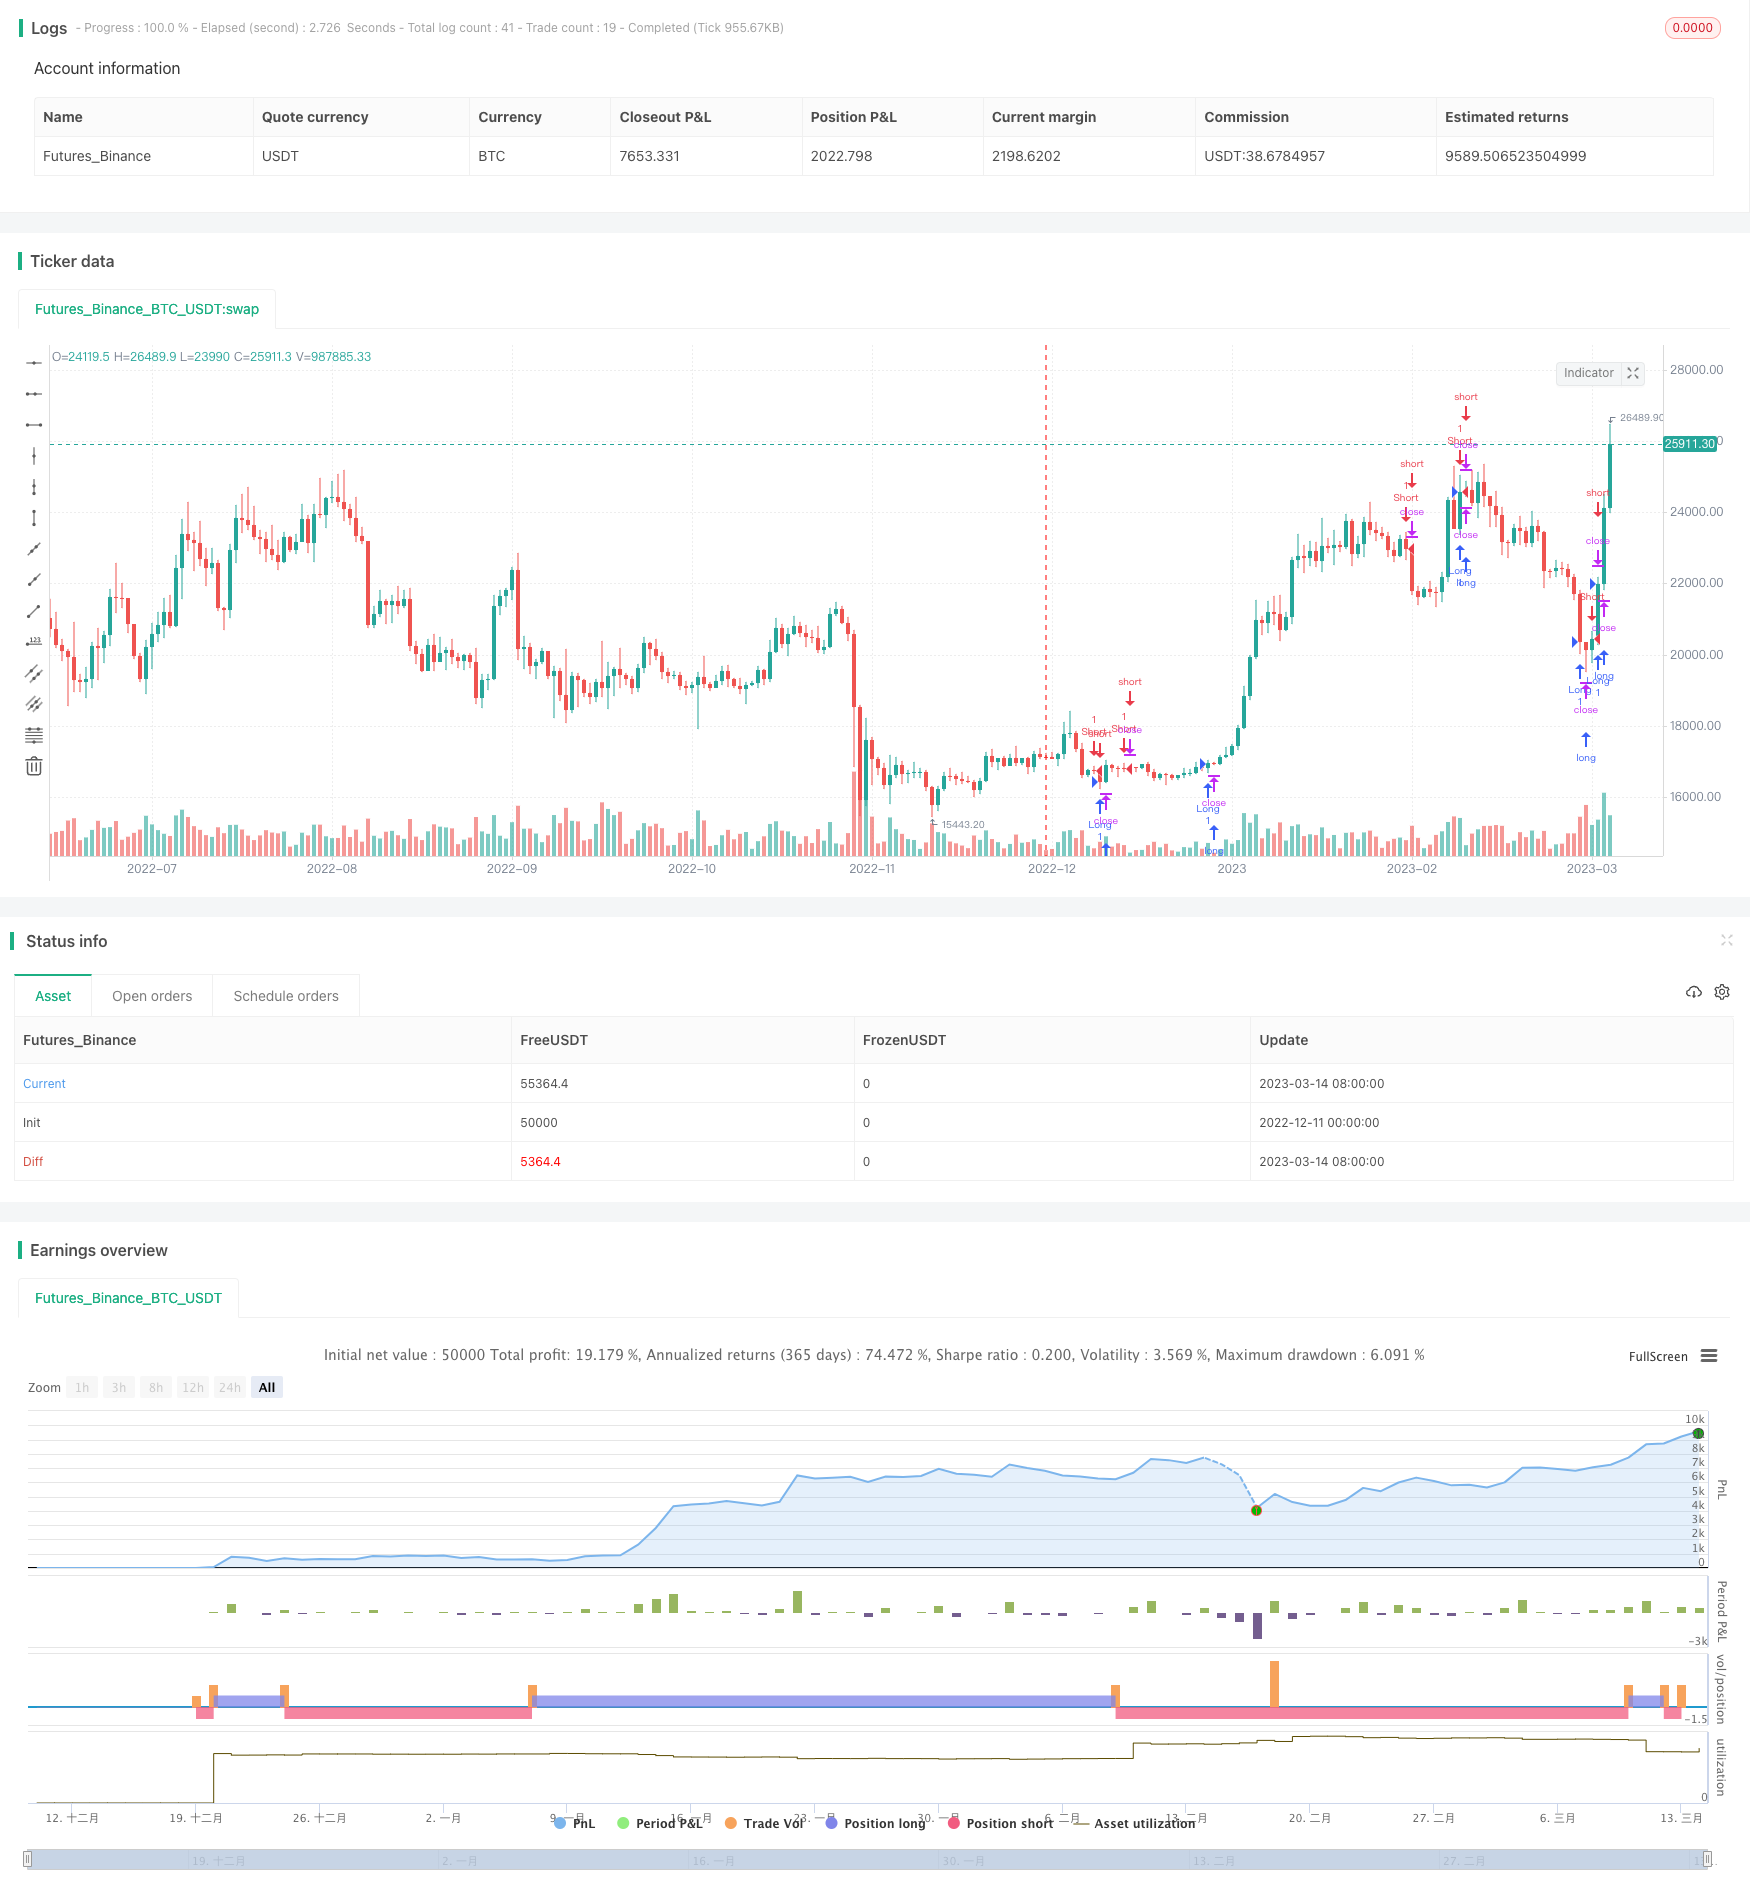
[trans]
概述
本文主要分析一种名为“应用贝叶斯条件判断的RSI交易策略”的量化交易策略。该策略通过计算RSI指标的概率分布,应用贝叶斯法则推算RSI指标继续上涨或下跌的概率,以判断未来价格趋势,实现盈利。
策略原理
该策略的核心逻辑是:
- 计算一定周期内收盘价是否上涨的概率分布A
- 计算相应周期内RSI指标是否继续上涨的概率分布B
- 应用贝叶斯法则,计算A和B同时发生的概率
- 当该概率高于阈值时,判断趋势会继续,采取交易信号
具体而言,策略先定义参数p为计算RSI指标的周期参数,r为预测未来价格变化的时间范围。然后在p周期内,统计收盘价是否上涨的次数,计算概率分布A。同时在p周期内,统计该周期结束后r周期内,RSI是否继续上涨的次数,计算概率分布B。
之后,应用贝叶斯法则公式,计算同时满足“收盘价上涨”和“RSI继续上涨”这两个条件的概率,作为最终概率判断指标。当该概率高于给定阈值时,判断趋势会持续上涨,采取做多交易;当概率低于阈值时,判断趋势反转,采取平仓。
这样,策略综合考虑了价格信息和技术指标信息,应用概率统计和贝叶斯法则,对未来趋势做出判断,实现交易信号的产生。
策略优势
该策略主要有以下优势:
-
结合多种信息:策略不仅考虑价格信息,也结合了RSI等技术指标信息,综合判断未来趋势,提高判断准确率。
-
概率预测:通过统计概率分布,对价格和RSI变化方向做出概率预测,而不是简单的数值比较,使判断更科学。
-
贝叶斯优化:运用贝叶斯法则计算相关概率,对原始统计概率进行优化,使判断更准确。
-
灵活参数:提供多种参数进行调整优化,能够针对不同市场和资产进行参数拟合,提高策略适应性。
-
简单有效:策略思路清晰,通过简单统计与概率运算实现交易信号判断,易于理解与优化,且效果明显。
策略风险
该策略也存在以下主要风险:
-
参数依赖:策略效果依赖参数设置,不同市场需要调整大量参数才能达到最佳效果,增加策略运维难度。
-
概率错误:由于统计时间和样本有限,计算所得概率可能与真实趋势不符,导致判断产生偏差。
-
特殊事件:重大突发事件可能影响市场价格与RSI指标的相关性,使策略失效。
-
技术指标失效:在某些市场情况下,RSI等技术指标可能会产生失效信号,导致策略判断失败。
对应风险的解决方法包括:优化参数设置流程、调整统计时间和样本量、结合更多auxiliary信息、人工干预异常情况等。
策略优化
该策略的主要优化方向有:
-
多时间框架:可以在多种时间周期(日线、周线等)上运行策略,综合判断,提高稳定性。
-
更多指标:加入更多技术指标信号,如K线形态、运动平均线等,丰富判断依据。
-
模型优化:应用机器学习等方法,对贝叶斯模型进行优化,使计算更准确。
-
动态参数:加入参数的动态优化模块,使参数可以根据实时市场变化进行调整。
-
风控机制:设定最大回撤、做单频次等风控指标,避免极端市场中巨额亏损。
-
集成改进:与其它类型策略或模型集成,形成投票机制,提高判断的稳定性。
总结
本策略首先统计价格和RSI指标的概率分布,然后利用贝叶斯法则计算复合概率,在概率高于给定阈值时产生交易信号,实现盈利。该策略综合多源信息,应用概率预测和贝叶斯优化,判断效果较好。主要优化方向包括时间框架扩展、指标增多、参数动态化等。总体来说,该策略思路独特,效果显著,非常值得探索与应用。
||
Overview
This article mainly analyzes a quantitative trading strategy called "Bayesian Condition RSI Trading Strategy". This strategy calculates the probability distribution of the RSI indicator and applies Bayesian rule to infer the probability of the RSI indicator continuing to rise or fall to judge future price trends and make profits.
Strategy Principle
The core logic of this strategy is:
- Calculate probability distribution A of whether the closing price has risen within a certain cycle
- Calculate probability distribution B of whether the RSI indicator continues to rise within the corresponding cycle
- Apply Bayesian rule to calculate the probability of A and B occurring simultaneously
- When this probability is higher than the threshold, judge that the trend will continue and take trading signals
Specifically, the strategy first defines the parameter p as the cycle parameter for calculating the RSI indicator, and r as the time range for predicting future price changes. Then within the p cycle, count the number of times the closing price rises to calculate the probability distribution A. At the same time, within the p cycle, count the number of times the RSI continues to rise within the r cycle after this cycle ends, and calculate the probability distribution B.
After that, apply the Bayesian formula to calculate the probability that the two conditions of "closing price rise" and "RSI continue to rise" are satisfied at the same time, as the final probability judgment indicator. When this probability is higher than a given threshold, judge that the uptrend will continue and take long positions; when the probability is lower than the threshold, judge that the trend is reversed and close positions.
In this way, the strategy comprehensively considers price information and technical indicators, applies probability statistics and Bayesian rules to judge future trends and generate trading signals.
Advantages of the Strategy
The main advantages of this strategy are:
-
Combining multiple information: The strategy considers not only price information, but also technical indicator information such as RSI to comprehensively judge future trends and improve judgment accuracy.
-
Probability prediction: Make probability predictions on the direction of price and RSI changes through statistical probability distribution, instead of simple numerical comparison, making the judgment more scientific.
-
Bayesian optimization: Use Bayesian rules to calculate relevant probabilities and optimize original statistical probabilities to make judgments more accurate.
-
Flexible parameters: Provide multiple parameters for adjustment and optimization to fit different markets and assets and improve adaptability of the strategy.
-
Simple and effective: The strategy idea is clear and simple statistical and probability operations are used to generate trading signal judgments, which is easy to understand and optimize, and the effect is significant.
Risks of the Strategy
The main risks of this strategy also include:
-
Parameter dependence: The performance relies heavily on parameter settings. Different markets need to adjust many parameters to achieve optimal results, increasing complexity of strategy operation.
-
Probability error: Due to limited statistical time and samples, the calculated probability may not match the real trend, leading to judgment deviation.
-
Special events: Major emergencies may affect the correlation between market prices and RSI indicators, causing strategy failure.
-
Technical indicator failure: In some market situations, technical indicators like RSI may produce invalid signals, leading to strategy judgment failure.
Solutions include: optimizing parameter setting process, adjusting statistical time and sample size, combining more auxiliary information, manual intervention in abnormal situations, etc.
Optimization Directions
The main optimization directions of this strategy include:
-
Multiple timeframes: Running strategies across multiple timeframes (daily, weekly etc) for integrated judgment to improve stability.
-
More indicators: Adding more technical indicator signals like candlestick patterns, moving averages etc to enrich basis for judgment.
-
Model optimization: Using machine learning etc to optimize the Bayesian model for more accurate calculations.
-
Dynamic parameters: Adding dynamic optimization modules for parameters to adjust in real-time with market changes.
-
Risk control mechanism: Setting risk metrics like maximum drawdown and trade frequencies to prevent huge losses in extreme markets.
-
Ensemble improvements: Ensemble with other strategy types or models to form voting mechanisms and improve stability.
Conclusion
This strategy first statistically calculates probability distributions of price and RSI, then uses Bayesian rules to compute combined probabilities, generating trading signals when probabilities exceed set thresholds, thus profiting. This strategy combines multi-source information, leverages probability prediction and Bayesian optimization for decent judgment performance. Main optimization directions include timeframe expansion, more indicators, dynamic parameters etc. In conclusion, this strategy has a unique idea and remarkable effect that is worth exploring and applying.
[/trans]
Strategy Arguments
| Argument | Default | Description |
|---|---|---|
| v_input_1 | 30 | Period |
| v_input_2 | 1.003 | Movement Thresh |
| v_input_3 | 7 | Look Range |
| v_input_4 | 8 | Jump |
| v_input_5 | 3 | SM |
| v_input_6 | 14 | RSIP |
Source (PineScript)
/*backtest
start: 2022-12-11 00:00:00
end: 2023-03-15 00:00:00
period: 1d
basePeriod: 1h
exchanges: [{"eid":"Futures_Binance","currency":"BTC_USDT"}]
*/

//@version=2
// Stealthy7 trading scripts are radikal. You have entered the mystical realm of demonic profit.
// If you like this script, check out my bots at cryptotrader.org/?r=51
// Let me know if you find any improvements to this script. It is beta.
// Please subscribe.
strategy("Stealthy7 Bayes Conditional RSI Trader Strategy", overlay=true)
p = input(title="Period",  defval=30, minval=5, maxval=500)
t = input(title="Movement Thresh", type=float, defval=1.003, minval=1.001, maxval=1.5, step=0.001)
r = input(title="Look Range",  defval=7, minval=1,maxval=500, step=1)
RSIT = input(title="Jump",  defval=8, minval=1,maxval=99, step=1)
BAYEST = input(title="SM",  defval=3, minval=1,maxval=99, step=1)
RSIP = input(title="RSIP",  defval=14, minval=2,maxval=100, step=1)
countup = 1
countdn = 1
countupS = 1
countdnS = 1
for i = p to 1
    if close[i]/close[i + r] > t
        countup := countup + 1
    else
        countdn := countdn + 1
    if close[i]/close[i + r] < 2 - t
        countupS := countupS + 1
    else
        countdnS := countdnS + 1

rsi = rsi(open,RSIP)

countup2 = 1
countup3 = 1
countup2S = 1
countup3S = 1
for i = p to 1
    if close[i]/close[i + r] > t and rsi[i + r + 1] > rsi[i + r + 2] + RSIT
        countup2 := countup2 + 1
    else
        countup3 := countup3 + 1
    if close[i]/close[i + r] < 2 - t and rsi[i + r + 1] < rsi[i + r + 2] - RSIT
        countup2S := countup2S + 1
    else
        countup3S := countup3S + 1

countup2b = countup2 / p
countup3b = countup3 / p
countupb = countup / p
countdnb = countdn / p

countup2bS = countup2S / p
countup3bS = countup3S / p
countupbS = countupS / p
countdnbS = countdnS / p
bayes = 0
bayes := ((countupb * countup2b) / ((countupb * countup2b) + (countdnb * countup3b))) * 100
bayesS = 0
bayesS := ((countupbS * countup2bS) / ((countupbS * countup2bS) + (countdnbS * countup3bS))) * 100
SN1 = sma(bayes,BAYEST)
SN2 = sma(bayesS,BAYEST)
shortCondition = crossunder(bayesS, SN2) //and rsi < 49
longCondition = crossover(bayes, SN1) //and rsi > 59
if (longCondition)
    strategy.entry("Long", strategy.long)
if (shortCondition)
    strategy.entry("Short", strategy.short)
Detail
https://www.fmz.com/strategy/435763
Last Modified
2023-12-18 17:09:00