
7.1 KiB
Name
布林带RSI均值回归增强型量化策略-Enhanced-Mean-Reversion-Strategy-with-Bollinger-Bands-and-RSI-Integration
Author
ChaoZhang
Strategy Description
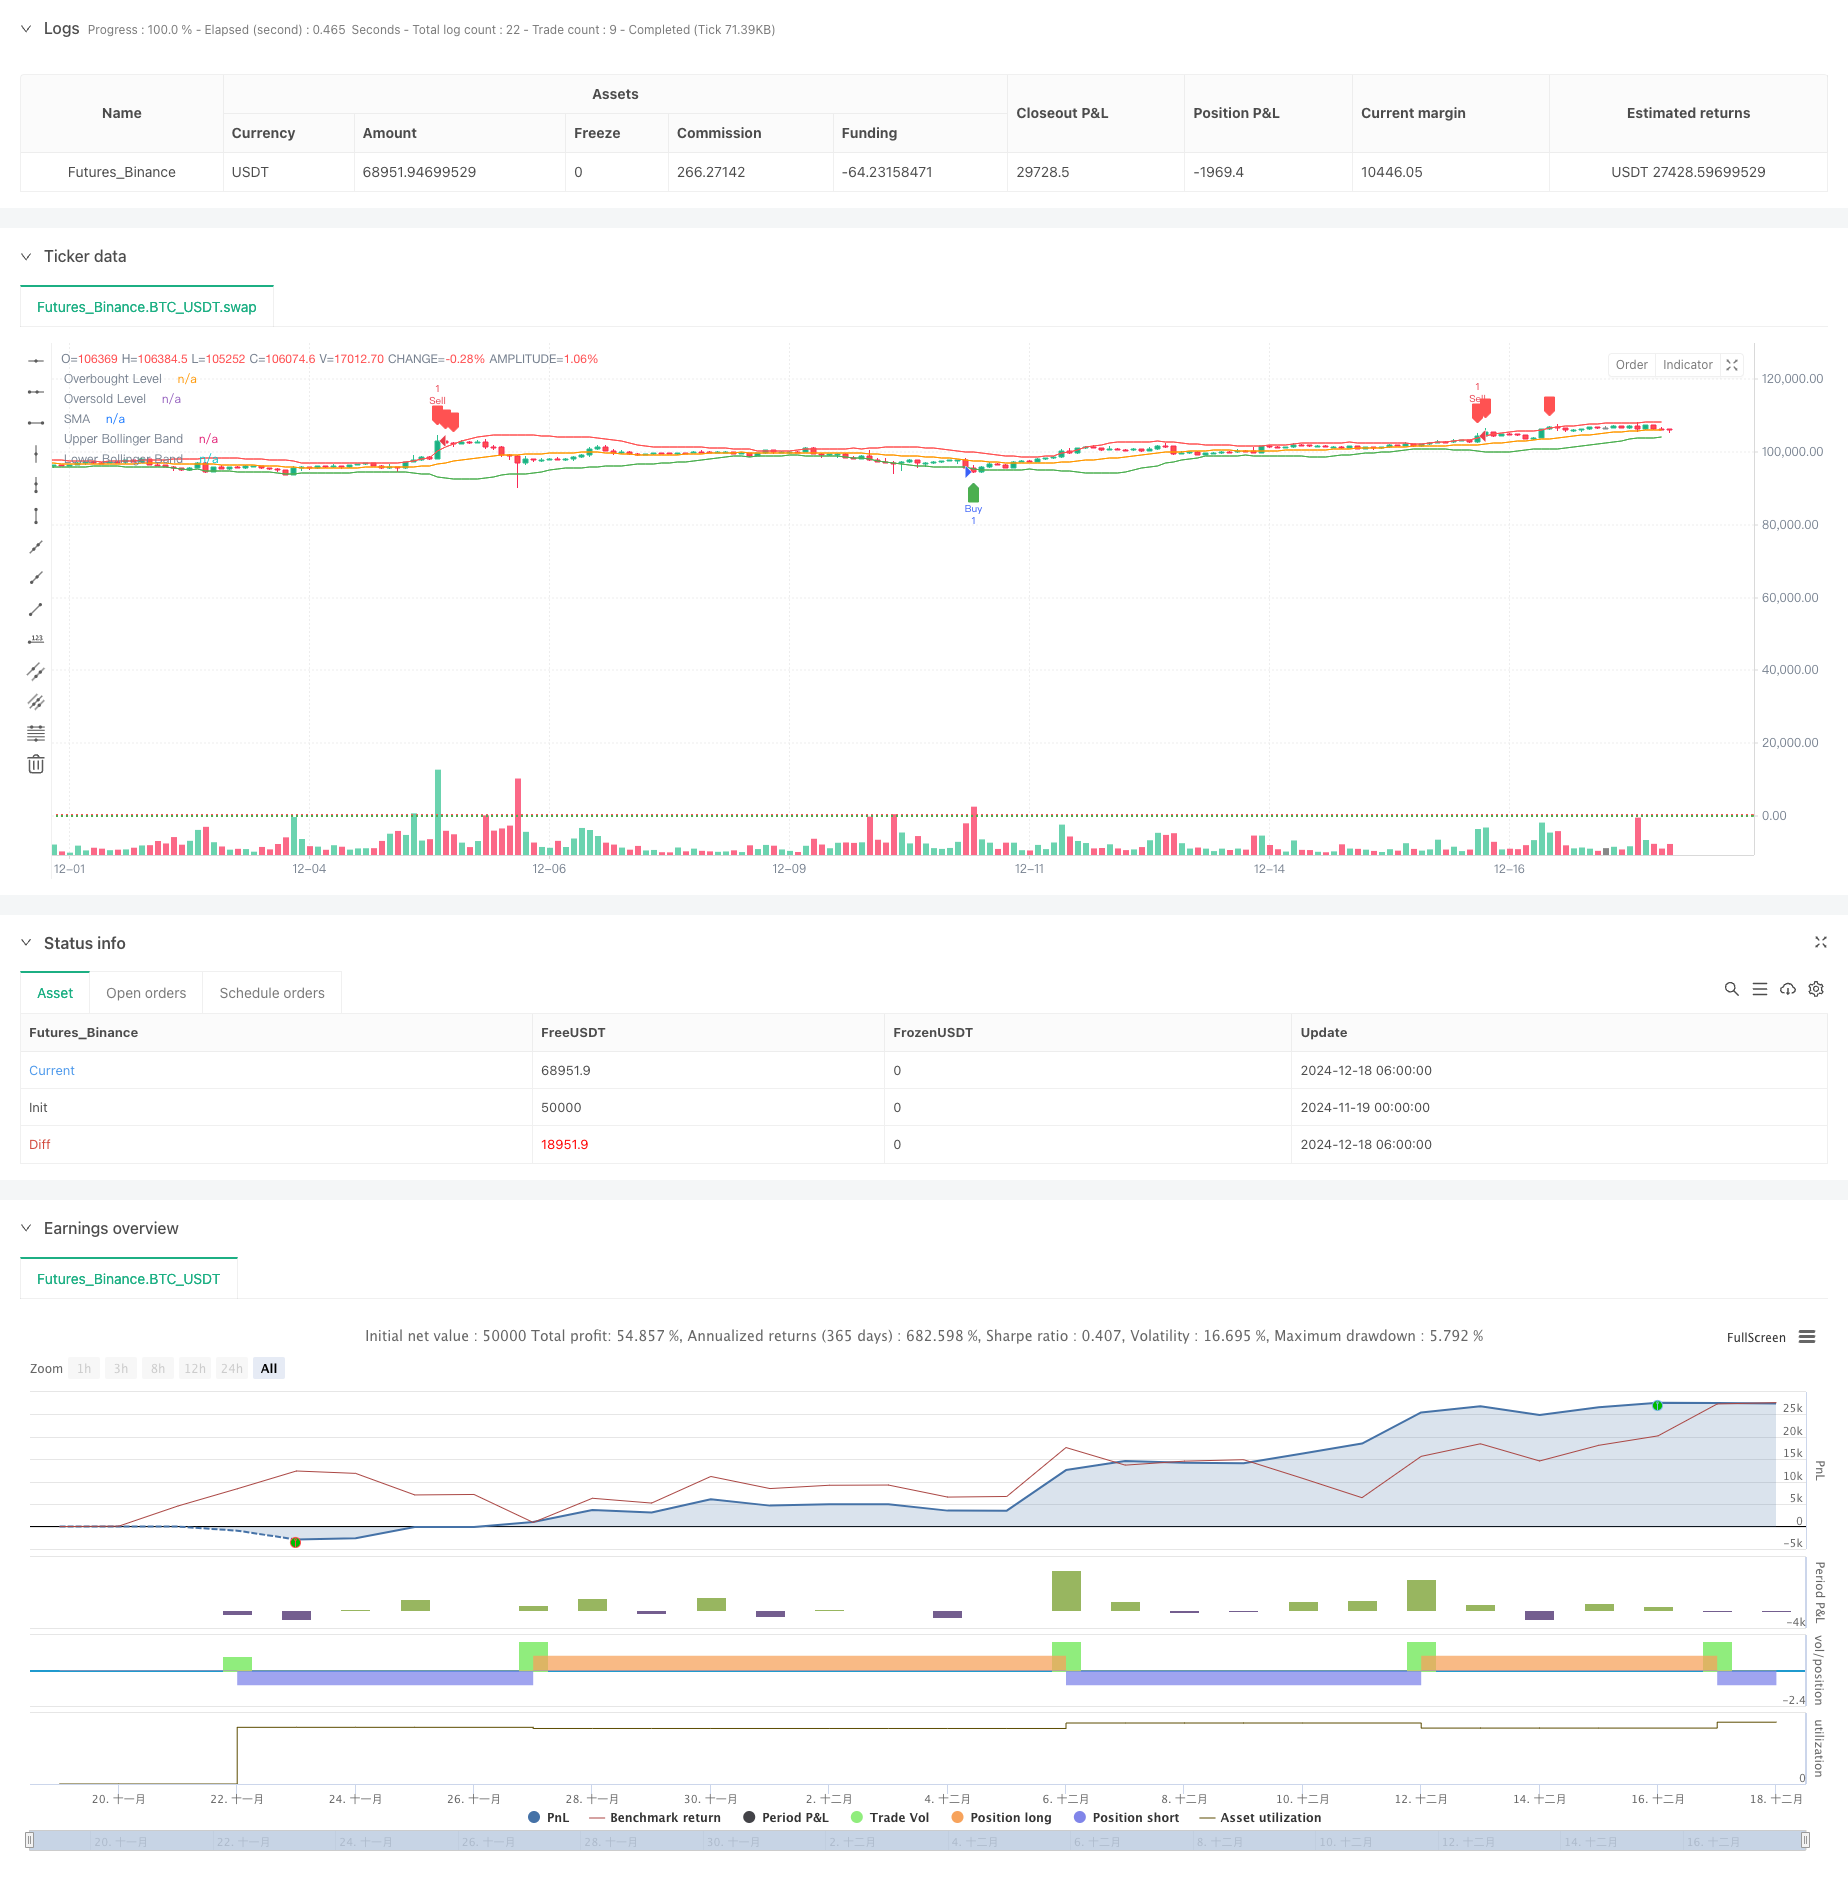
[trans]
概述
该策略是一个结合了布林带(Bollinger Bands)和相对强弱指标(RSI)的均值回归交易系统。策略通过识别价格偏离均值的极端情况,并结合RSI超买超卖信号来确定交易时机。当价格突破布林带下轨且RSI处于超卖区域时产生做多信号,当价格突破布林带上轨且RSI处于超买区域时产生做空信号。
策略原理
策略的核心逻辑基于金融市场的均值回归特性。具体实现上,使用20日简单移动平均线(SMA)作为均值参考,标准差乘数为2.0计算布林带宽度。同时引入14日RSI作为辅助指标,设定70和30作为超买超卖阈值。策略在价格突破布林带且RSI达到极值时才触发交易信号,这种双重确认机制提高了策略的可靠性。
策略优势
- 结合多重技术指标,提供更可靠的交易信号
- 通过RSI配合布林带,有效过滤假突破
- 参数可调整性强,适应不同市场环境
- 策略逻辑清晰,易于理解和实施
- 具有完善的风险控制机制
- 代码实现简洁高效,便于维护和优化
策略风险
- 在趋势市场中可能频繁提前平仓,影响收益
- 参数选择不当可能导致信号滞后
- 市场剧烈波动时可能造成较大回撤
- 需要考虑交易成本对策略收益的影响
- 不同市场环境下策略表现差异较大
策略优化方向
- 引入自适应布林带宽度,根据市场波动性动态调整
- 增加趋势过滤器,在强趋势市场中降低交易频率
- 优化RSI参数,考虑使用自适应周期
- 加入止损止盈机制,提高风险收益比
- 考虑引入成交量指标,提高信号可靠性
- 开发参数优化模块,实现策略自动调优
总结
该策略通过布林带和RSI的协同作用,构建了一个稳健的均值回归交易系统。策略设计合理,具有良好的可扩展性和适应性。通过持续优化和完善,可以进一步提升策略的稳定性和盈利能力。建议在实盘交易前进行充分的回测验证,并根据具体市场特征调整参数设置。
||
Overview
This strategy is a mean reversion trading system that combines Bollinger Bands and Relative Strength Index (RSI). It identifies extreme price deviations from the mean and uses RSI overbought/oversold signals to determine trading opportunities. Buy signals are generated when price breaks below the lower Bollinger Band and RSI is in oversold territory, while sell signals occur when price breaks above the upper Bollinger Band and RSI is in overbought territory.
Strategy Principle
The core logic is based on the mean reversion characteristic of financial markets. The implementation uses a 20-day Simple Moving Average (SMA) as the mean reference, with a standard deviation multiplier of 2.0 for Bollinger Band width calculation. A 14-day RSI is integrated as a supplementary indicator, with 70 and 30 set as overbought and oversold thresholds respectively. Trades are only triggered when price breaks the Bollinger Bands and RSI reaches extreme values, creating a dual confirmation mechanism that enhances strategy reliability.
Strategy Advantages
- Combines multiple technical indicators for more reliable trading signals
- Effectively filters false breakouts using RSI confirmation
- Highly adjustable parameters to adapt to different market conditions
- Clear strategy logic that is easy to understand and implement
- Comprehensive risk control mechanism
- Clean and efficient code implementation for easy maintenance and optimization
Strategy Risks
- May exit positions prematurely in trending markets, affecting returns
- Improper parameter selection can lead to delayed signals
- Potential for significant drawdowns during extreme market volatility
- Need to consider the impact of trading costs on strategy returns
- Strategy performance varies significantly across different market conditions
Optimization Directions
- Implement adaptive Bollinger Band width based on market volatility
- Add trend filters to reduce trading frequency in strong trend markets
- Optimize RSI parameters with adaptive periods
- Incorporate stop-loss and take-profit mechanisms to improve risk-reward ratio
- Consider adding volume indicators to enhance signal reliability
- Develop parameter optimization module for strategy auto-tuning
Summary
This strategy constructs a robust mean reversion trading system through the synergy of Bollinger Bands and RSI. The strategy design is reasonable with good scalability and adaptability. Through continuous optimization and improvement, the strategy's stability and profitability can be further enhanced. It is recommended to conduct thorough backtesting before live trading and adjust parameters according to specific market characteristics.[/trans]
Source (PineScript)
/*backtest
start: 2024-11-19 00:00:00
end: 2024-12-18 08:00:00
period: 2h
basePeriod: 2h
exchanges: [{"eid":"Futures_Binance","currency":"BTC_USDT"}]
*/

//@version=5
strategy("Mean Reversion Strategy", overlay=true)

// User Inputs
length = input.int(20, title="SMA Length")  // Moving Average length
stdDev = input.float(2.0, title="Standard Deviation Multiplier")  // Bollinger Band deviation
rsiLength = input.int(14, title="RSI Length")  // RSI calculation length
rsiOverbought = input.int(70, title="RSI Overbought Level")  // RSI overbought threshold
rsiOversold = input.int(30, title="RSI Oversold Level")  // RSI oversold threshold

// Bollinger Bands
sma = ta.sma(close, length)  // Calculate the SMA
stdDevValue = ta.stdev(close, length)  // Calculate Standard Deviation
upperBand = sma + stdDev * stdDevValue  // Upper Bollinger Band
lowerBand = sma - stdDev * stdDevValue  // Lower Bollinger Band

// RSI
rsi = ta.rsi(close, rsiLength)  // Calculate RSI

// Plot Bollinger Bands
plot(sma, color=color.orange, title="SMA")  // Plot SMA
plot(upperBand, color=color.red, title="Upper Bollinger Band")  // Plot Upper Band
plot(lowerBand, color=color.green, title="Lower Bollinger Band")  // Plot Lower Band

// Plot RSI Levels (Optional)
hline(rsiOverbought, "Overbought Level", color=color.red, linestyle=hline.style_dotted)
hline(rsiOversold, "Oversold Level", color=color.green, linestyle=hline.style_dotted)

// Buy and Sell Conditions
buyCondition = (close < lowerBand) and (rsi < rsiOversold)  // Price below Lower Band and RSI Oversold
sellCondition = (close > upperBand) and (rsi > rsiOverbought)  // Price above Upper Band and RSI Overbought

// Execute Strategy
if (buyCondition)
    strategy.entry("Buy", strategy.long)
if (sellCondition)
    strategy.entry("Sell", strategy.short)

// Optional: Plot Buy/Sell Signals
plotshape(series=buyCondition, location=location.belowbar, color=color.green, style=shape.labelup, title="Buy Signal")
plotshape(series=sellCondition, location=location.abovebar, color=color.red, style=shape.labeldown, title="Sell Signal")
Detail
https://www.fmz.com/strategy/475636
Last Modified
2024-12-20 17:03:24