
14 KiB
Name
布林带风险管理的看涨吞没策略量化交易系统-Bullish-Engulfing-Quantitative-Trading-System-with-Bollinger-Bands-Risk-Management
Author
ianzeng123
Strategy Description
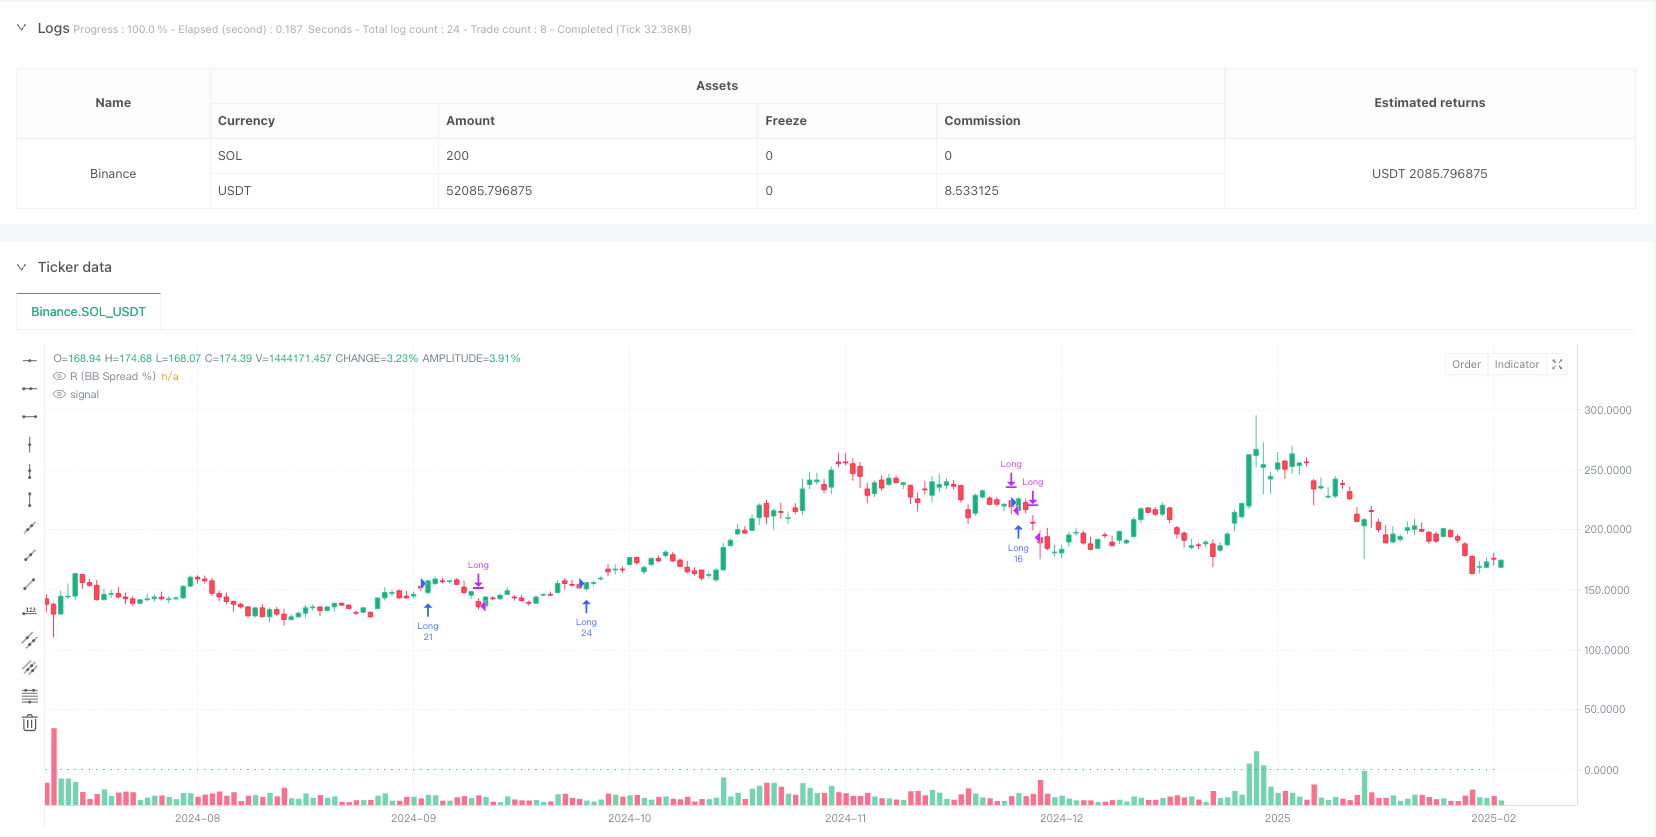
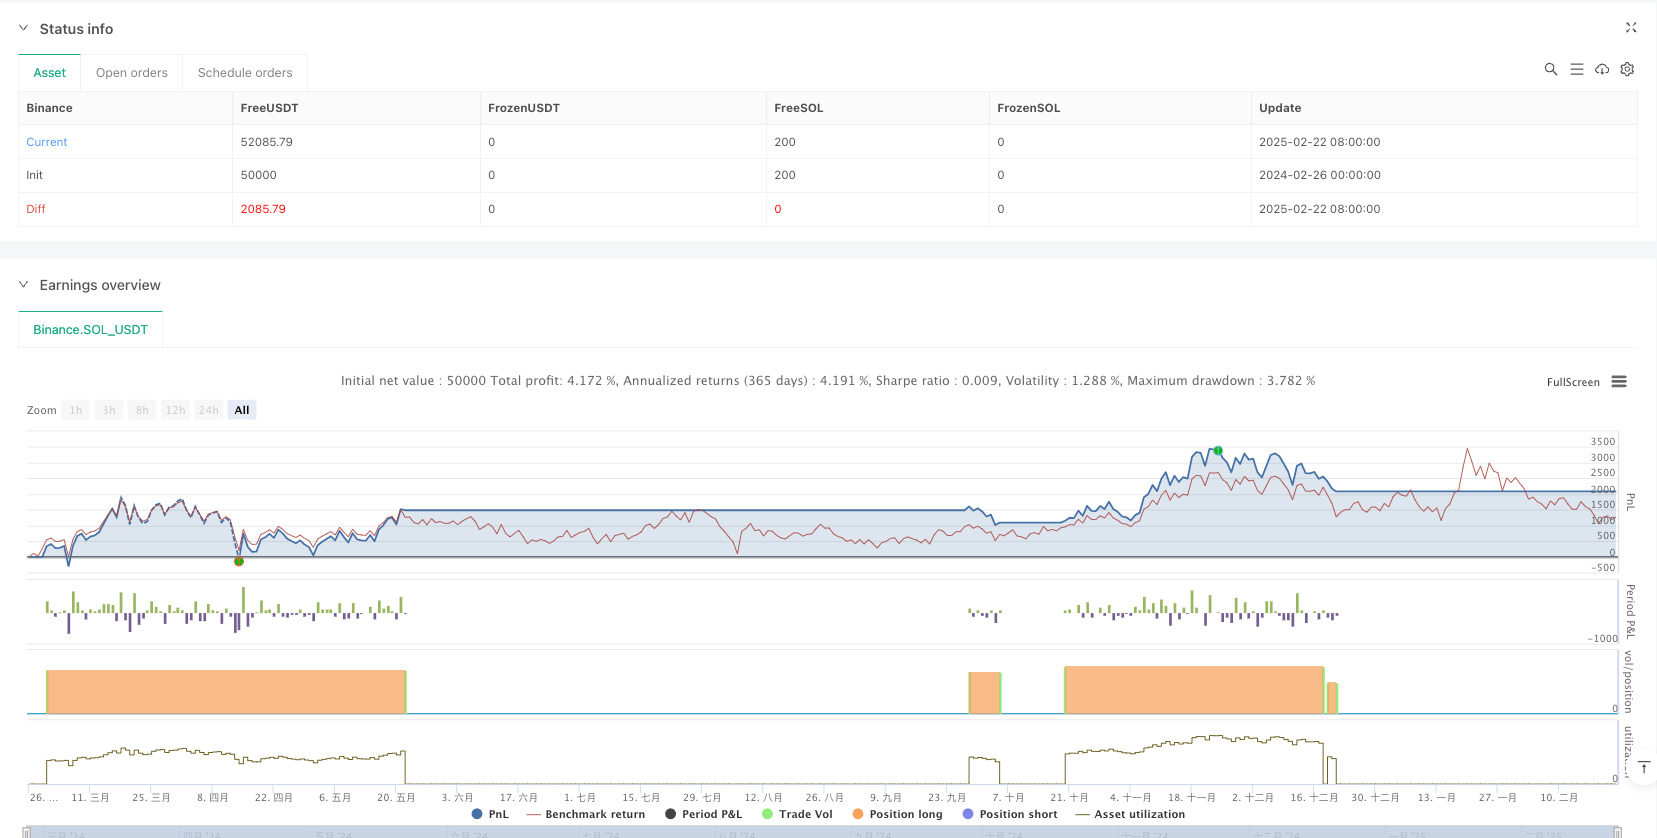
[trans]#### 概述 本策略是一个基于技术分析的量化交易系统,主要利用看涨吞没形态作为入场信号,并结合布林带波动性指标进行风险管理和仓位控制。该策略在识别到看涨吞没形态后,会根据布林带计算的波动范围确定风险比率(R值),然后基于账户总值的固定比例(0.75%)计算精确的仓位大小,最终通过设置动态止损和固定风险回报比(4R)的获利目标来管理交易。
策略原理
本策略的核心逻辑主要分为三个部分:信号生成、仓位管理和退出条件。
首先,信号生成基于看涨吞没形态,该形态需满足以下条件:
- 当前K线收盘价高于开盘价(阳线)
- 前一根K线收盘价低于开盘价(阴线)
- 当前K线收盘价高于前一根K线的开盘价
- 当前K线开盘价低于前一根K线的收盘价
- 交易量需大于设定的最小值(默认为1,000,000)
其次,仓位管理通过以下步骤实现:
- 使用40周期、2.5标准差的布林带计算上下轨
- 通过布林带上下轨之间的价差计算R值:R = 0.4 * (1 - (下轨 / 上轨))
- 使用投资组合总值的0.75%作为每笔交易的风险金额
- 根据止损距离(R值)和入场价格计算精确的仓位大小
最后,退出条件设置为:
- 止损:当价格下跌至入场价格减去R%时退出
- 获利:当价格上涨至入场价格加上4R%时退出
策略优势
-
风险控制精确且动态:该策略不使用固定的止损点,而是根据市场当前波动性(通过布林带计算)动态调整风险参数,使系统能够自适应不同市场环境。
-
固定比例风险管理:每笔交易仅风险账户的0.75%,有效防止单笔交易的过度损失,实现长期资金管理的稳定性。
-
精确的仓位计算:基于布林带波动性和风险金额精确计算每笔交易的仓位大小,确保在不同市场条件下维持一致的风险暴露。
-
明确的风险回报比:固定使用4R的获利目标,确保每笔交易的潜在收益是潜在风险的4倍,符合专业交易的风险回报要求。
-
可视化交易情况:通过标记入场信号和绘制交易区间框,帮助交易者直观了解交易表现。
策略风险
-
时效性风险:看涨吞没形态是一种短期价格反转信号,可能无法预测中长期趋势变化,在强趋势市场中可能导致过早入场。
-
市场条件限制:该策略在高波动或缺乏流动性的市场中可能表现不佳,特别是当布林带异常扩张或收缩时。
-
局限的入场条件:仅依赖单一的看涨吞没形态可能导致信号稀少或错过其他有效的入场机会。
-
固定乘数风险:使用固定的0.4系数来计算R值可能在某些市场条件下不够灵活,无法充分适应极端市场环境。
-
潜在滑点问题:在高波动市场中,实际止损执行价格可能会出现明显滑点,影响实际风险控制效果。
策略优化方向
-
增加过滤条件:可以考虑添加趋势确认指标(如移动平均线),确保只在主趋势方向上交易看涨吞没形态,避免逆势交易。
-
多时间框架分析:引入更高时间框架的市场结构分析,只在更高时间框架趋势方向一致时执行交易,提高信号质量。
-
动态调整风险参数:将固定的0.75%风险比例和0.4的R值系数设为可调整参数,根据市场波动性自动调整,在低波动市场增加风险,高波动市场降低风险。
-
优化退出策略:可以考虑添加移动止损或基于指标的动态出场条件,而不仅仅依赖固定的止损和获利水平。
-
增加多指标确认:将看涨吞没形态与其他技术指标(如RSI、MACD或成交量分析)结合,提高入场信号的可靠性。
总结
布林带风险管理的看涨吞没策略量化交易系统是一个结合了传统蜡烛图形态识别和现代风险管理方法的完整交易系统。该策略通过布林带动态调整风险参数,精确控制每笔交易的仓位大小,并使用固定的风险回报比设置获利目标。这种方法在保持交易纪律的同时,也提供了对市场波动性的适应能力。
虽然该策略在风险管理方面表现出色,但仍有优化空间,特别是在入场信号的质量和退出策略的灵活性方面。通过增加额外的过滤条件、多时间框架分析和动态风险参数调整,该策略可以进一步提高在不同市场环境下的适应性和盈利能力。
综合来看,这是一个具有专业风险管理特性的完整交易系统,适合那些重视资金管理和风险控制的交易者使用。通过合理的优化和参数调整,该策略可以成为长期稳定的交易工具。 ||
Overview
This strategy is a quantitative trading system based on technical analysis, primarily utilizing the Bullish Engulfing pattern as an entry signal, combined with Bollinger Bands volatility indicators for risk management and position sizing. After identifying a Bullish Engulfing pattern, the strategy calculates a risk ratio (R value) based on the Bollinger Bands range, then determines precise position size based on a fixed percentage (0.75%) of account equity, and finally manages trades through dynamic stop-loss and a fixed risk-reward ratio (4R) take-profit target.
Strategy Principles
The core logic of this strategy is divided into three main components: signal generation, position management, and exit conditions.
First, signal generation is based on the Bullish Engulfing pattern, which must meet the following criteria:
- Current candle's close is higher than its open (bullish candle)
- Previous candle's close is lower than its open (bearish candle)
- Current candle's close is higher than the previous candle's open
- Current candle's open is lower than the previous candle's close
- Volume exceeds a minimum threshold (default 1,000,000)
Second, position management is implemented through these steps:
- Calculate Bollinger Bands with 40-period length and 2.5 standard deviations
- Compute the R value from the Bollinger Bands spread: R = 0.4 * (1 - (lowerBB / upperBB))
- Use 0.75% of the portfolio equity as the risk amount per trade
- Calculate precise position size based on the stop-loss distance (R value) and entry price
Finally, exit conditions are set as:
- Stop-loss: Exit when price drops to entry price minus R%
- Take-profit: Exit when price rises to entry price plus 4R%
Strategy Advantages
-
Precise and Dynamic Risk Control: The strategy doesn't use fixed stop-loss points but dynamically adjusts risk parameters based on current market volatility (calculated through Bollinger Bands), allowing the system to adapt to different market environments.
-
Fixed-Percentage Risk Management: Each trade risks only 0.75% of the account, effectively preventing excessive losses from single trades and achieving long-term capital management stability.
-
Precise Position Sizing: Position size is calculated precisely based on Bollinger Bands volatility and risk amount, ensuring consistent risk exposure under different market conditions.
-
Clear Risk-Reward Ratio: A fixed 4R take-profit target ensures that each trade's potential reward is 4 times the potential risk, aligning with professional trading risk-reward requirements.
-
Trade Visualization: Entry signals and trade range boxes are visually marked, helping traders intuitively understand trade performance.
Strategy Risks
-
Timing Risk: The Bullish Engulfing pattern is a short-term price reversal signal that may not predict medium or long-term trend changes, potentially leading to premature entries in strong trending markets.
-
Market Condition Limitations: The strategy may underperform in highly volatile or illiquid markets, especially when Bollinger Bands abnormally expand or contract.
-
Limited Entry Conditions: Relying solely on the Bullish Engulfing pattern may result in sparse signals or missed valid entry opportunities.
-
Fixed Multiplier Risk: Using a fixed 0.4 coefficient to calculate the R value may not be flexible enough in certain market conditions, failing to fully adapt to extreme market environments.
-
Potential Slippage Issues: In highly volatile markets, actual stop-loss execution prices may experience significant slippage, affecting real risk control effectiveness.
Strategy Optimization Directions
-
Add Filtering Conditions: Consider adding trend confirmation indicators (such as moving averages) to ensure trading Bullish Engulfing patterns only in the direction of the main trend, avoiding counter-trend trading.
-
Multi-Timeframe Analysis: Introduce higher timeframe market structure analysis, executing trades only when aligned with higher timeframe trends to improve signal quality.
-
Dynamic Risk Parameter Adjustment: Make the fixed 0.75% risk percentage and 0.4 R value coefficient adjustable parameters that automatically adapt to market volatility, increasing risk in low-volatility markets and reducing it in high-volatility markets.
-
Optimize Exit Strategy: Consider adding trailing stops or indicator-based dynamic exit conditions, rather than relying solely on fixed stop-loss and take-profit levels.
-
Add Multi-Indicator Confirmation: Combine the Bullish Engulfing pattern with other technical indicators (such as RSI, MACD, or volume analysis) to improve entry signal reliability.
Summary
The Bullish Engulfing Quantitative Trading System with Bollinger Bands Risk Management is a complete trading system that combines traditional candlestick pattern recognition with modern risk management methods. The strategy dynamically adjusts risk parameters through Bollinger Bands, precisely controls position size for each trade, and sets profit targets using a fixed risk-reward ratio. This approach provides adaptability to market volatility while maintaining trading discipline.
While the strategy excels in risk management, there is room for optimization, particularly in entry signal quality and exit strategy flexibility. By adding additional filtering conditions, multi-timeframe analysis, and dynamic risk parameter adjustments, the strategy can further improve its adaptability and profitability across different market environments.
Overall, this is a complete trading system with professional risk management characteristics, suitable for traders who value capital management and risk control. With reasonable optimization and parameter adjustments, this strategy can become a stable long-term trading tool.[/trans]
Source (PineScript)
/*backtest
start: 2024-02-26 00:00:00
end: 2025-02-23 08:00:00
period: 1d
basePeriod: 1d
exchanges: [{"eid":"Binance","currency":"SOL_USDT"}]
*/

//@version=5
strategy("Bullish Engulfing Strategy with BB Risk", overlay=true)

// Input parameters for customization (optional, can be adjusted in Strategy Tester)
minVolume = input.int(1000000, "Minimum Volume", minval=1)  // Optional filter for liquidity

// Calculate Bollinger Bands (length=40, StdDev=2.5) for R
length = 40
mult = 2.5
basis = ta.sma(close, length)  // Middle Band (40-period SMA of close)
dev = mult * ta.stdev(close, length)  // Standard deviation multiplied by 2.5
upperBB = basis + dev  // Upper Bollinger Band
lowerBB = basis - dev  // Lower Bollinger Band

// Define R as 0.4 times the Bollinger Bands spread: R = 0.4 * ((1 - (lowerBB / upperBB)) * 100)
R = 0.4 * (1 - (lowerBB / upperBB))  // Percentage value, scaled by 0.4

// Define Bullish Engulfing pattern with optional volume filter
isBullishEngulfing() => close > open and close[1] < open[1] and close > open[1] and open < close[1] and close[1] < open[1] and close > open and volume > minVolume

bullishEngulfing = isBullishEngulfing()

// Track position and entry details
var bool inPosition = false
var float entryPrice = 0.0
var int entryBar = 0
var int exitBar = 0  // Track exit bar (added here to fix undeclared variable)
var float exitPrice = 0.0  // Track exit price

// Enter long position on the next bar after Bullish Engulfing, with position size risking 0.75% of portfolio
if (bullishEngulfing and not inPosition)
    // Calculate position size to risk 0.75% of portfolio
    portfolioValue = strategy.equity  // Current portfolio equity
    riskPerTrade = portfolioValue * 0.0075  // 0.75% of portfolio
    stopLossDistance = R  // R% of entry price (stop-loss distance)
    entryPrice := close
    positionSize = riskPerTrade / stopLossDistance / entryPrice  // Position size in units (contracts/shares)

    // Ensure positionSize is rounded to a practical number (e.g., whole shares)
    positionSize := math.round(positionSize)

    // Enter long position with calculated size
    strategy.entry("Long", strategy.long, limit = entryPrice, qty=positionSize)
    inPosition := true
    entryBar := bar_index

// Exit logic: Stop-loss or Take-profit
if (inPosition)
    // Stop-loss: Exit if price drops below entryPrice - R%
    stopLossLevel = entryPrice * (1 - R)
    if (low <= stopLossLevel)
        strategy.close("Long")
        inPosition := false
        exitBar := bar_index
        exitPrice := close

    // Take-profit: Exit if price rises above entryPrice + 4R%
    takeProfitLevel = entryPrice * (1 + 4 * R)
    if (high >= takeProfitLevel)
        strategy.close("Long")
        inPosition := false
        exitBar := bar_index
        exitPrice := close

// Optional: Plot signals and R for visualization
if (bullishEngulfing)
    label.new(bar_index, high, "Bullish Engulfing", yloc=yloc.abovebar, color=color.green, style=label.style_label_down, textcolor=color.white)

plot(R, title="R (BB Spread %)", color=color.blue, style=plot.style_histogram)
Detail
https://www.fmz.com/strategy/483677
Last Modified
2025-02-25 10:57:40