
7.5 KiB
Name
布林带趋势突破交易策略Bollinger-Bands-Breakout-Trend-Trading-Strategy
Author
ChaoZhang
Strategy Description
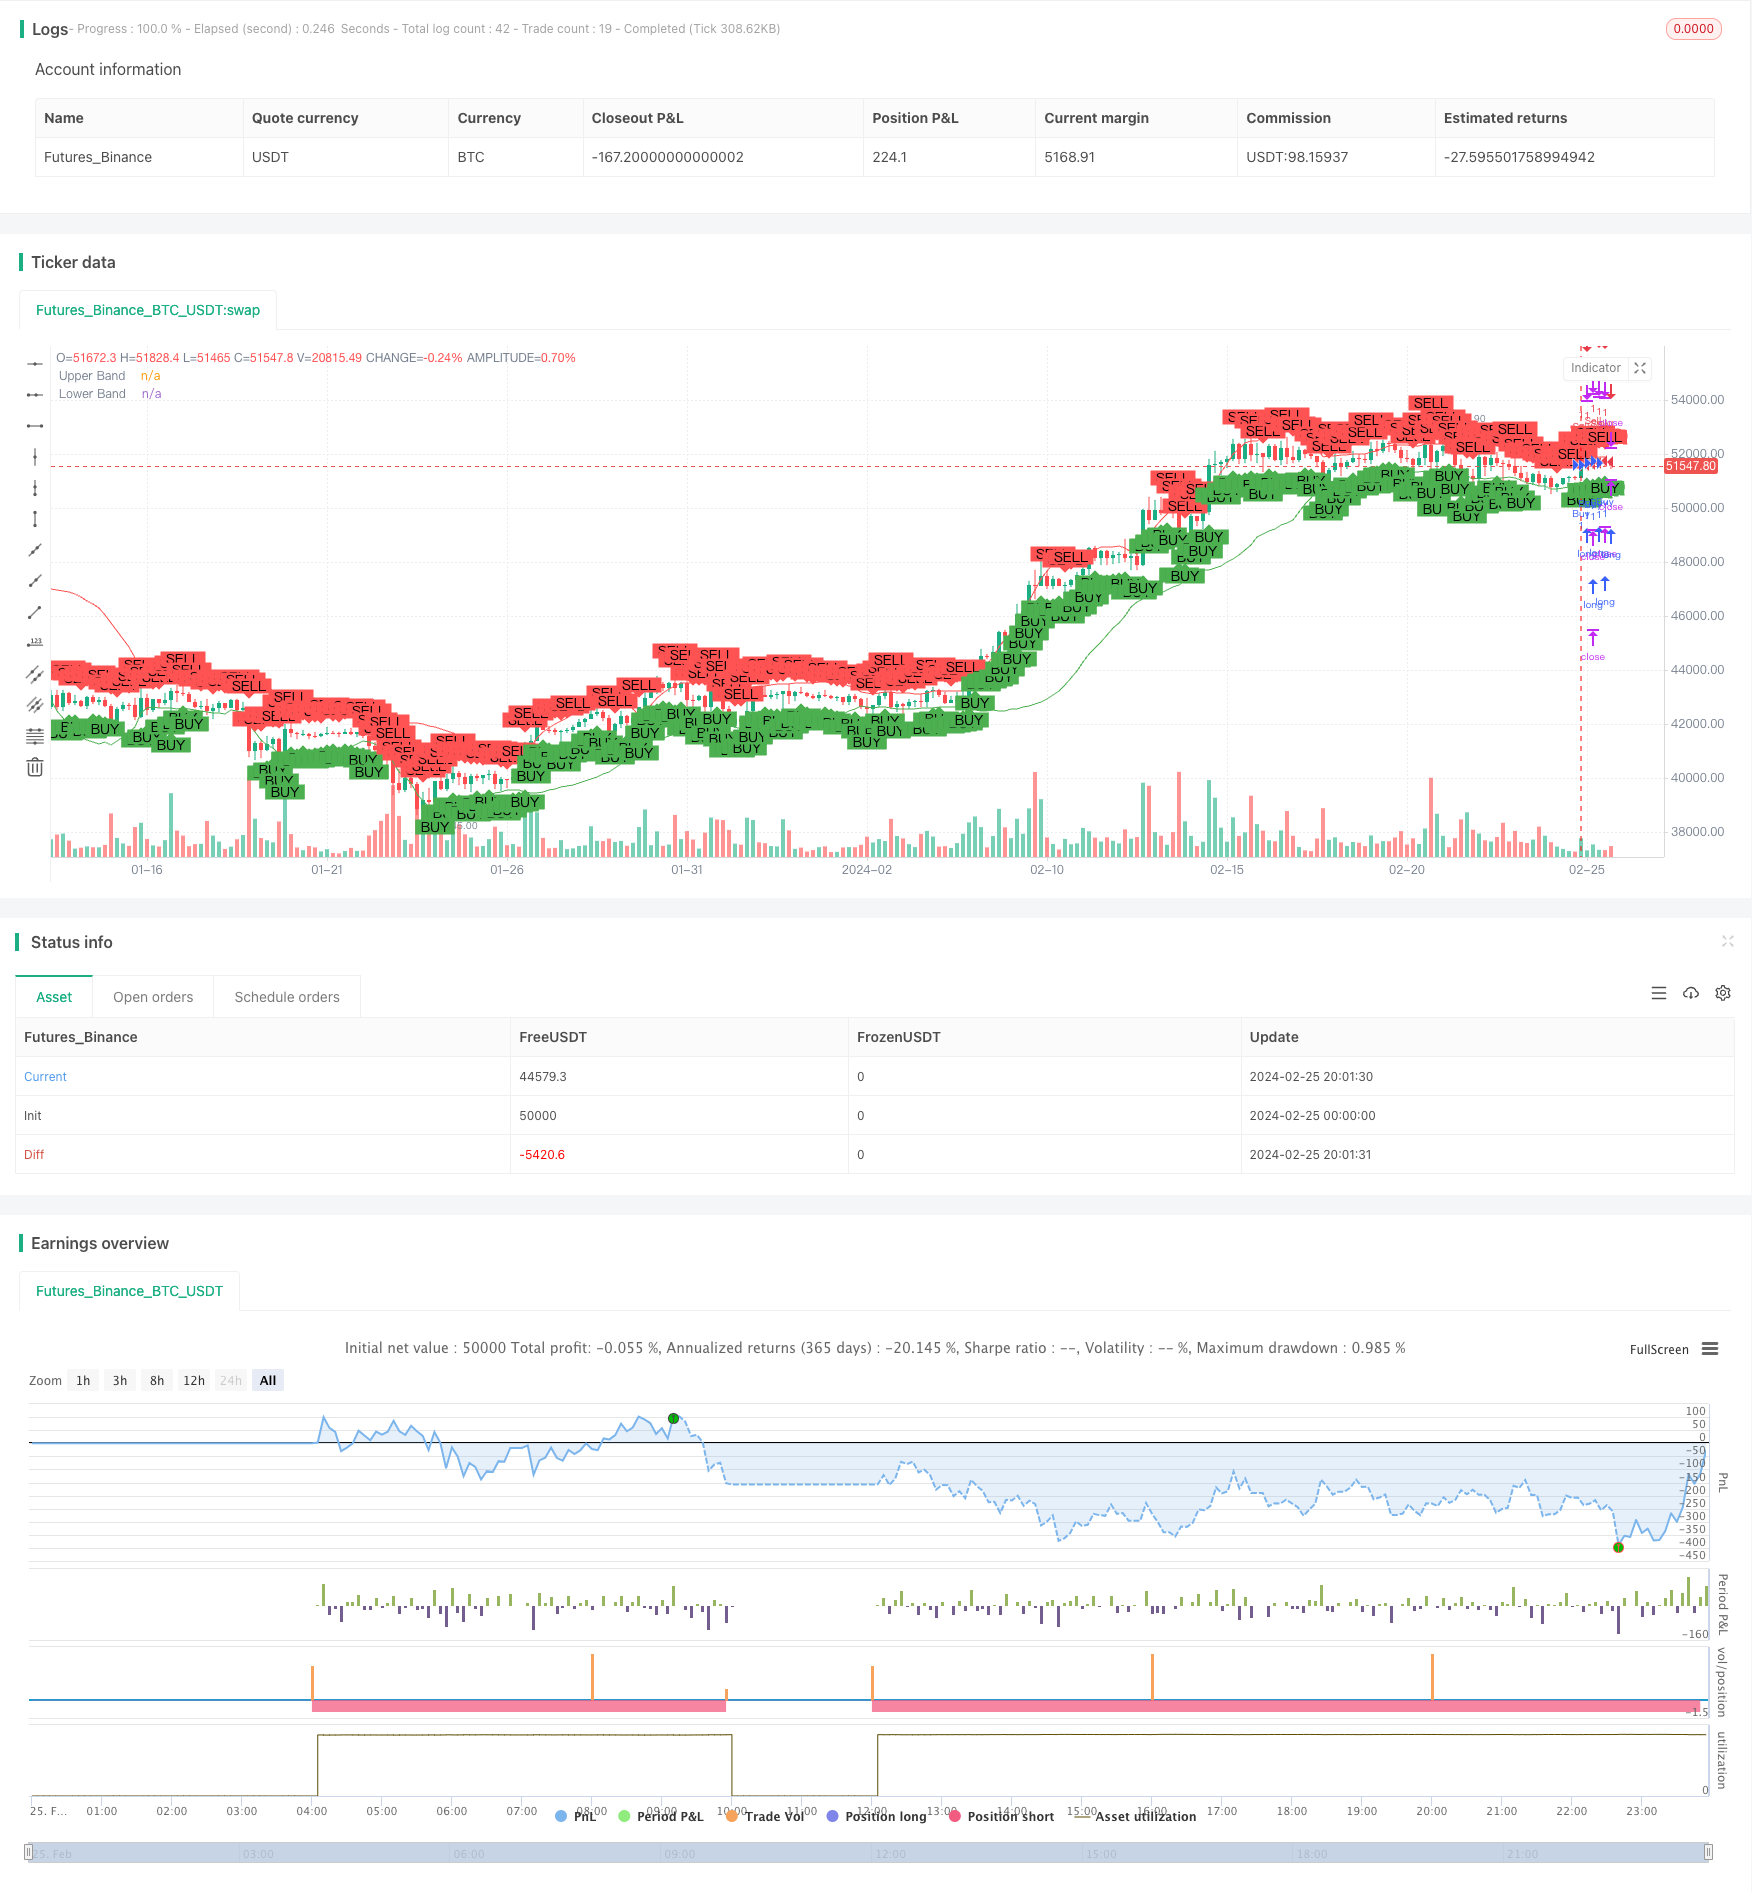 [trans]
Overview
The Bollinger Bands Breakout Trend Trading Strategy is designed to identify potential trend reversals at extreme price levels relative to recent volatility. It combines Bollinger Bands as a mean reversion indicator with breakout logic across the bands to catch the start of new trends.
Strategy Logic
The core strategy logic consists of the following components:
-
Bollinger Bands plotted as a 20-period EMA +/- 1.5 standard deviations to identify upper and lower bands.
-
Tracking when the price closes outside the Bollinger Bands 2 periods ago to anticipate potential reversals.
-
Entry signals triggered when the current bar breaks the high/low of the candle from 2 periods ago that closed beyond the opposite band.
-
Stop loss set just outside the high/low of the current bar.
-
Take profit based on predefined risk-reward ratio.
Advantages
The key advantages of this strategy are:
-
Bollinger Bands adapt to changing market volatility. Wider bands in volatile markets reduce likelihood of false signals.
-
Aiming to catch trend reversals early as price breaks back inside the bands.
-
Flexible risk management with adjustable risk-reward ratio input.
-
Robust backtesting results in trending markets with sustained directional moves.
-
Automated trade entry, exit and management once coded into a trading platform.
Risks
The main risks to consider:
-
Potential for whipsaw losses in range-bound non-trending markets.
-
Stop loss only accounts for current bar's range, so gaps can cause unwanted liquidations.
-
Difficult to evaluate performance without extensive backtesting across different market conditions.
-
Coding errors could lead to unintended order placement or trade management.
Risks can be mitigated through additional filters, evaluating performance in a robust manner and testing vigorously before live deployment.
Enhancements
Some ways in which this strategy could be enhanced:
-
Adding filters such as volume, RSI or MACD to improve timing and accuracy of signals.
-
Optimizing Bollinger Bands lengths or standard deviation multiples for specific instruments.
-
Using different risk-reward ratios per market based on backtest expectation.
-
Incorporating adaptive stops that trail price once profitable.
-
Building as an algorithm with automated walking of orders upon entry.
Careful optimization and security selection will be key to successfully implementing this strategy in live markets.
Conclusion
The Bollinger Bands Breakout Trend Trading Strategy offers a rules-based approach to entering into emerging trends across various markets. By combining adaptive bands that account for volatility and early breakout signals, it aims to capture moves as momentum accelerates. However, like all systematic strategies, it will require robust historical analysis and risk management to account for regime changes over market cycles.
||
概述
布林带趋势突破交易策略旨在识别相对于近期波动性的极端价格水平处的潜在趋势反转。它将布林带作为均值回归指标与穿越布林带的突破逻辑相结合,以捕捉新趋势的开始。
策略逻辑
该策略的核心逻辑由以下几个部分组成:
-
布林带绘制为20周期EMA+/- 1.5标准差以识别上下轨。
-
跟踪价格何时收盘高于或低于布林带的2周期前,以预测潜在反转。
-
当当前K线突破2周期前收盘于布林带另一侧的K线的最高价或最低价时,发出进场信号。
-
止损位设置在当前K线的最高价或最低价略外。
-
根据预定义的风险回报比确定止盈位。
优势
该策略的主要优势有:
-
布林带会自适应市场波动性变化。波动性较大时,布林带扩大,减少错误信号的可能性。
-
旨在提前捕捉价格重新进入布林带内的趋势反转。
-
可调整的风险回报比输入,提供灵活的风险管理。
-
在趋势行情中能够产生可观的回测结果。
-
一旦编码到交易平台,可以实现自动化入场、止损、止盈。
风险
需要考虑的主要风险:
-
在盘整行情中可能产生反复停损的损失。
-
止损仅基于当前K线范围,因此隙口可能造成意外的强制平仓。
-
没有广泛回测很难正确评估策略表现。
-
编码错误可能导致意外下单或交易风险。
可以通过添加过滤器、全面评估表现、在实盘之前进行充分测试来降低这些风险。
优化思路
可以通过以下几个方面来增强该策略:
-
添加成交量、RSI或MACD等过滤器来提高信号的准确性。
-
为特定品种优化布林带周期或标准差的倍数。
-
根据回测结果为不同市场设定不同的风险回报比。
-
整合跟踪止损以锁定盈利。
-
以算法形式实现,并自动完成订单管理。
通过精心的优化和品种选择,将是成功实施该策略的关键。
总结
布林带趋势突破交易策略提供了一套基于规则的方法来进入新兴趋势中。通过结合自适应波段和提前的突破信号,它旨在捕捉动量开始加速的行情。但是,与所有系统化策略一样,它都需要扎实的历史分析和风险管理,以应对市场周期中的制度变化。
[/trans]
Strategy Arguments
| Argument | Default | Description |
|---|---|---|
| v_input_1 | 3 | Risk-Reward Ratio |
Source (PineScript)
/*backtest
start: 2024-02-25 00:00:00
end: 2024-02-26 00:00:00
period: 4h
basePeriod: 15m
exchanges: [{"eid":"Futures_Binance","currency":"BTC_USDT"}]
*/

// This Pine Script™ code is subject to the terms of the Mozilla Public License 2.0 at https://mozilla.org/MPL/2.0/


//@version=5
strategy("Bollinger Band Strategy with Early Signal (v5)", overlay=true)

// Inputs
length = 20
mult = 1.5
src = close
riskRewardRatio = input(3.0, title="Risk-Reward Ratio")

// Calculating Bollinger Bands
basis = ta.ema(src, length)
dev = mult * ta.stdev(src, length)
upper = basis + dev
lower = basis - dev

// Plotting Bollinger Bands
plot(upper, "Upper Band", color=color.red)
plot(lower, "Lower Band", color=color.green)

// Tracking Two Candles Ago Crossing Bollinger Bands
var float twoCandlesAgoUpperCrossLow = na
var float twoCandlesAgoLowerCrossHigh = na

if (close[2] > upper[2])
    twoCandlesAgoUpperCrossLow := low[2]
if (close[2] < lower[2])
    twoCandlesAgoLowerCrossHigh := high[2]

// Entry Conditions
longCondition = (not na(twoCandlesAgoLowerCrossHigh)) and (high > twoCandlesAgoLowerCrossHigh)
shortCondition = (not na(twoCandlesAgoUpperCrossLow)) and (low < twoCandlesAgoUpperCrossLow)

// Plotting Entry Points
plotshape(longCondition, title="Buy Signal", location=location.belowbar, color=color.green, style=shape.labelup, text="BUY")
plotshape(shortCondition, title="Sell Signal", location=location.abovebar, color=color.red, style=shape.labeldown, text="SELL")

// Strategy Execution
if (longCondition)
    stopLoss = low - (high - low) * 0.05
    takeProfit = close + (close - stopLoss) * riskRewardRatio
    strategy.entry("Buy", strategy.long)
    strategy.exit("Exit Buy", "Buy", stop=stopLoss, limit=takeProfit)

if (shortCondition)
    stopLoss = high + (high - low) * 0.05
    takeProfit = close - (stopLoss - close) * riskRewardRatio
    strategy.entry("Sell", strategy.short)
    strategy.exit("Exit Sell", "Sell", stop=stopLoss, limit=takeProfit)
Detail
https://www.fmz.com/strategy/442979
Last Modified
2024-02-27 18:00:39