
7.5 KiB
Name
布林带突破股票策略Bollinger-Breakout-Stock-Strategy
Author
ChaoZhang
Strategy Description
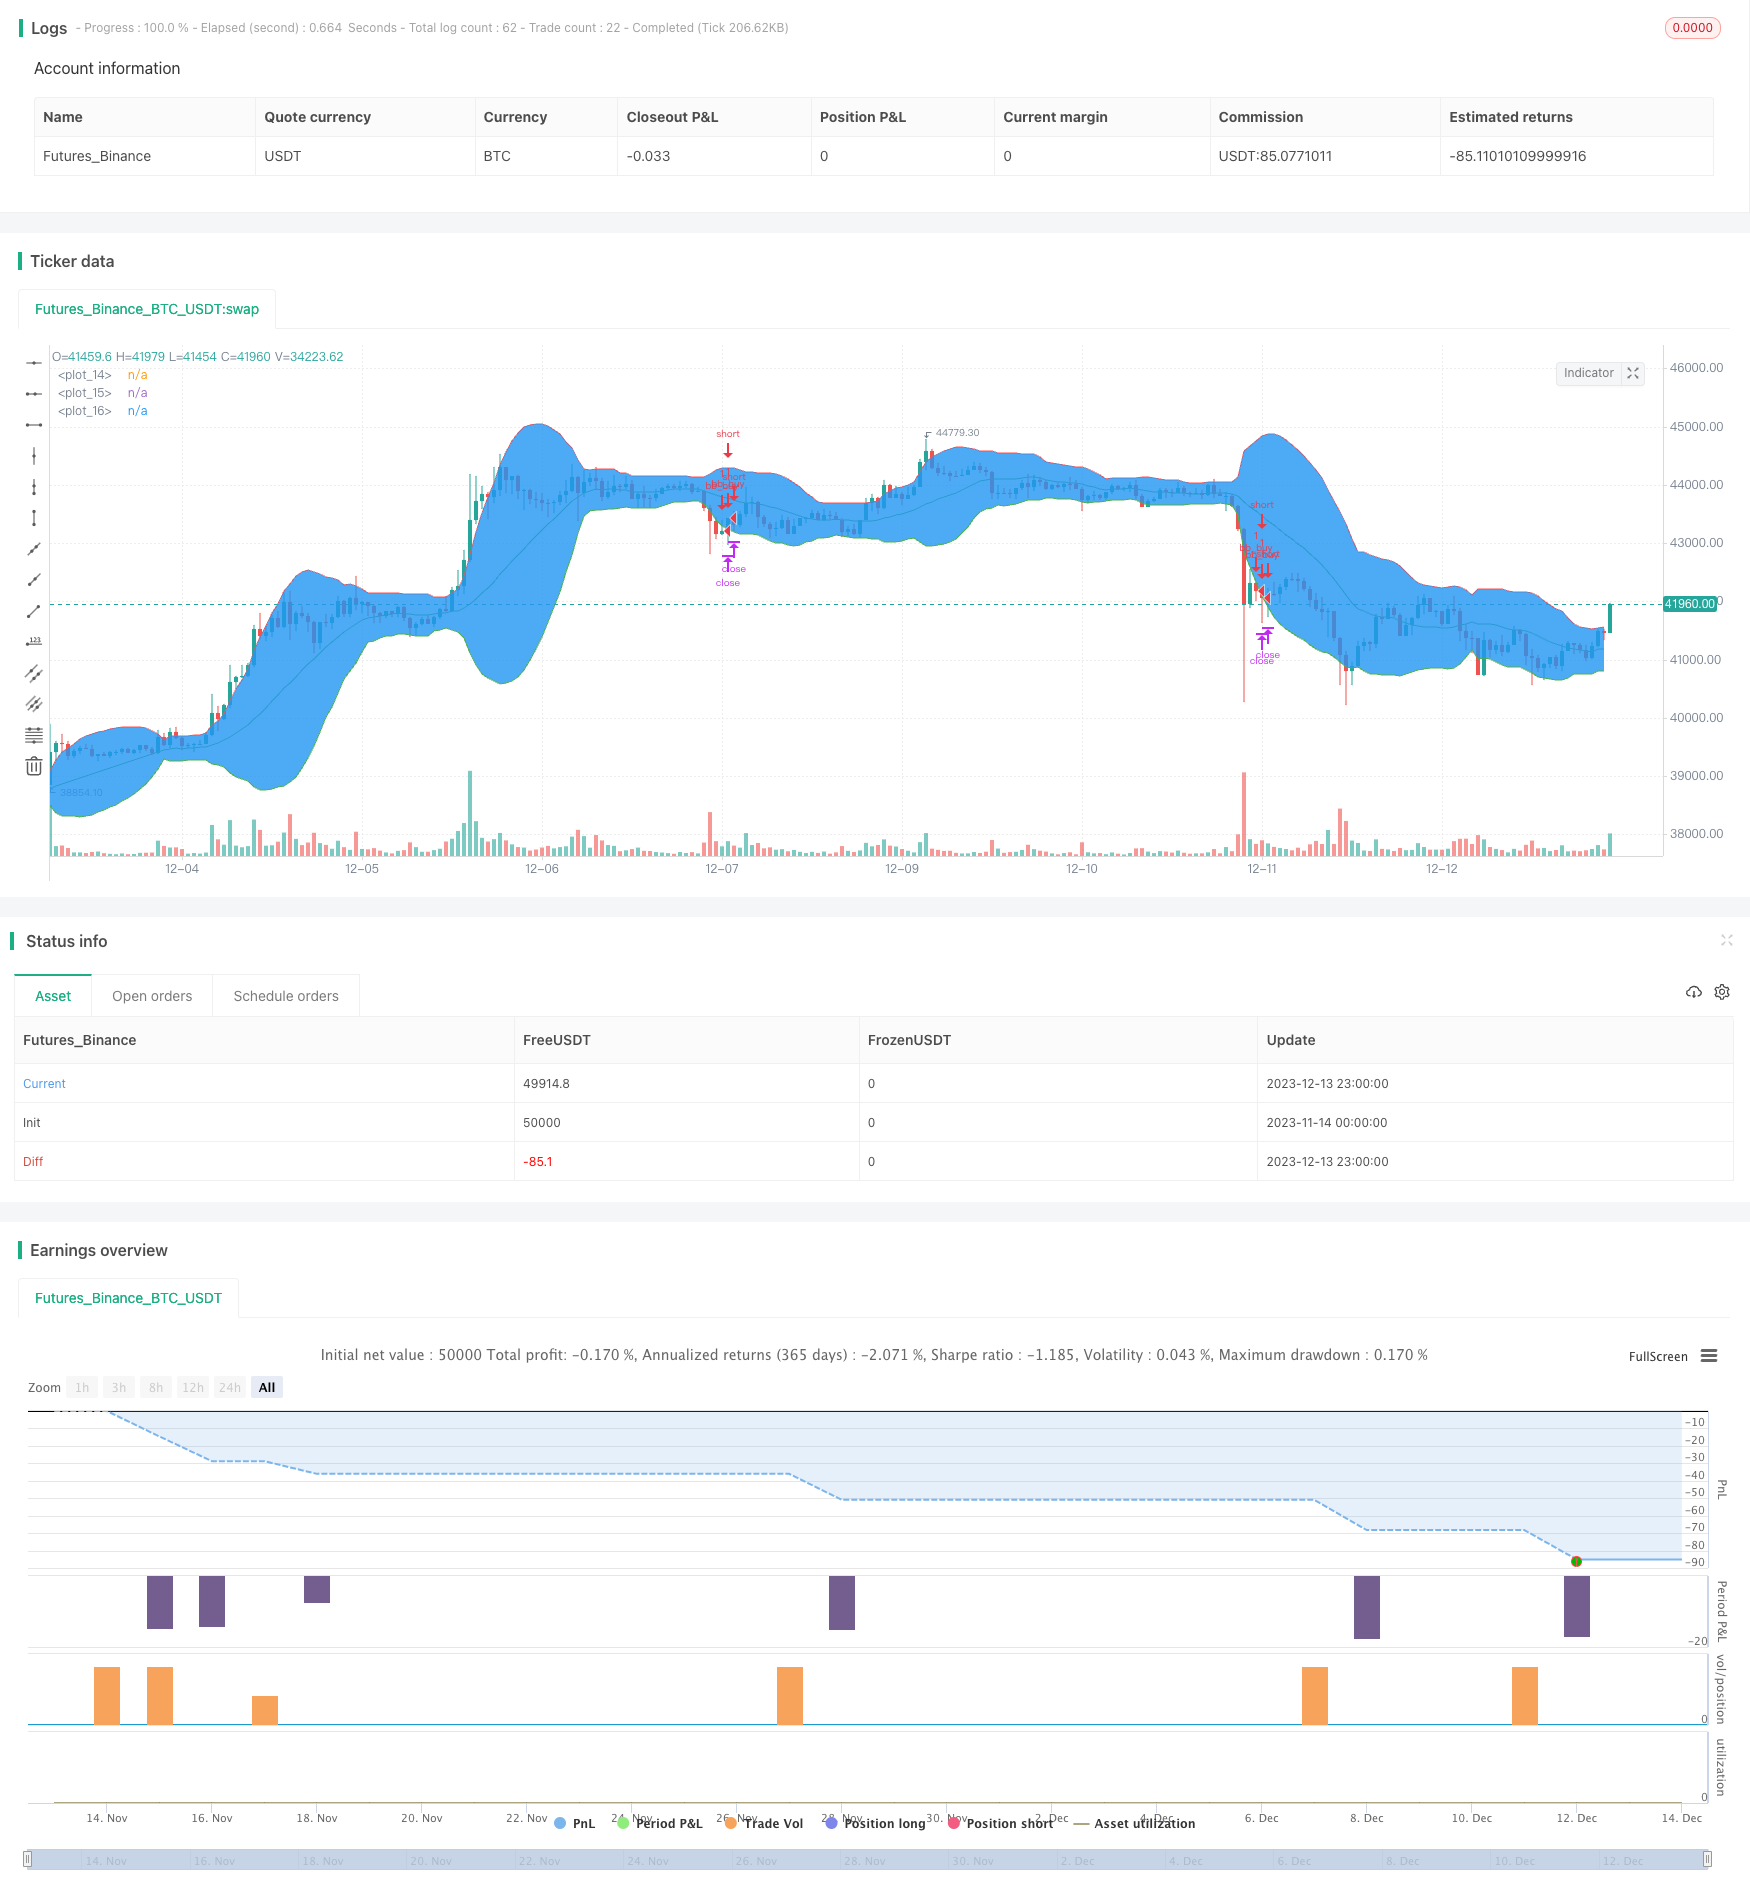
[trans]
概述
布林带突破股票策略是一种追踪股票价格波动的量化交易策略。它利用布林带指标判断价格是否离开正常波动范围,发出交易信号。当价格突破布林带下限时,作多入场;当价格突破布林带上限时,作空入场。该策略追踪股价短期趋势,适合短线操作。
策略原理
该策略使用20天的股票收盘价计算出中轨线、上轨线和下轨线。中轨线是20天收盘价的简单移动平均线;上下轨线分别是中轨线加减2倍标准差构成。 当股票收盘价突破下轨线时,认为股价脱离正常波动区间,开始新的上涨趋势,根据代码策略在此时做多入场。止损点为最近10根K线的最低点,止盈点为最近10根K线的最高点。 当股票收盘价突破上轨线时,认为股价脱离正常波动区间,开始新的下跌趋势,根据代码策略在此时做空入场。止损点为最近10根K线的最高点,止盈点为最近10根K线的最低点。 该策略简单有效地利用布林带指标判断价格趋势和波动范围,在价格可能反转时及早入场。
优势分析
该策略有以下主要优势:
-
使用布林带判断股价趋势变化点,高效捕捉短期趋势。
-
回撤风险较小,止损点设置在最近波动的低点,可以有效控制亏损。
-
止盈点设置在最近波动的高点,可以最大化捕捉单边趋势行情的利润。
-
策略思路简单清晰,容易理解和修改,适合量化交易初学者。
风险分析
该策略也存在一些风险:
-
布林带指标对波动性非常敏感,参数设置不当可能导致虚假信号。应适当调整参数比如周期数。
-
股票本身价格波动较大,止损点离场可能过早,无法持续追踪趋势。可以适当扩大波动范围止损。
-
突破信号发生滞后,可能出现资金浮盈过大。应结合其他指标判断提前入场。
-
市场不可预测,止盈止损难以把握,应适当结合人工经验调整参数。
优化方向
该策略可以从以下几个方向进一步优化:
-
结合其他指标确认入场信号,例如成交量突增等。
-
动态调整布林带参数,使之更好适应市场波动变化。
-
优化止盈止损策略,例如移动止损、分批止盈等。
-
测试不同股票品种参数效果,寻找最佳品种适用范围。
-
增加机器学习算法,自动优化参数设置。
总结
布林带突破策略整体思路清晰易懂,使用布林带指标判断股价反转点,回撤风险较小,可以捕捉短期单边行情。但也存在一定盈利上限和时间滞后的问题。该策略可以通过参数优化、止盈止损策略优化、增加其他辅助指标等方法进一步改进。总体而言,该策略适合短线操作股票,追踪股票中短期趋势。
||
Overview
The Bollinger breakout stock strategy is a quantitative trading strategy that tracks stock price fluctuations using Bollinger Bands to identify when prices break out of their normal volatility range and generate trade signals. It goes long when prices break below the lower Bollinger Band and goes short when prices break above the upper Bollinger Band. The strategy tracks short-term price trends and is suitable for short-term trading.
Strategy Logic
The strategy calculates the middle band, upper band and lower band using 20-day closing prices. The middle band is a 20-day simple moving average, while the upper and lower bands are placed at a distance of 2 standard deviations from the middle band.
When stock closing prices break below the lower band, it signals that prices have broken out of the normal volatility range and are starting a new uptrend. The strategy would go long at this point based on the code. The stop loss is set at the lowest low of the recent 10 bars, while take profit is set at the highest high of recent 10 bars.
When prices break above the upper band, it signals the start of a new downtrend. The strategy would go short here. Stop loss is the 10-bar highest level and take profit is the 10-bar lowest level.
The strategy effectively utilizes Bollinger Bands to identify trend changes and volatility range, entering early when prices are likely to reverse.
Advantage Analysis
The main advantages of this strategy are:
-
Effectively identifies trend change points using Bollinger Bands, catching short-term trends efficiently.
-
Smaller drawdown risk due to stop loss set at recent lowest swing low, which limits losses.
-
Take profit set at the recent highest level allows maximizing profits from one-sided trend moves.
-
Simple and clear logic, easy to understand and modify, suitable for quant trading beginners.
Risk Analysis
There are also some risks to consider:
-
Bollinger Bands are very sensitive to volatility changes, inappropriate parameters may cause false signals. Parameters like period should be adjusted accordingly.
-
High stock price fluctuations, stop loss triggered too early, unable to ride the trend. Can consider widening bands for stop loss.
-
Signal delay, may cause excessive unrealized profits. Other indicators can be added to identify earlier entries.
-
Market unpredictability makes take profit/stop loss difficult, manual intervention required to fine tune parameters.
Improvement Areas
Some ways to further improve the strategy:
-
Add other indicators to confirm signals, e.g. volume spike.
-
Dynamically adjust Bollinger parameters to fit changing volatility.
-
Enhance stop loss/take profit, e.g. trailing stop loss, staged profit taking.
-
Test parameters across different stocks to find best fit.
-
Introduce machine learning to auto optimize parameters.
Summary
The Bollinger breakout strategy has clear logic to identify reversals. Limited drawdown risk allows catching short-term trends. But also has profit target limitations and signal delay issues. Can be improved via parameter tuning, better stop loss/take profit, adding filters etc. Suitable for short-term stock trading to track medium-term trends.
[/trans]
Source (PineScript)
/*backtest
start: 2023-11-14 00:00:00
end: 2023-12-14 00:00:00
period: 1h
basePeriod: 15m
exchanges: [{"eid":"Futures_Binance","currency":"BTC_USDT"}]
*/

//@version=4

// Initial settings
strategy("Bulle de bollinger", overlay = true)

// Parameter Settings
mdl = sma(close, 20)
dev = stdev(close, 20)

upr = mdl + 2*dev
lwr = mdl - 2*dev

// Plot
plot(mdl, color = color.green) // Plot moving average
p1 = plot(upr, color = color.red) // Plot Upper_band
p2 = plot(lwr, color = color.green) // Plot lower band
fill(p1, p2, color = color.blue) // Fill transparant color between the 2 plots

// Strategy entry & close

if open[1] < lwr[1] and close[1] < lwr[1] // Previous price lower than lower band and current close is higher than lower band
    stop_level = lowest(10)
    profit_level = highest(10)
    strategy.entry(id = 'bb_buy', long = true)
    strategy.exit("TP/SL", "bb_buy", stop=stop_level, limit=profit_level)

if open[1] > upr[1] and close[1] > upr // Previous price is higher than higher band & current close is lower the higher band
    stop_level = highest(10)
    profit_level = lowest(10)
    //strategy.entry(id = 'bb_sell', long = false)
    //strategy.exit("TP/SL", "bb_sell", stop=stop_level, limit=profit_level)
Detail
https://www.fmz.com/strategy/435515
Last Modified
2023-12-15 16:20:57