
6.3 KiB
Name
布林带突破策略-Bollinger-Bands-Breakout-Strategy
Author
ChaoZhang
Strategy Description
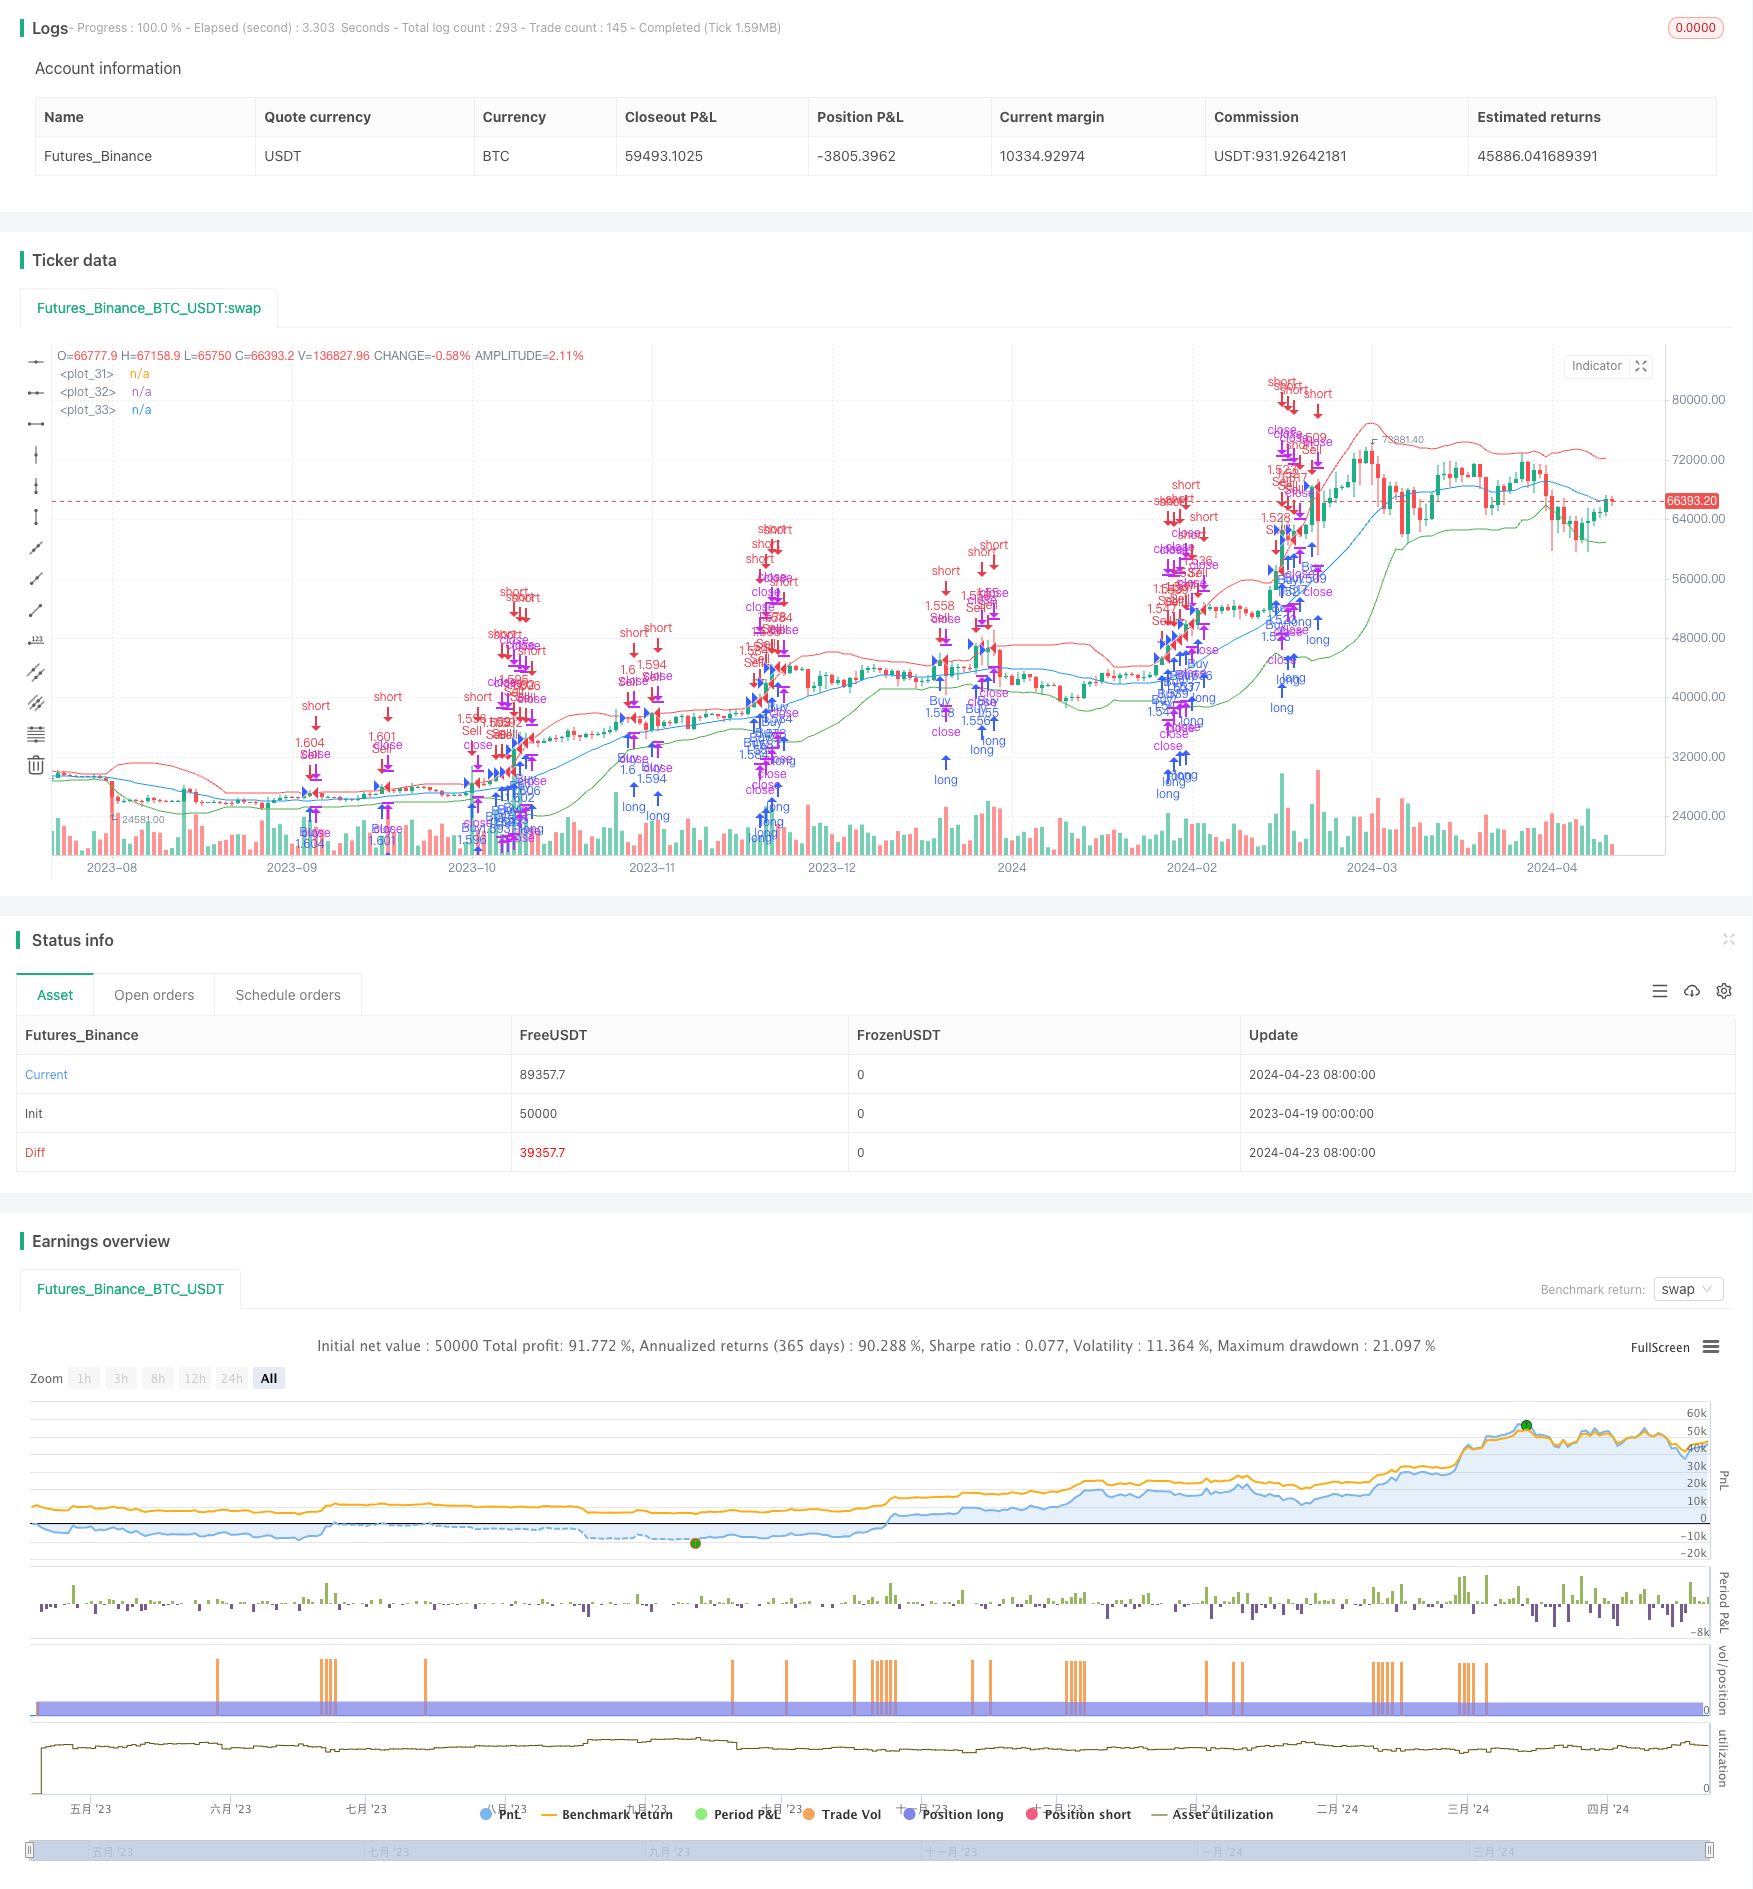
[trans]
概述
该策略利用布林带作为买卖信号,当价格突破下轨时买入,突破上轨时卖出。同时使用金字塔式加仓方式,当持仓数低于设定值时继续买入,高于设定值时卖出。该策略适用于有明显趋势的市场行情。
策略原理
- 计算布林带上轨、中轨和下轨。中轨为收盘价的简单移动平均线,上下轨为中轨加减收盘价标准差的倍数。
- 当收盘价低于或等于下轨时,产生买入信号;高于或等于上轨时,产生卖出信号。
- 若当前持仓数小于设定的金字塔加仓数,则继续买入;大于设定数则卖出。
- 在图表上绘制布林带的上中下轨。
策略优势
- 布林带能够量化价格的波动区间,提供明确的买卖信号,易于操作。
- 金字塔加仓方式能够放大趋势行情的收益。
- 布林带具有一定的趋势识别和风险控制能力,适合趋势交易者使用。
策略风险
- 当市场处于震荡行情时,频繁的买卖信号可能导致亏损。
- 金字塔加仓方式如果遇到趋势反转,放大了下跌风险。
- 布林带参数的选择需要根据不同市场和周期进行优化,不恰当的参数可能导致策略失效。
策略优化方向
- 可以结合其他指标如RSI、MACD等,对布林带信号进行二次确认,提高信号准确性。
- 对金字塔加仓的数量和比例进行控制,设置止损位置,降低下跌风险。
- 对布林带的参数如周期、倍数等进行优化测试,选择最佳参数组合。
- 在震荡市可以考虑使用布林带通道策略,在上下轨间进行高抛低吸。
总结
布林带突破策略利用价格相对布林带的位置产生趋势跟踪信号,同时通过金字塔加仓放大趋势收益。但在震荡市表现欠佳,并且金字塔加仓可能放大亏损。因此实际运用中需要结合其他指标验证信号,控制加仓风险,并对参数进行优化。同时要根据市场特点灵活调整策略。
||
Overview
This strategy uses Bollinger Bands as buy and sell signals. It buys when the price breaks below the lower band and sells when it breaks above the upper band. It also employs a pyramiding approach, continuing to buy when the number of open positions is below a set value and selling when above it. The strategy is suitable for market conditions with clear trends.
Strategy Principle
- Calculate the upper, middle, and lower Bollinger Bands. The middle band is the simple moving average of the closing price, while the upper and lower bands are the middle band plus or minus a multiple of the standard deviation of the closing price.
- When the closing price is less than or equal to the lower band, a buy signal is generated; when it is greater than or equal to the upper band, a sell signal is generated.
- If the current number of open positions is less than the set pyramiding number, continue buying; if greater than the set number, sell.
- Plot the upper, middle, and lower Bollinger Bands on the chart.
Strategy Advantages
- Bollinger Bands can quantify the volatility range of prices, provide clear buy and sell signals, and are easy to operate.
- The pyramiding approach can amplify the profitability of trend moves.
- Bollinger Bands have a certain ability to identify trends and control risk, making them suitable for trend traders.
Strategy Risks
- When the market is in a choppy condition, frequent buy and sell signals may lead to losses.
- If a trend reversal occurs, the pyramiding approach amplifies the downside risk.
- The selection of Bollinger Band parameters needs to be optimized for different markets and timeframes; inappropriate parameters may cause the strategy to fail.
Strategy Optimization Directions
- It can be combined with other indicators such as RSI, MACD, etc., to secondarily confirm Bollinger Band signals and improve signal accuracy.
- Control the quantity and proportion of pyramiding, set stop-loss positions, and reduce downside risk.
- Optimize and test Bollinger Band parameters such as period and multiple to select the best parameter combination.
- In choppy markets, consider using a Bollinger Band channel strategy to buy low and sell high between the upper and lower bands.
Summary
The Bollinger Bands Breakout strategy uses the position of the price relative to the Bollinger Bands to generate trend-following signals, while amplifying trend profits through pyramiding. However, it performs poorly in rangebound markets, and pyramiding may amplify losses. Therefore, in actual use, it needs to be combined with other indicators to verify signals, control pyramiding risks, and optimize parameters. At the same time, the strategy should be flexibly adjusted according to market characteristics.
[/trans]
Strategy Arguments
| Argument | Default | Description |
|---|---|---|
| v_input_1 | 20 | Bollinger Bands Length |
| v_input_2 | 2 | Multiplier |
| v_input_3 | 10 | Pyramiding |
Source (PineScript)
/*backtest
start: 2023-04-19 00:00:00
end: 2024-04-24 00:00:00
period: 1d
basePeriod: 1h
exchanges: [{"eid":"Futures_Binance","currency":"BTC_USDT"}]
*/

//@version=5
strategy("Bollinger Bands Breakout Strategy", overlay=true, initial_capital=100, default_qty_type=strategy.percent_of_equity, default_qty_value=100)

// Définition des paramètres
length = input(20, title="Bollinger Bands Length")
multiplier = input(2.0, title="Multiplier")
pyramiding = input(10, title="Pyramiding")

// Calcul des bandes de Bollinger
basis = ta.sma(close, length)
dev = multiplier * ta.stdev(close, length)
upper_band = basis + dev
lower_band = basis - dev

// Règles d'entrée
buy_signal = close <= lower_band
sell_signal = close >= upper_band
// Gestion des positions
if (buy_signal)
    strategy.entry("Buy", strategy.long)
if (sell_signal)
    strategy.entry("Sell", strategy.short)

// Pyramiding
if (strategy.opentrades < pyramiding)
    strategy.entry("Buy", strategy.long)
else if (strategy.opentrades > pyramiding)
    strategy.entry("Sell", strategy.short)

// Tracé des bandes de Bollinger
plot(basis, color=color.blue)
plot(upper_band, color=color.red)
plot(lower_band, color=color.green)
Detail
https://www.fmz.com/strategy/449497
Last Modified
2024-04-26 10:49:48