
10 KiB
Name
布林带突破回归交易策略Bollinger-Bands-Breakout-Reentry-Trading-Strategy
Author
ChaoZhang
Strategy Description
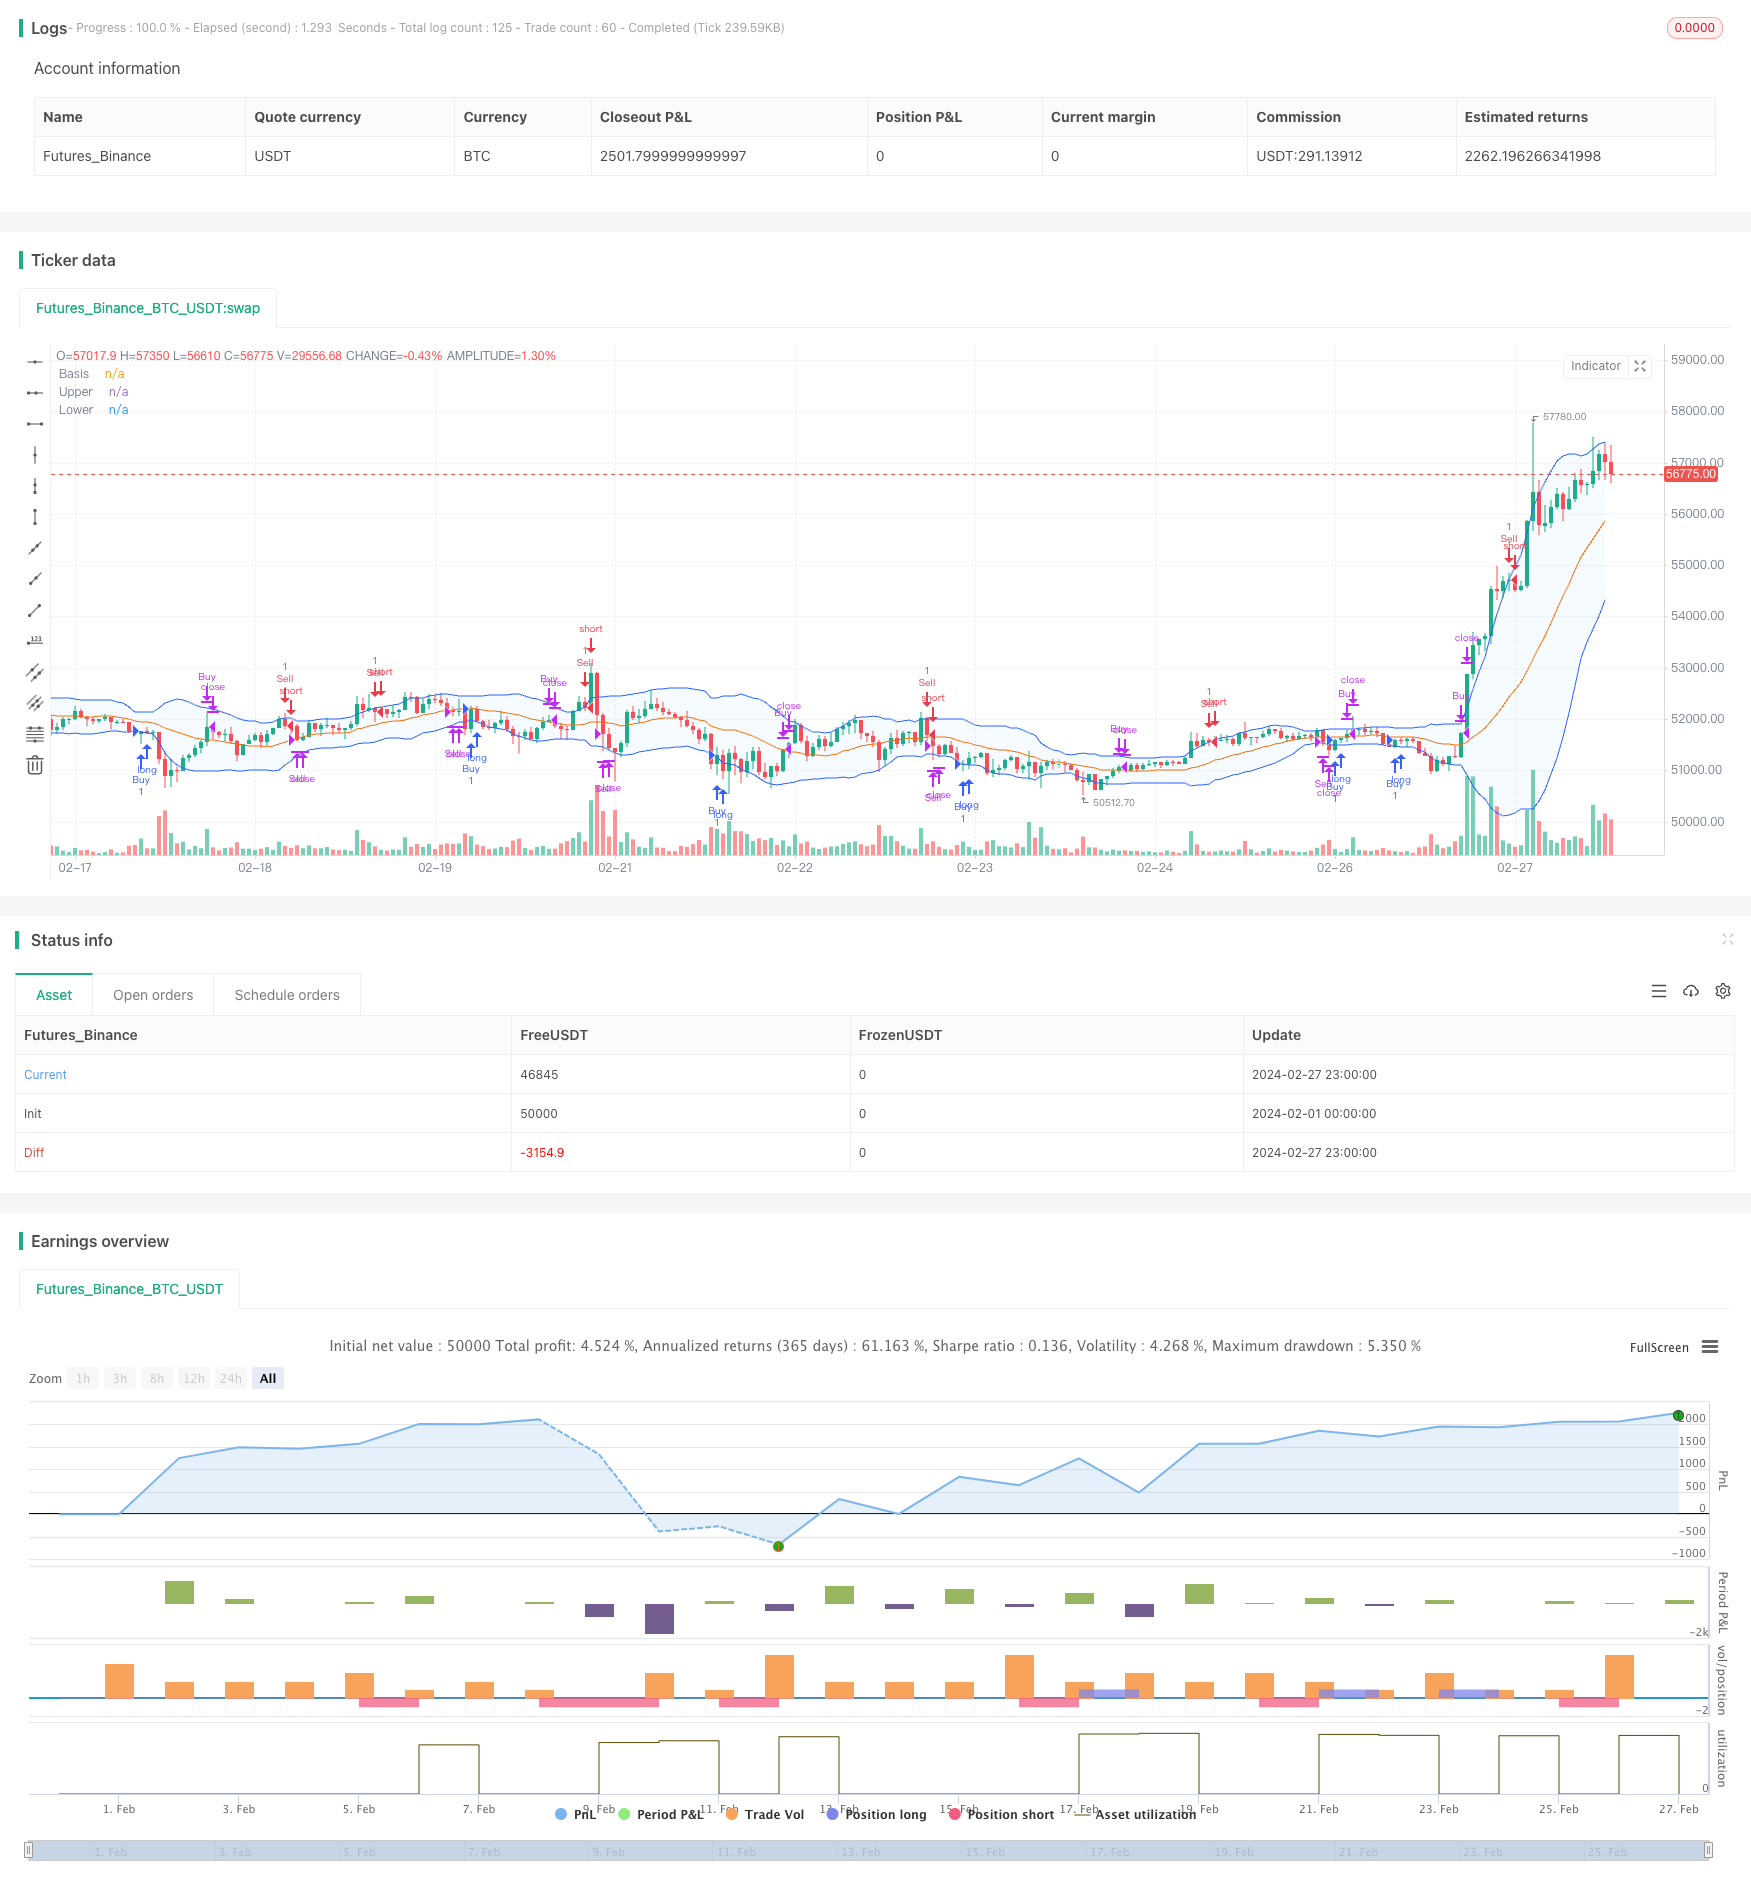 [trans]
概述
该策略基于布林带指标,主要思想是在价格突破布林带上轨或下轨后,等待价格回归到布林带内部,然后在回归点建立与突破方向相同的头寸。该策略利用了价格在极端区域往往会出现反转的特点,通过布林带突破和回归的组合条件来捕捉市场转折点,以期获得更高的胜率。
策略原理
- 计算布林带的中轨、上轨和下轨。中轨为移动平均线,上轨和下轨为中轨加减一定标准差。
- 判断价格是否突破布林带的上轨或下轨。如果收盘价超过上轨,则认为是向上突破;如果收盘价跌破下轨,则认为是向下突破。
- 如果发生向上突破,记录该突破K线的最高价为peak。如果发生向下突破,记录该突破K线的最低价为peak。peak用于后续判断价格是否回归。
- 在发生突破后,等待价格回归到布林带内部。如果此时收盘价位于上轨和下轨之间,则认为价格已经回归。
- 在价格回归时,如果前一根K线为向上突破(break_up[1] and inside),则开多头;如果前一根K线为向下突破(break_down[1] and inside),则开空头。
- 持仓管理:如果多头持仓时,收盘价上穿中轨,则平多;如果空头持仓时,收盘价下穿中轨,则平空。
优势分析
- 布林带有很强的自适应性,能够根据价格波动情况动态调整,对于捕捉趋势和波动很有帮助。
- 相比单纯的布林带突破策略,增加了回归条件,能够一定程度上避免追高杀跌,提高进场质量。
- 平仓条件以中轨为参考,简单易用,能够较好地保护利润。
- 可以自定义布林带的参数,如长度、偏差倍数等,灵活性高。
风险分析
- 布林带参数选择不当可能导致过早或过晚进场,影响策略表现。可以通过优化参数来缓解。
- 价格在布林带附近震荡时可能会出现频繁开平仓,导致交易成本增加。
- 如果趋势很强,价格长时间不回归布林带内部,可能会错失趋势利润。
- 单纯使用布林带指标可能对于某些品种或某些行情并不奏效,需要配合其他信号。
优化方向
- 可以考虑引入更多过滤条件,如价格在布林带上方运行一段时间后再突破更可靠,或者MA角度、ADX等趋势判断指标用于辅助判断。
- 针对震荡行情,可以增加限价单和计时器,避免盲目开仓。
- 平仓方面可以再结合ATR或均线,控制好出场时机。
- 对不同标的和周期进行参数优化和特征分析,选择适合的交易标的和周期。
- 可以考虑加入仓位管理,如波动率收缩时加大仓位,波动率放大时减少仓位。
总结
布林带突破回归交易策略是一个简单实用的量化交易策略。它利用价格对极端情况的反应,通过布林带工具构建开平仓条件,能够在一定程度上捕捉趋势起始点和终结点,控制频繁交易。同时该策略也存在参数选择、震荡行情下表现不佳、对趋势把握不足等问题。通过细节的优化以及与其他信号的结合,有望进一步提升该策略的适应性和鲁棒性。
||
Overview
This strategy is based on the Bollinger Bands indicator. The main idea is to wait for the price to re-enter the Bollinger Bands after breaking out of the upper or lower band, and then establish a position in the same direction as the breakout at the re-entry point. The strategy takes advantage of the characteristic that prices often reverse when they are in extreme areas. By combining the conditions of Bollinger Band breakout and re-entry, it aims to capture market turning points and achieve a higher win rate.
Strategy Principles
- Calculate the middle, upper, and lower bands of the Bollinger Bands. The middle band is the moving average, and the upper and lower bands are the middle band plus or minus a certain number of standard deviations.
- Determine if the price breaks out of the upper or lower Bollinger Band. If the closing price exceeds the upper band, it is considered an upward breakout; if the closing price falls below the lower band, it is considered a downward breakout.
- If an upward breakout occurs, record the highest price of that breakout candle as the peak. If a downward breakout occurs, record the lowest price of that breakout candle as the peak. The peak is used to determine if the price has re-entered later.
- After a breakout occurs, wait for the price to re-enter inside the Bollinger Bands. If the closing price is between the upper and lower bands at this time, the price is considered to have re-entered.
- When the price re-enters, if the previous candle was an upward breakout (break_up[1] and inside), go long; if the previous candle was a downward breakout (break_down[1] and inside), go short.
- Position management: If in a long position and the closing price crosses above the middle band, close the long position; if in a short position and the closing price crosses below the middle band, close the short position.
Advantage Analysis
- Bollinger Bands have strong adaptability and can dynamically adjust according to price fluctuations, which is helpful for capturing trends and volatility.
- Compared to a simple Bollinger Band breakout strategy, adding the re-entry condition can avoid chasing highs and selling lows to a certain extent and improve entry quality.
- The exit condition uses the middle band as a reference, which is simple and easy to use, and can protect profits relatively well.
- The parameters of the Bollinger Bands, such as length and deviation multiplier, can be customized, providing high flexibility.
Risk Analysis
- Improper selection of Bollinger Band parameters may lead to premature or late entries, affecting the strategy's performance. This can be mitigated by optimizing the parameters.
- When the price oscillates near the Bollinger Bands, frequent opening and closing of positions may occur, resulting in increased transaction costs.
- If the trend is very strong and the price does not re-enter the Bollinger Bands for a long time, trend profits may be missed.
- Using the Bollinger Band indicator alone may not be effective for some instruments or market conditions, and it may need to be used in conjunction with other signals.
Optimization Directions
- Consider introducing more filtering conditions. For example, a breakout may be more reliable if the price has been running above the Bollinger Bands for a period of time, or use trend determination indicators such as MA angle and ADX for assistance.
- For oscillating markets, limit orders and timers can be added to avoid blind entries.
- For exits, ATR or moving averages can be further combined to control the exit timing.
- Perform parameter optimization and characteristic analysis for different underlying assets and timeframes to select suitable trading targets and timeframes.
- Consider adding position management, such as increasing position size when volatility contracts and reducing position size when volatility expands.
Summary
The Bollinger Bands Breakout Reentry Trading Strategy is a simple and practical quantitative trading strategy. It utilizes the reaction of prices to extreme situations and constructs entry and exit conditions through the Bollinger Bands tool, which can capture trend starting and ending points to a certain extent and control frequent trading. At the same time, this strategy also has issues such as parameter selection, poor performance in oscillating markets, and insufficient trend capture. Through optimization of details and combination with other signals, it is expected to further improve the adaptability and robustness of this strategy. [/trans]
Strategy Arguments
| Argument | Default | Description |
|---|---|---|
| v_input_int_1 | 20 | length |
| v_input_string_1 | 0 | Basis MA Type: SMA |
| v_input_1_close | 0 | Source: close |
| v_input_float_1 | 1.7 | StdDev |
| v_input_int_2 | false | Offset |
Source (PineScript)
/*backtest
start: 2024-02-01 00:00:00
end: 2024-02-27 23:59:59
period: 1h
basePeriod: 15m
exchanges: [{"eid":"Futures_Binance","currency":"BTC_USDT"}]
*/

//@version=5
strategy(shorttitle="BB", title="Bollinger Bands", overlay=true)
length = input.int(20, minval=1)
maType = input.string("SMA", "Basis MA Type", options = ["SMA", "EMA", "SMMA (RMA)", "WMA", "VWMA"])
src = input(close, title="Source")
mult = input.float(1.7, minval=0.001, maxval=50, title="StdDev")

ma(source, length, _type) =>
    switch _type
        "SMA" => ta.sma(source, length)
        "EMA" => ta.ema(source, length)
        "SMMA (RMA)" => ta.rma(source, length)
        "WMA" => ta.wma(source, length)
        "VWMA" => ta.vwma(source, length)

basis = ma(src, length, maType)
dev = mult * ta.stdev(src, length)
upper = basis + dev
lower = basis - dev
offset = input.int(0, "Offset", minval = -500, maxval = 500)
plot(basis, "Basis", color=#FF6D00, offset = offset)
p1 = plot(upper, "Upper", color=#2962FF, offset = offset)
p2 = plot(lower, "Lower", color=#2962FF, offset = offset)
fill(p1, p2, title = "Background", color=color.rgb(33, 150, 243, 95))

break_up = close > upper
break_down = close < lower
inside = close > lower and close < upper

sell_condition = break_up[1] and inside
buy_condition = break_down[1] and inside

// Conditions to close trades
close_sell_condition = close > basis
close_buy_condition = close < basis

trade_condition = sell_condition or buy_condition

// Tracking the high of the breakout candle
var float peak = na

if (not trade_condition)
    peak := close
if (break_up and peak < high)
    peak := high
if (break_down and peak > low)
    peak := low

// Entering positions
if (buy_condition)
    strategy.entry("Buy", strategy.long)
if (sell_condition)
    strategy.entry("Sell", strategy.short)

// Exiting positions when close crosses the basis
if (strategy.position_size > 0 and close_sell_condition) // If in a long position and close crosses above basis
    strategy.close("Buy")
if (strategy.position_size < 0 and close_buy_condition) // If in a short position and close crosses below basis
    strategy.close("Sell")
Detail
https://www.fmz.com/strategy/443985
Last Modified
2024-03-08 14:08:53