
14 KiB
Name
布林带百分比交易策略Bollinger-Percentage-Bands-Trading-Strategy
Author
ChaoZhang
Strategy Description
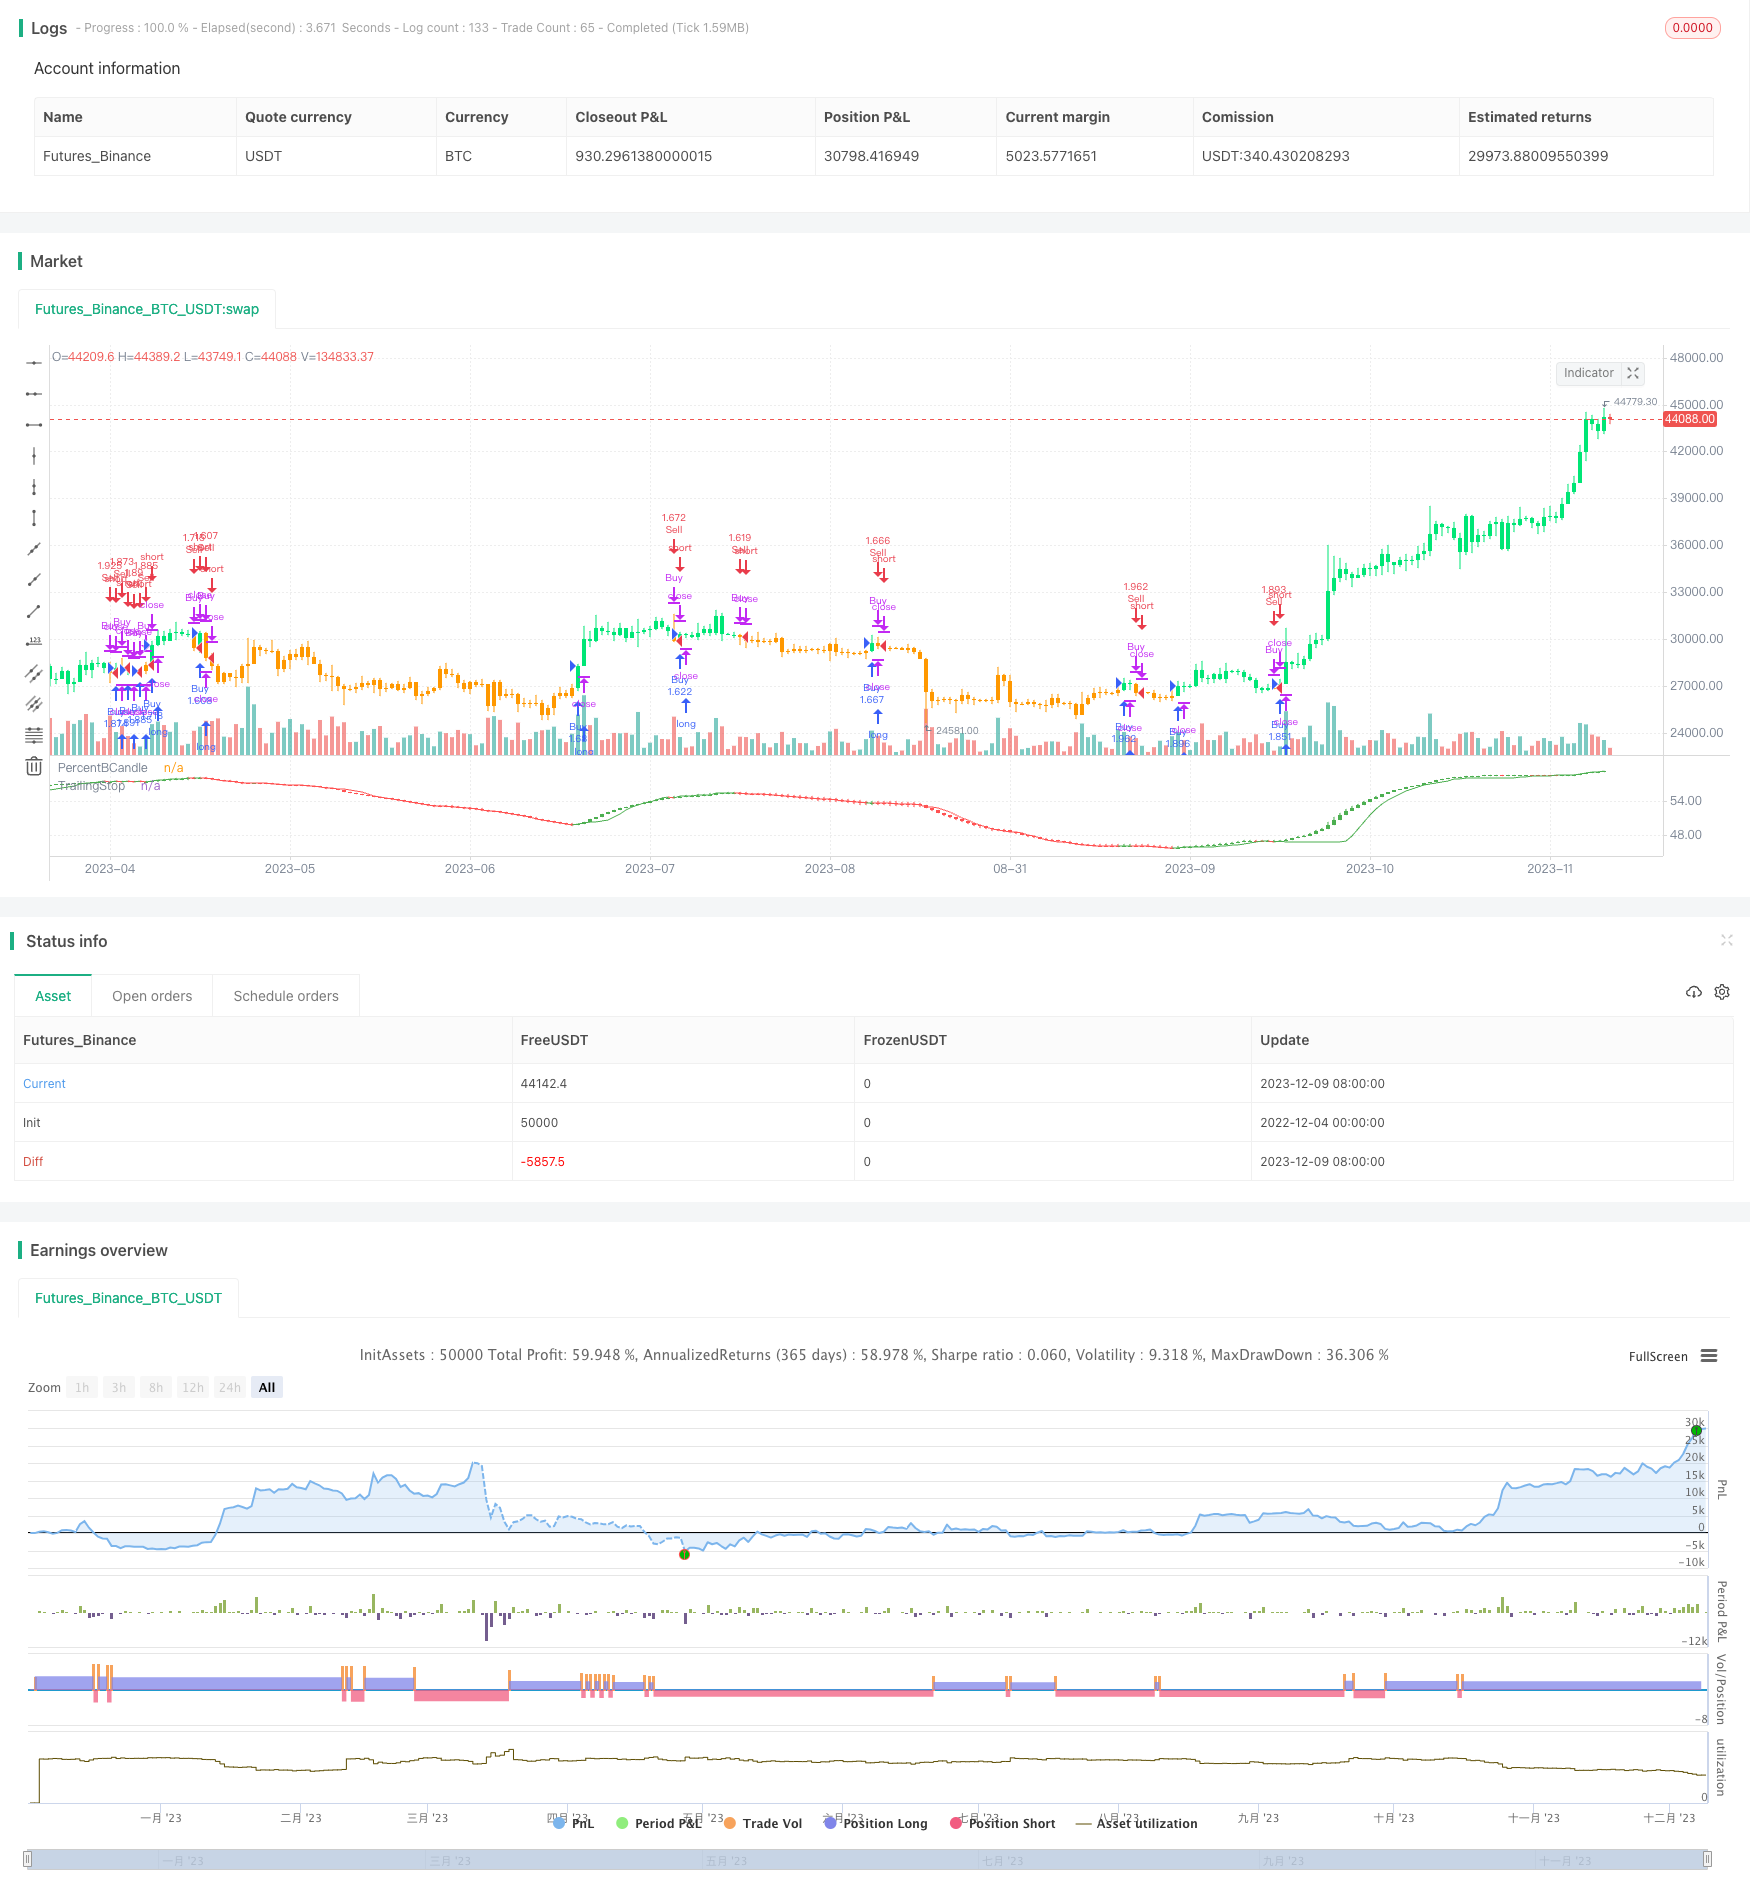 [trans]
概述
该策略基于布林带指标,结合移动平均线和ATR技术指标,实现了一个短周期的突破系统。策略通过计算布林带通道内价格的相对位置百分比,来判断价格的超买超卖情况,结合新的高低点突破来产生交易信号。
策略原理
- 计算布林带通道及价格在通道内的相对位置百分比
- 对开盘价、收盘价、最高价、最低价分别计算移动平均线
- 计算ATR指标,并结合ATR设定止损线
- 判断价格是否处于新高或新低点附近
- 结合年度最高最低价判断大级别行情
- 通过布林带百分比变化和新高新低判断是否发出交易信号
该策略使用布林带通道判断市场波动率,布林带通道宽度通过标准差确定。价格从布林带下轨突破时为买点,价格从布林带上轨突破时为卖点。移动平均线可平滑布林带波动,减少假突破。ATR指标与移动止损线结合,固定止损幅度。新高新低判断可避免追顶跌破。年度高低判断可排除大级别横盘整理。总体来说,该策略综合运用多种技术分析工具判断市场节奏和入场时机。
策略优势
- 严格的布林带通道突破判断,可减少假信号
- 移动平均线平滑价格,识别真正趋势
- ATR指标动态跟踪止损,可限制单笔损失
- 新高新低和年度高低判断,使信号更可靠
- 多种技术指标有效结合,提高策略效率
策略风险及解决方法
- 布林带通道参数设置不当可能导致过多假突破,应测试不同参数组合以取得最佳效果
- 收盘价为基准线可能出现回撤超过ATR设定的止损幅度,可考虑使用更大波幅的最高最低价计算百分比
- 严格的布林带过滤可能错过较长线上的趋势机会,宜适当放宽过滤条件和持仓时间
- ATR指标较慢跟踪大幅价格波动,应考虑更高频的波动率指标如真实波幅等
- 新高新低突破容易受到短期噪声的干扰,应评估统计显著性和趋势可持续性
策略优化方向
- 测试不同参数组合判断最佳布林带参数和移动平均线长度
- 采用模型组合结合不同布林带参数或移动平均线判断信号
- 测试不同时间段及不同品种参数适配性,提高稳健性
- 结合更多大级别条件判断,如日线级别布林带信号或季节性因素
- 评估趋势跟随型机会,以扩大策略覆盖面和盈利空间
总结
该策略综合运用布林带百分比、移动平均线、ATR指标、新高新低和年度高低等多种技术工具,在短周期上搭建了一个相对严格和高效的突破交易策略。其突出优势在于利用各类工具来减少噪声,识别真正的趋势信号。当然策略也存在一定的参数设定难度和严格条件下错失机会的可能。总体上是一种拥有独特交易风格和突出效率的布林带突破策略,值得进一步研究和基于实盘数据的验证。
||
Overview
This strategy is based on the Bollinger Bands indicator, combined with moving averages and the ATR technical indicator, to implement a short-term breakout system. The strategy calculates the relative percentage position of prices within the Bollinger Bands channel to judge overbought and oversold situations, combined with new highs and lows breakouts to generate trading signals.
Strategy Logic
- Calculate Bollinger Bands channel and the relative percentage position of prices within the channel
- Calculate moving averages separately for open, close, high and low prices
- Calculate ATR indicator and set stop loss lines combined with ATR
- Judge whether prices are near new highs or new lows
- Combine yearly highs and lows to judge bigger timeframe trends
- Generate trading signals based on changes in Bollinger Bands percentage and new highs/lows
This strategy uses Bollinger Bands channel to judge market volatility, with channel width determined by standard deviation. Buy signals are generated when prices break below the lower band, and sell signals when prices break above the upper band. Moving averages can smooth out Bollinger fluctuations and reduce false breakouts. ATR indicator combines with trailing stop loss to fix stop loss scale. New highs/lows help avoid chasing tops and limit downside. Yearly highs/lows filter out bigger timeframe consolidation. In summary, this strategy combines various technical analysis tools to judge market rhythm and entry timing.
Advantages
- Strict Bollinger Bands breakout filters help reduce false signals
- Moving averages smooth prices and identify true trends
- ATR indicator dynamically trails stop loss and limits single trade loss
- New highs/lows and yearly highs/lows make signals more reliable
- Effective combination of multiple indicators improves efficiency
Risks and Solutions
- Improper Bollinger Bands parameters may cause excessive false breakouts, different parameter combinations should be tested for best results
- Closing price reference may lead to drawdowns exceeding ATR-set stop loss range, consider using more volatile high/low prices for percentage calculation
- Strict Bollinger filtering may miss some longer-term trend opportunities, appropriately relax filters and holding period
- ATR indicator trails large price swings slowly, consider higher frequency volatility measures like true range
- New highs/lows breakouts are easily disturbed by short-term noise, evaluate statistical significance and trend sustainability
Optimization Directions
- Test different parameter combinations to determine optimal Bollinger parameters and moving average lengths
- Employ model combination incorporating different Bollinger parameters or moving averages
- Test robustness across different timeframes and products, improve adaptiveness
- Incorporate more higher timeframe signals like daily Bollinger signals or seasonal factors
- Evaluate trend-following opportunities to expand strategy coverage and profitability
Conclusion
This strategy effectively combines Bollinger percentage bands, moving averages, ATR indicator, new highs/lows and yearly highs/lows to construct a relatively strict and efficient short-term breakout trading system. Its outstanding advantage lies in using various tools to reduce noise and identify true trend signals. Of course the strategy also faces some parameter tuning difficulties and missed opportunities under strict conditions. Overall it represents a unique trading style and high-efficiency Bollinger breakout strategy that warrants further research and validation on real trading data.
[/trans]
Strategy Arguments
| Argument | Default | Description |
|---|---|---|
| v_input_1 | 100 | BBLength |
| v_input_2 | true | useMovingAverage |
| v_input_3 | 0 | Moving Average Type: rma |
| v_input_4 | 22 | lookbackPeriod |
| v_input_5 | true | colorByPreviousClose |
| v_input_6 | 0 | Moving Average Type: hma |
| v_input_7 | 10 | AtrLength |
| v_input_8 | 4 | AtrMult |
| v_input_9 | false | wicks |
| v_input_10 | false | considerYearlyHighLow |
| v_input_11 | false | considerNewLongTermHighLows |
| v_input_12 | 0 | Trade Direction: strategy.direction.all |
| v_input_13 | 10 | backtestYears |
Source (PineScript)
/*backtest
start: 2022-12-04 00:00:00
end: 2023-12-10 00:00:00
period: 1d
basePeriod: 1h
exchanges: [{"eid":"Futures_Binance","currency":"BTC_USDT"}]
*/

// This source code is subject to the terms of the Mozilla Public License 2.0 at https://mozilla.org/MPL/2.0/
// © HeWhoMustNotBeNamed

//@version=4
strategy("Bollinger %B Candles Strategy", overlay=false, initial_capital = 1000, default_qty_type = strategy.percent_of_equity, default_qty_value = 100, commission_type = strategy.commission.percent, pyramiding = 1, commission_value = 0.01, calc_on_order_fills = true)

BBLength = input(100, minval=1, step=1)
StdDev = 10
useMovingAverage = input(true)
MAType = input(title="Moving Average Type", defval="rma", options=["ema", "sma", "hma", "rma", "vwma", "wma"])
lookbackPeriod = input(22, minval=10, step=10)
colorByPreviousClose = input(true)

AtrMAType = input(title="Moving Average Type", defval="hma", options=["ema", "sma", "hma", "rma", "vwma", "wma"])
AtrLength = input(10)
AtrMult = input(4)
wicks = input(false)

considerYearlyHighLow = input(false)
considerNewLongTermHighLows = input(false)
shortHighLowPeriod = 100
longHighLowPeriod = 200
tradeDirection = input(title="Trade Direction", defval=strategy.direction.all, options=[strategy.direction.all, strategy.direction.long, strategy.direction.short])

backtestYears = input(10, minval=1, step=1)


//////////////////////////////////// Calculate new high low condition //////////////////////////////////////////////////
f_calculateNewHighLows(shortHighLowPeriod, longHighLowPeriod, considerNewLongTermHighLows)=>
    newHigh = highest(shortHighLowPeriod) == highest(longHighLowPeriod) or not considerNewLongTermHighLows
    newLow = lowest(shortHighLowPeriod) == lowest(longHighLowPeriod) or not considerNewLongTermHighLows
    [newHigh,newLow]

//////////////////////////////////// Calculate Yearly High Low //////////////////////////////////////////////////
f_getYearlyHighLowCondition(considerYearlyHighLow)=>
    yhigh = security(syminfo.tickerid, '12M', high[1])
    ylow = security(syminfo.tickerid, '12M', low[1])
    yhighlast = yhigh[365]
    ylowlast = ylow[365]
    yhighllast = yhigh[2 * 365]
    ylowllast = ylow[2 * 365]

    yearlyTrendUp = na(yhigh)? true : na(yhighlast)? close > yhigh : na(yhighllast)? close > max(yhigh,yhighlast) : close > max(yhigh, min(yhighlast, yhighllast))
    yearlyHighCondition = (  (na(yhigh) or na(yhighlast) ? true : (yhigh > yhighlast) ) and ( na(yhigh) or na(yhighllast) ? true : (yhigh > yhighllast))) or yearlyTrendUp or not considerYearlyHighLow
    yearlyTrendDown = na(ylow)? true : na(ylowlast)? close < ylow : na(ylowllast)? close < min(ylow,ylowlast) : close < min(ylow, max(ylowlast, ylowllast))
    yearlyLowCondition = (  (na(ylow) or na(ylowlast) ? true : (ylow < ylowlast) ) and ( na(ylow) or na(ylowllast) ? true : (ylow < ylowllast))) or yearlyTrendDown or not considerYearlyHighLow

    label_x = time+(60*60*24*1000*1)
    [yearlyHighCondition,yearlyLowCondition]

f_getMovingAverage(source, MAType, length)=>
    ma = sma(source, length)
    if(MAType == "ema")
        ma := ema(source,length)
    if(MAType == "hma")
        ma := hma(source,length)
    if(MAType == "rma")
        ma := rma(source,length)
    if(MAType == "vwma")
        ma := vwma(source,length)
    if(MAType == "wma")
        ma := wma(source,length)
    ma

inDateRange = true
[yearlyHighCondition,yearlyLowCondition] = f_getYearlyHighLowCondition(considerYearlyHighLow)
[newHighS,newLowS] = f_calculateNewHighLows(shortHighLowPeriod, longHighLowPeriod, considerNewLongTermHighLows)
[middleclose, upperclose, lowerclose] = bb(close, BBLength, StdDev)
[middleopen, upperopen, loweropen] = bb(open, BBLength, StdDev)
[middlehigh, upperhigh, lowerhigh] = bb(high, BBLength, StdDev)
[middlelow, upperlow, lowerlow] = bb(low, BBLength, StdDev)

percentBClose = (close - lowerclose)*100/(upperclose-lowerclose)
percentBOpen = (open - loweropen)*100/(upperopen-loweropen)
percentBHigh = (high - lowerhigh)*100/(upperhigh-lowerhigh)
percentBLow = (low - lowerlow)*100/(upperlow-lowerlow)

percentBMAClose = f_getMovingAverage(percentBClose, MAType, lookbackPeriod)
percentBMAOpen = f_getMovingAverage(percentBOpen, MAType, lookbackPeriod)
percentBMAHigh = f_getMovingAverage(percentBHigh, MAType, lookbackPeriod)
percentBMALow = f_getMovingAverage(percentBLow, MAType, lookbackPeriod)

newOpen = useMovingAverage? percentBMAOpen : percentBOpen
newClose = useMovingAverage? percentBMAClose : percentBClose
newHigh = useMovingAverage? percentBMAHigh : percentBHigh
newLow = useMovingAverage? percentBMALow : percentBLow

truerange = max(newHigh, newClose[1]) - min(newLow, newClose[1])

averagetruerange = f_getMovingAverage(truerange, AtrMAType, AtrLength)
atr = averagetruerange * AtrMult

longStop = newClose - atr
longStopPrev = nz(longStop[1], longStop)
longStop := (wicks ? newLow[1] : newClose[1]) > longStopPrev ? max(longStop, longStopPrev) : longStop

shortStop = newClose + atr
shortStopPrev = nz(shortStop[1], shortStop)
shortStop := (wicks ? newHigh[1] : newClose[1]) < shortStopPrev ? min(shortStop, shortStopPrev) : shortStop

dir = 1
dir := nz(dir[1], dir)
dir := dir == -1 and (wicks ? newHigh : newClose) > shortStopPrev ? 1 : dir == 1 and (wicks ? newLow : newClose) < longStopPrev ? -1 : dir

trailingStop = dir == 1? longStop : shortStop

candleColor = colorByPreviousClose ?
                 (newClose[1] < newClose ? color.green : newClose[1] > newClose ? color.red : color.silver) :
                 (newOpen < newClose ? color.green : newOpen > newClose ? color.red : color.silver)
plotcandle(newOpen, newHigh, newLow, newClose, title='PercentBCandle', color = candleColor, wickcolor=candleColor)
plot(trailingStop, title="TrailingStop", style=plot.style_linebr, linewidth=1, color= dir == 1 ? color.green : color.red)

buyCondition = dir==1 and yearlyHighCondition and newHighS
exitBuyCondition = dir == -1
sellCondition = dir == -1 and yearlyLowCondition and newLowS
exitSellCondition = dir == 1
strategy.risk.allow_entry_in(tradeDirection)

barcolor(buyCondition? color.lime : sellCondition ? color.orange : color.silver)
strategy.entry("Buy", strategy.long, when=buyCondition and inDateRange, oca_name="oca_buy")
strategy.close("Buy", when=exitBuyCondition)

strategy.entry("Sell", strategy.short, when=sellCondition and inDateRange, oca_name="oca_sell")
strategy.close("Sell", when=exitSellCondition)
Detail
https://www.fmz.com/strategy/434950
Last Modified
2023-12-11 11:14:53