
16 KiB
Name
布林带和RSI指标组合策略Bollinger-Bands-and-RSI-indicators-strategy
Author
ChaoZhang
Strategy Description
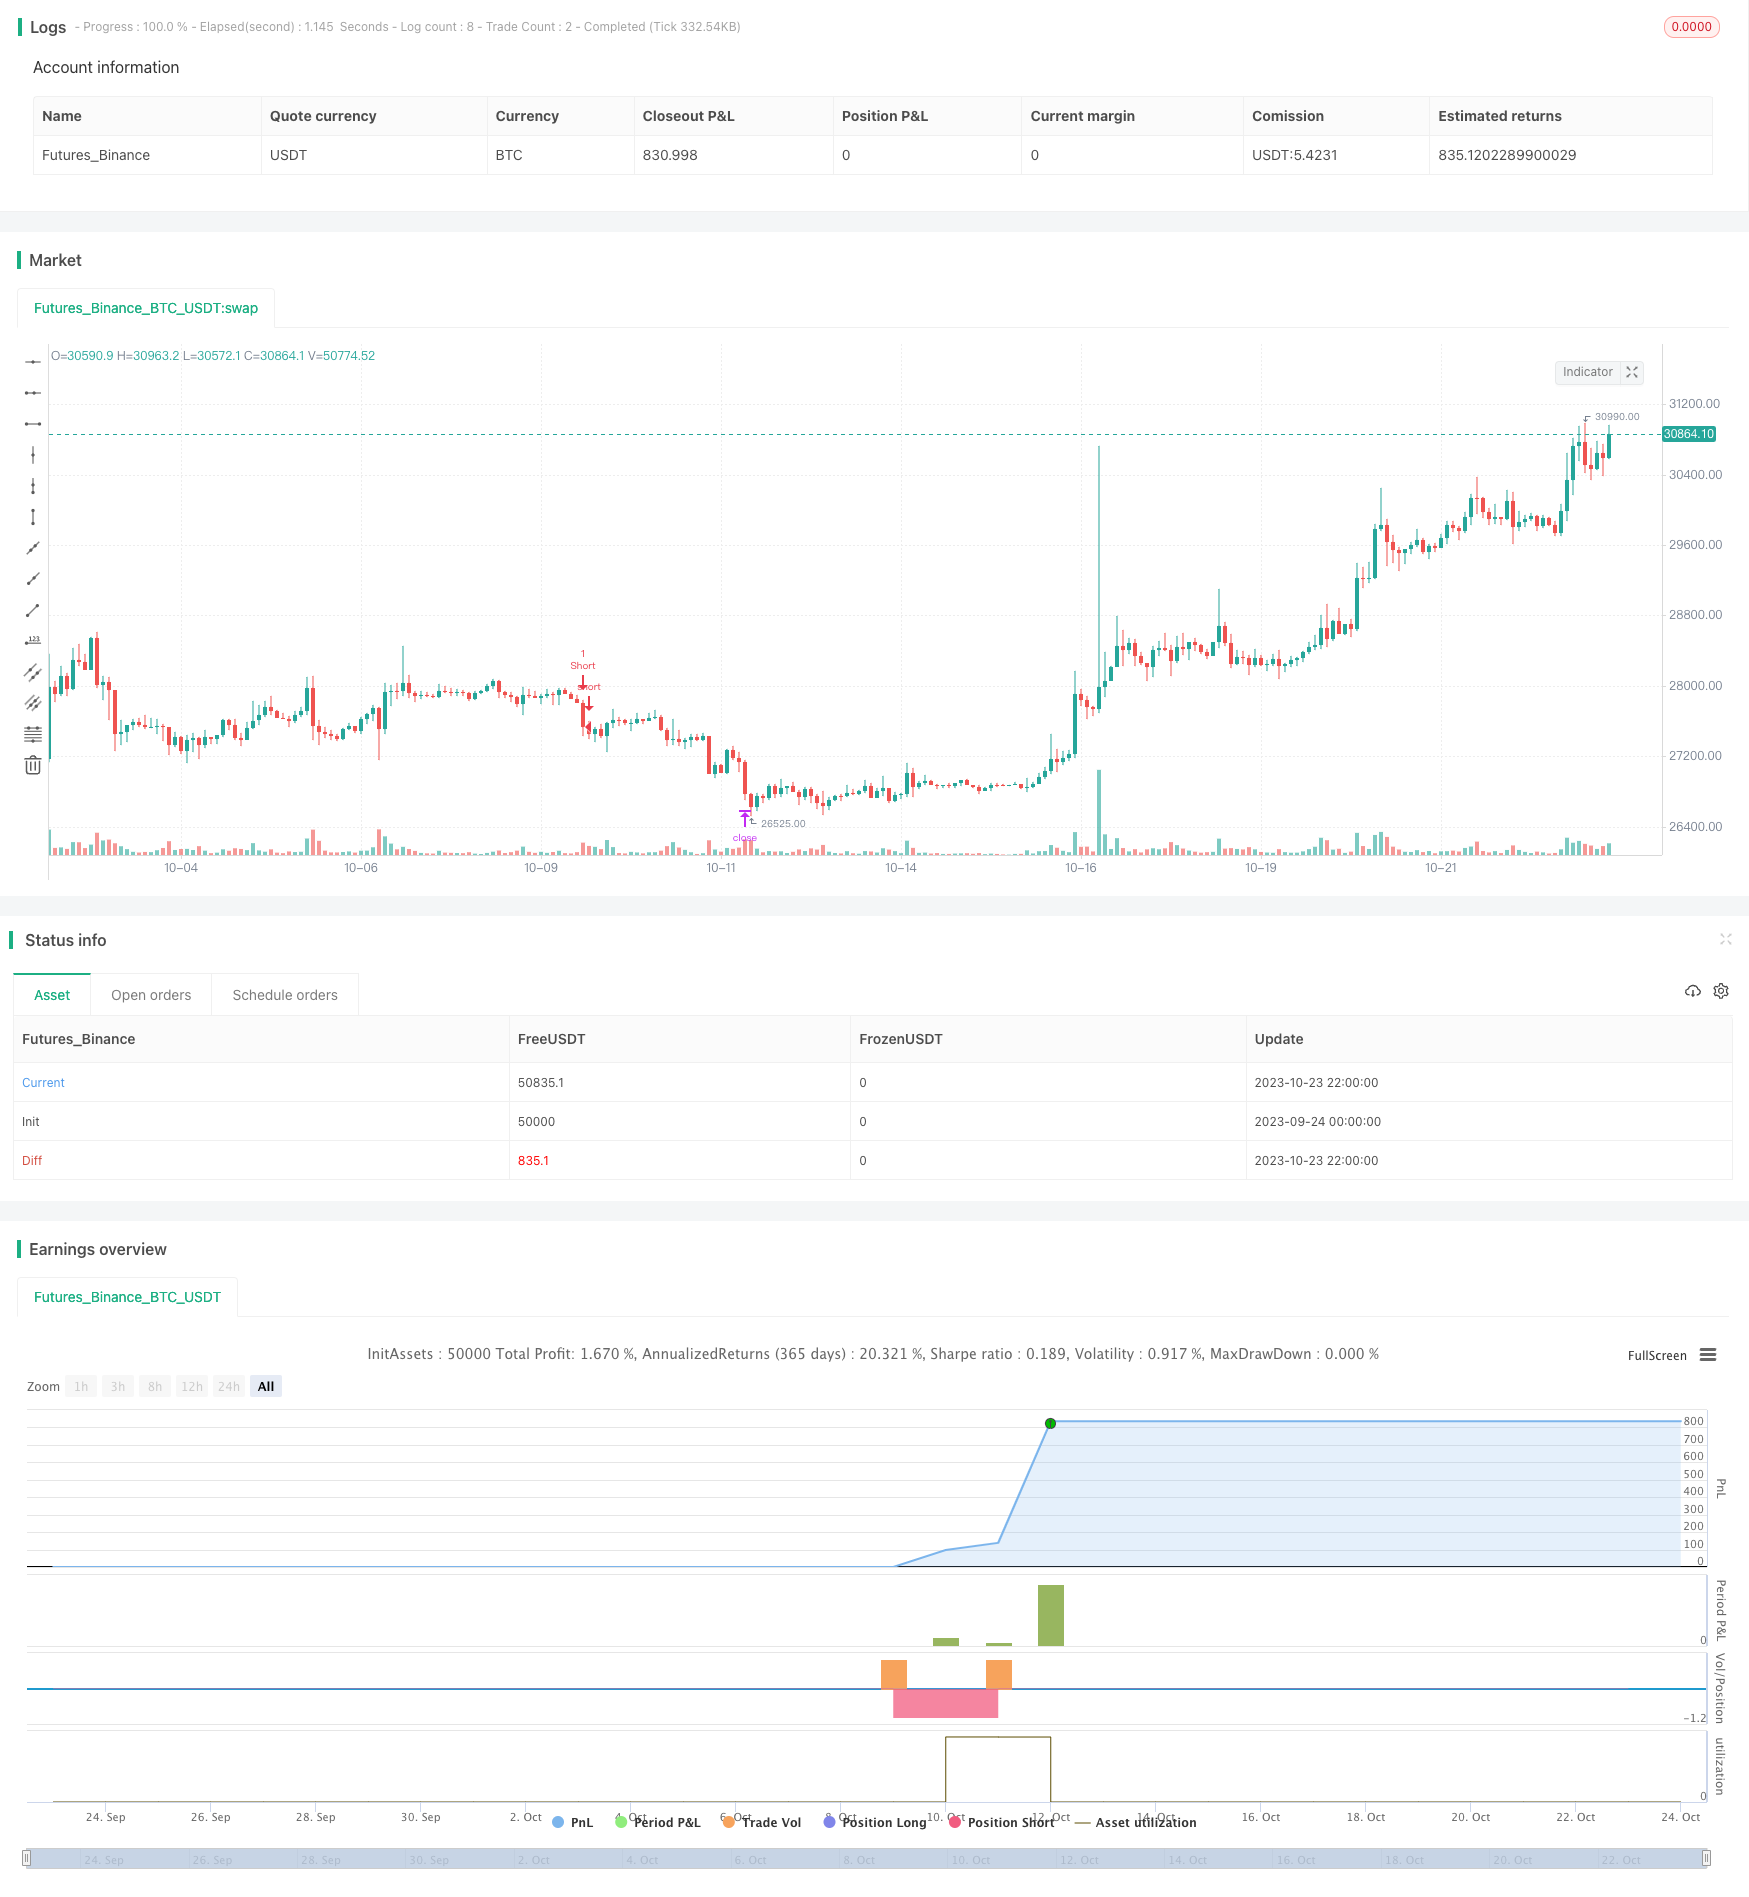
[trans]
概述
该策略主要基于布林带指标和RSI指标组合进行交易信号判断,属于典型的缝合策略。它综合利用不同指标的优势,通过布林带判定趋势方向,RSI检测超买超卖情况,从而进行入场和止损退出。
策略原理
-
使用布林带的中轨、上轨、下轨判断目前股价走势。当价格突破上轨时认为进入看涨行情,突破下轨时认为进入看跌行情。
-
布林带宽度(上轨与下轨差值)能反映目前市场波动率。当布林带宽度增大时,说明波动加剧,此时RSI能更好地检测超买超卖情况。
-
RSI指标判断超买超卖情况。RSI高于70时为超买区,低于30时为超卖区。入场时避开超买超卖区,以获得更好的风险回报比。
-
具体交易信号: (1) 看涨信号:价格上穿上轨,且RSI未超买(RSI小于70) (2) 看跌信号:价格下穿下轨,且RSI未超卖(RSI大于30)
-
止损退出:看涨交易若RSI下破70则止损;看跌交易若RSI上破30则止损。
优势分析
该策略具有以下优势:
-
综合多个指标的优点,信息更全面,信号更可靠。
-
利用布林带判断总体走势方向,扶持大盘,把握趋势。
-
RSI指标判断局部超买超卖,进一步避免不必要的风险。
-
止损机制比较严谨,有助于减少损失。
风险分析
该策略也存在以下风险:
-
布林带与RSI指标都可能出现失效的情况,从而导致交易信号错误。
-
虽有止损措施,但止损点设置不当仍可能造成较大亏损。
-
过于频繁交易会增加交易费率和滑点成本。
-
PARAMETERS优化不当可能导致过拟合。
优化方向
该策略可以从以下几个方面进行优化:
-
测试不同的指标参数组合,找到最优参数。
-
增加止损方式的灵活性,如ADDR/ATR 止损、移动止损等。
-
增加仓位管理策略,如固定仓位、马丁格尔等。
-
结合更多指标过滤信号,如交易量能量等。
-
采用机器学习进行参数自适应优化。
-
优化入场时机,在趋势出现确认信号后再入场。
总结
该策略整体来说是一个典型的多指标缝合策略。它整合布林带和RSI各自的优势,在捕捉趋势的同时避免局部超买超卖的风险。通过合理参数优化和止损管理,可以获得较好的效果。但它也存在一定的风险,需要进一步优化以提高稳定性。整体来说,该策略思路合理,具有很大的改进空间。 ||
Overview
This strategy mainly combines Bollinger Bands and RSI indicators to judge trading signals, which is a typical frankenstein strategy. It integrates the advantages of different indicators by judging the trend direction through Bollinger Bands and detecting overbought and oversold situations through RSI to make entries and stop-loss exits.
Strategy Principle
-
Use the middle band, upper band and lower band of Bollinger Bands to judge the current price trend. When the price breaks through the upper band, it is considered a bullish trend. When it breaks through the lower band, it is considered a bearish trend.
-
The width of Bollinger Bands (difference between upper and lower bands) can reflect the current market volatility. When the width increases, it means volatility increases and RSI can better detect overbought and oversold situations.
-
The RSI indicator judges overbought and oversold situations. Above 70 is the overbought zone and below 30 is the oversold zone. Avoid entering in overbought and oversold zones to obtain better risk-reward ratios.
-
Specific trading signals: (1) Bullish signal: Price breaks through the upper band and RSI is not overbought (RSI less than 70) (2) Bearish signal: Price breaks through the lower band and RSI is not oversold (RSI greater than 30)
-
Stop loss: For long trades, stop loss when RSI breaks below 70. For short trades, stop loss when RSI breaks above 30.
Advantage Analysis
The advantages of this strategy are:
-
Integrating multiple indicators provides more comprehensive information and reliable signals.
-
Using Bollinger Bands to determine the overall trend catches the big moves.
-
The RSI indicator further avoids unnecessary risks by detecting local overbought and oversold levels.
-
The stop loss mechanism is quite strict, which helps reduce losses.
Risk Analysis
This strategy also has the following risks:
-
Both Bollinger Bands and RSI may fail, resulting in wrong trading signals.
-
Although having a stop loss, improper stop loss points can still lead to major losses.
-
Too frequent trading increases transaction costs and slippage.
-
Improper optimization of parameters may lead to overfitting.
Optimization Directions
This strategy can be optimized in the following aspects:
-
Test different parameter combinations to find the optimal parameters.
-
Increase flexibility of stop loss methods, such as ADDR/ATR stop loss, trailing stop loss etc.
-
Add position sizing strategies, such as fixed fraction, Martingale etc.
-
Incorporate more indicators to filter signals, such as volume etc.
-
Use machine learning for adaptive parameter optimization.
-
Optimize entry timing, wait for confirmation signals before entering.
Conclusion
In summary, this is a typical frankenstein strategy combining multiple indicators. It integrates the advantages of Bollinger Bands and RSI to catch trends while avoiding overbought and oversold risks. With proper parameter optimization and stop loss management, good results can be achieved. But it also has some risks and needs further optimization to improve stability. Overall, the strategy idea is reasonable and has great room for improvement.
[/trans]
Strategy Arguments
| Argument | Default | Description |
|---|---|---|
| v_input_bool_1 | false | (?Strategy Inputs)Use Simple EMA Filter |
| v_input_bool_2 | true | Use DEMA Angle Filter |
| v_input_bool_3 | true | Use DEMA Filter |
| v_input_bool_4 | false | Take Every Supertrend Signal |
| v_input_bool_5 | true | Stop Loss at Supertrend |
| v_input_bool_6 | false | 2 Steps Take Profit |
| v_input_bool_7 | true | Move SL |
| v_input_float_1 | 2.5 | Stop Loss ATR Multiplier |
| v_input_float_2 | 4 | Take Profit ATR Multiplier |
| v_input_int_1 | 50 | 2 Steps TP qty% |
| v_input_float_3 | false | DEMA Angle Threshold (+ & -) |
| v_input_int_2 | true | DEMA Angle Lookback |
| v_input_string_1 | 0 | Testing: Backtest |
| v_input_int_3 | 2021 | (?BT Date Range)Backtesting start year |
| v_input_int_4 | true | Backtesting start month |
| v_input_int_5 | true | Backtesting start day |
| v_input_int_6 | 2021 | Backtesting end year |
| v_input_int_7 | 12 | Backtesting end month |
| v_input_int_8 | 31 | Backtesting end day |
| v_input_int_9 | 2022 | (?FT Date Range)Forwardtesting start year |
| v_input_int_10 | true | Forwardtesting start month |
| v_input_int_11 | true | Forwardtesting start day |
| v_input_int_12 | 2022 | Forwardtesting end year |
| v_input_int_13 | 3 | Forwardtesting end month |
| v_input_int_14 | 26 | Forwardtesting end day |
| v_input_int_15 | 2 | (?Pivot Supertrend)PVT ST Pivot Point Period |
| v_input_float_4 | 3 | PVT ST ATR Factor |
| v_input_int_16 | 9 | PVT ST ATR Period |
| v_input_int_17 | 200 | (?D-EMAs)DEMA Len |
| v_input_source_1_close | 0 | D-EMAs Source: close |
| v_input_int_18 | 21 | EMA 1 Len |
| v_input_int_19 | 50 | EMA 2 Len |
| v_input_int_20 | 200 | EMA 3 Len |
| v_input_int_21 | 21 | (?Normal Supertrend)ST ATR Period |
| v_input_source_2_hl2 | 0 | ST Supertrend Source: hl2 |
| v_input_float_5 | 2 | ST ATR Multiplier |
Source (PineScript)
/*backtest
start: 2023-09-24 00:00:00
end: 2023-10-24 00:00:00
period: 2h
basePeriod: 15m
exchanges: [{"eid":"Futures_Binance","currency":"BTC_USDT"}]
*/

// This source code is subject to the terms of the Mozilla Public License 2.0 at https://mozilla.org/MPL/2.0/
// © evillalobos1123

//@version=5
strategy("Villa Dinamic Pivot Supertrend Strategy", overlay=true, calc_on_every_tick = true, default_qty_type = strategy.fixed)

//INPUTS

ema_b = input.bool(false, "Use Simple EMA Filter", group = "Strategy Inputs")
ema_b_ang = input.bool(true, "Use DEMA Angle Filter", group = "Strategy Inputs")
dema_b = input.bool(true, "Use DEMA Filter", group = "Strategy Inputs")
st_sig = input.bool(false, "Take Every Supertrend Signal" , group = "Strategy Inputs")
take_p = input.bool(true, "Stop Loss at Supertrend", group = "Strategy Inputs")
din_tp = input.bool(false, "2 Steps Take Profit", group = "Strategy Inputs")
move_sl = input.bool(true, "Move SL", group = "Strategy Inputs")
sl_atr = input.float(2.5, "Stop Loss ATR Multiplier", group = "Strategy Inputs")
tp_atr = input.float(4, "Take Profit ATR Multiplier", group = "Strategy Inputs")
din_tp_qty = input.int(50, "2 Steps TP qty%", group = "Strategy Inputs")
dema_a_filter = input.float(0, "DEMA Angle Threshold (+ & -)", group = "Strategy Inputs")
dema_a_look = input.int(1, "DEMA Angle Lookback", group = "Strategy Inputs")
dr_test = input.string("Backtest", "Testing", options = ["Backtest", "Forwardtest", "All"], group = "Strategy Inputs")

not_in_trade = strategy.position_size == 0

//Backtesting date range

start_year = input.int(2021, "Backtesting start year", group = "BT Date Range")
start_month = input.int(1, "Backtesting start month", group = "BT Date Range")
start_date = input.int(1, "Backtesting start day", group = "BT Date Range")
end_year = input.int(2021, "Backtesting end year", group = "BT Date Range")
end_month = input.int(12, "Backtesting end month", group = "BT Date Range")
end_date = input.int(31, "Backtesting end day", group = "BT Date Range")

bt_date_range = (time >= timestamp(syminfo.timezone, start_year,
         start_month, start_date, 0, 0)) and
     (time < timestamp(syminfo.timezone, end_year, end_month, end_date, 0, 0))


//Forward testing date range

start_year_f = input.int(2022, "Forwardtesting start year", group = "FT Date Range")
start_month_f = input.int(1, "Forwardtesting start month", group = "FT Date Range")
start_date_f = input.int(1, "Forwardtesting start day", group = "FT Date Range")
end_year_f = input.int(2022, "Forwardtesting end year", group = "FT Date Range")
end_month_f = input.int(03, "Forwardtesting end month", group = "FT Date Range")
end_date_f = input.int(26, "Forwardtesting end day", group = "FT Date Range")

ft_date_range = (time >= timestamp(syminfo.timezone, start_year_f,
         start_month_f, start_date_f, 0, 0)) and
     (time < timestamp(syminfo.timezone, end_year_f, end_month_f, end_date_f, 0, 0))


//date condition
date_range_cond = if dr_test == "Backtest"
    bt_date_range
else if dr_test == "Forwardtest"
    ft_date_range
else
    true


//INDICATORS

//PIVOT SUPERTREND
prd = input.int(2, "PVT ST Pivot Point Period", group = "Pivot Supertrend")
Factor=input.float(3, "PVT ST ATR Factor", group = "Pivot Supertrend")
Pd=input.int(9 ,  "PVT ST ATR Period", group = "Pivot Supertrend")

// get Pivot High/Low
float ph = ta.pivothigh(prd, prd)
float pl = ta.pivotlow(prd, prd)

// calculate the Center line using pivot points
var float center = na
float lastpp = ph ? ph : pl ? pl : na
if lastpp
    if na(center)
        center := lastpp
    else
        //weighted calculation
        center := (center * 2 + lastpp) / 3

// upper/lower bands calculation
Up = center - (Factor * ta.atr(Pd))
Dn = center + (Factor * ta.atr(Pd))

// get the trend
float TUp = na
float TDown = na
Trend = 0
TUp := close[1] > TUp[1] ? math.max(Up, TUp[1]) : Up
TDown := close[1] < TDown[1] ? math.min(Dn, TDown[1]) : Dn
Trend := close > TDown[1] ? 1: close < TUp[1]? -1: nz(Trend[1], 1)
Trailingsl = Trend == 1 ? TUp : TDown

// check and plot the signals
bsignal = Trend == 1 and Trend[1] == -1
ssignal = Trend == -1 and Trend[1] == 1

//get S/R levels using Pivot Points
float resistance = na
float support = na
support := pl ? pl : support[1]
resistance := ph ? ph : resistance[1]

//DEMA

dema_ln = input.int(200, "DEMA Len", group = 'D-EMAs')
dema_src = input.source(close, "D-EMAs Source", group = 'D-EMAs')
ema_fd = ta.ema(dema_src, dema_ln)
dema = (2*ema_fd)-(ta.ema(ema_fd,dema_ln))

//EMA

ema1_l = input.int(21, "EMA 1 Len", group = 'D-EMAs')
ema2_l = input.int(50, "EMA 2 Len", group = 'D-EMAs')
ema3_l = input.int(200, "EMA 3 Len", group = 'D-EMAs')

ema1 = ta.ema(dema_src, ema1_l)
ema2 = ta.ema(dema_src, ema2_l)
ema3 = ta.ema(dema_src, ema3_l)

//Supertrend
Periods = input.int(21, "ST ATR Period", group = "Normal Supertrend")
src_st = input.source(hl2, "ST Supertrend Source", group = "Normal Supertrend")
Multiplier = input.float(2.0 , "ST ATR Multiplier", group = "Normal Supertrend")
changeATR= true
atr2 = ta.sma(ta.tr, Periods)
atr3= changeATR ? ta.atr(Periods) : atr2
up=src_st-(Multiplier*atr3)
up1 = nz(up[1],up)
up := close[1] > up1 ? math.max(up,up1) : up
dn=src_st+(Multiplier*atr3)
dn1 = nz(dn[1], dn)
dn := close[1] < dn1 ? math.min(dn, dn1) : dn
trend = 1
trend := nz(trend[1], trend)
trend := trend == -1 and close > dn1 ? 1 : trend == 1 and close < up1 ? -1 : trend
buySignal = trend == 1 and trend[1] == -1
sellSignal = trend == -1 and trend[1] == 1

//ATR

atr = ta.atr(14)

///CONDITIONS

//BUY
/// ema simple
ema_cond_b = if ema_b
    ema1 > ema2 and ema2 > ema3
else
    true

///ema angle

dema_angle_rad = math.atan((dema - dema[dema_a_look])/0.0001)
dema_angle = dema_angle_rad * (180/math.pi)

dema_ang_cond_b = if ema_b_ang
    if dema_angle >= dema_a_filter
        true
    else
        false
else
    true


///ema distance

dema_cond_b = if dema_b
    close > dema
else
    true


//supertrends
///if pivot buy sig or (st buy sig and pivot. trend = 1)

pvt_cond_b = bsignal

st_cond_b = if st_sig
    buySignal and Trend == 1
else
    false

st_entry_cond = pvt_cond_b or st_cond_b

///stop loss tp

sl_b = if take_p
    if trend == 1
        up
    else
        close - (atr * sl_atr)
else
    close - (atr * sl_atr)

tp_b = if take_p
    if trend == 1
        close + ((close - up) * (tp_atr / sl_atr))
    else
        close + (atr * tp_atr)
else
    close + (atr * tp_atr)

//position size
init_cap = strategy.equity
pos_size_b = math.round((init_cap * .01) / (close - sl_b))
ent_price = strategy.opentrades.entry_price(strategy.opentrades - 1)
var sl_b_n = 0.0
var tp_b_n = 0.0
longCondition = (ema_cond_b and dema_cond_b and dema_ang_cond_b and st_entry_cond and date_range_cond and not_in_trade)
if (longCondition)

    strategy.entry("Long", strategy.long, qty = pos_size_b)
    sl_b_n := sl_b
    tp_b_n := tp_b
    ent_price := strategy.opentrades.entry_price(strategy.opentrades - 1)

if (up[1] < ent_price and up >= ent_price and trend[0] == 1)
    if din_tp
        strategy.close("Long", qty_percent = din_tp_qty)
    if move_sl
        sl_b_n := ent_price

strategy.exit("Exit", "Long", stop =sl_b_n, limit = tp_b_n)


//sell

///ema simple
ema_cond_s = if ema_b
    ema1 < ema2 and ema2 < ema3
else
    true

//ema distance
dema_cond_s = if dema_b
    close < dema
else
    true

//dema angle
dema_ang_cond_s = if ema_b_ang
    if dema_angle <= (dema_a_filter * -1)
        true
    else
        false
else
    true

//supertrends
///if pivot buy sig or (st buy sig and pivot. trend = 1)

pvt_cond_s = ssignal

st_cond_s = if st_sig
    sellSignal and Trend == -1
else
    false

st_entry_cond_s = pvt_cond_s or st_cond_s

///stop loss tp


sl_s = if take_p
    if trend == -1
        dn
    else
        close + (atr * sl_atr)
else
    close + (atr * sl_atr)

tp_s = if take_p
    if trend == -1
        close - ((dn - close) * (tp_atr / sl_atr))
    else
        close - (atr * tp_atr)
else
    close - (atr * tp_atr)


shortCondition = (ema_cond_s and dema_cond_s and dema_ang_cond_s and st_entry_cond_s and not_in_trade)

pos_size_s = math.round((init_cap * .01) / (sl_s - close))
var sl_s_n = 0.0
var tp_s_n = 0.0
if (shortCondition)
    strategy.entry("Short", strategy.short, qty = pos_size_s)
    sl_s_n := sl_s
    tp_s_n := tp_s

if (dn[1] > ent_price and dn <= ent_price and trend[0] == -1)
    if din_tp
        strategy.close("Short", qty_percent = din_tp_qty)
    if move_sl
        sl_s_n := ent_price

strategy.exit("Exit", "Short", stop = sl_s_n, limit = tp_s_n)
Detail
https://www.fmz.com/strategy/430145
Last Modified
2023-10-25 14:47:21