
9.7 KiB
Name
布林带动量优化策略-Bollinger-Bands-Momentum-Optimization-Strategy
Author
ChaoZhang
Strategy Description
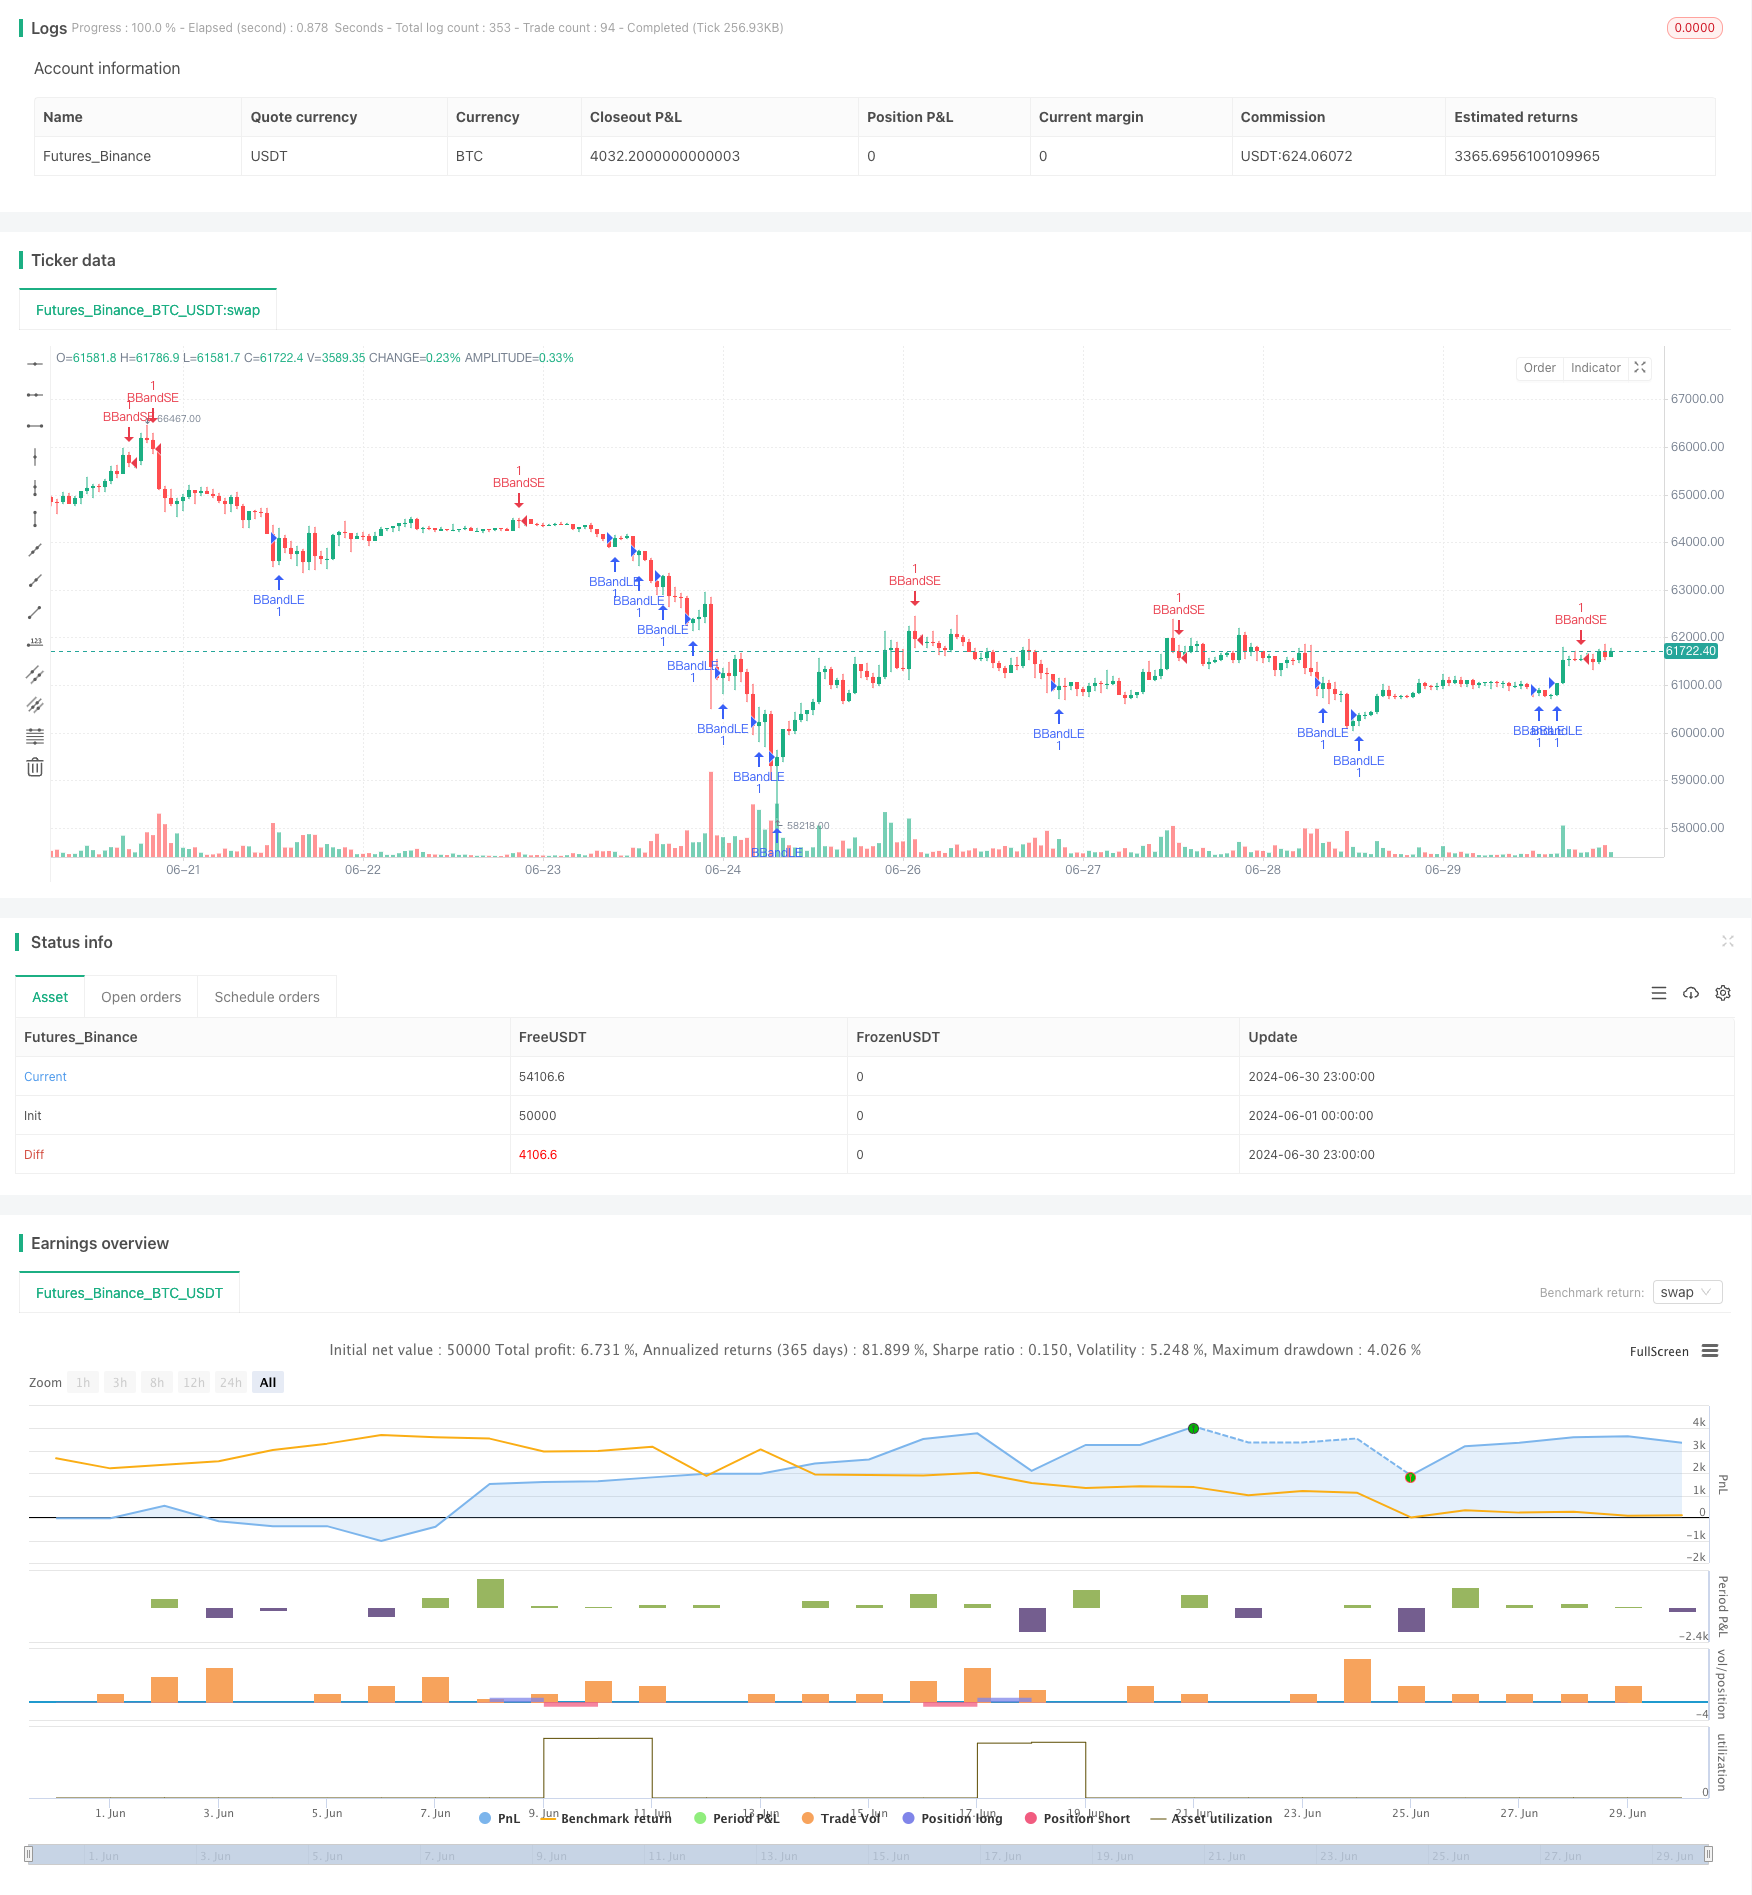
[trans]
概述
布林带动量优化策略是一种结合了布林带指标和动量概念的量化交易策略。该策略利用布林带的上下轨作为市场波动的参考,同时引入了均线和ATR指标来优化入场和出场时机。这种方法旨在捕捉市场的短期趋势反转和动量变化,通过精确的进出场信号来获取潜在的交易机会。
策略原理
-
布林带设置:策略使用20周期的简单移动平均线(SMA)作为布林带的中轨,标准差乘数为2.0。这个设置可以根据不同市场和时间框架进行调整。
-
入场信号:
- 买入信号:当价格从下方穿越布林带下轨时触发。
- 卖出信号:当价格从上方穿越布林带上轨时触发。
-
风险管理:
- 使用OCA(One-Cancels-All)订单组来管理交易,确保在一个方向上只有一个活跃的交易。
- 入场订单使用止损单,买入时以下轨为止损,卖出时以上轨为止损。
-
出场策略:
- 采用基于ATR(Average True Range)的动态止损和止盈。
- ATR周期设为14,用于计算止损和止盈水平。
-
仓位管理:策略在触发信号时开仓,并在反向信号出现或达到止损/止盈水平时平仓。
策略优势
-
动态适应性:布林带能够根据市场波动性自动调整,使策略具有良好的适应性。
-
趋势捕捉:通过布林带突破信号,策略能够有效捕捉短期趋势的开始。
-
风险控制:使用OCA订单和ATR止损,提供了多层次的风险管理机制。
-
灵活性:策略参数可以根据不同市场和时间框架进行优化调整。
-
自动化潜力:策略逻辑清晰,易于在各种交易平台上实现自动化。
策略风险
-
假突破:在横盘市场中,可能会出现频繁的假突破信号,导致过度交易。
-
滑点风险:在快速市场中,止损单可能无法以预期价格执行,增加实际损失。
-
参数敏感性:策略性能对SMA长度和标准差乘数等参数变化较为敏感。
-
趋势依赖:在没有明确趋势的市场中,策略可能表现不佳。
-
过度优化:存在过度拟合历史数据的风险,可能导致未来表现不佳。
策略优化方向
-
引入趋势过滤器:可以添加长期移动平均线或ADX指标,以确保只在强趋势市场中交易。
-
优化入场时机:考虑结合RSI或随机指标,在布林带突破的基础上进一步确认动量。
-
动态参数调整:实现布林带参数的自适应,如根据市场波动性动态调整标准差乘数。
-
改进出场策略:可以考虑使用trailing stop或基于价格行为的出场规则,以更好地锁定利润。
-
增加交易量过滤:在低交易量时避免交易,可以减少假突破带来的风险。
-
多时间框架分析:结合更长时间周期的市场结构分析,提高交易的成功率。
总结
布林带动量优化策略是一种结合技术分析和统计学原理的量化交易方法。通过布林带的动态特性和ATR的波动性测量,该策略旨在捕捉市场的短期反转和动量变化。虽然策略展现了promising的潜力,但仍需要交易者密切关注市场条件,并根据实际交易表现不断优化参数和规则。通过持续的回测和前向验证,结合严格的风险管理,这个策略有望在各种市场环境中取得稳定的表现。然而,交易者应始终牢记,没有完美的策略,持续的学习和适应是量化交易成功的关键。
||
Overview
The Bollinger Bands Momentum Optimization Strategy is a quantitative trading approach that combines the Bollinger Bands indicator with momentum concepts. This strategy utilizes the upper and lower bands of the Bollinger Bands as reference points for market volatility, while incorporating moving averages and the ATR indicator to optimize entry and exit timing. The method aims to capture short-term trend reversals and momentum shifts in the market, leveraging precise entry and exit signals to capitalize on potential trading opportunities.
Strategy Principles
-
Bollinger Bands Setup: The strategy employs a 20-period Simple Moving Average (SMA) as the middle band of the Bollinger Bands, with a standard deviation multiplier of 2.0. This setup can be adjusted for different markets and timeframes.
-
Entry Signals:
- Buy Signal: Triggered when the price crosses above the lower Bollinger Band from below.
- Sell Signal: Triggered when the price crosses below the upper Bollinger Band from above.
-
Risk Management:
- Utilizes OCA (One-Cancels-All) order groups to manage trades, ensuring only one active trade in a given direction.
- Entry orders use stop orders, with the lower band as the stop for buy entries and the upper band for sell entries.
-
Exit Strategy:
- Implements dynamic stop-loss and take-profit levels based on the ATR (Average True Range).
- ATR period is set to 14, used to calculate stop-loss and take-profit levels.
-
Position Management: The strategy opens positions when signals are triggered and closes them when reverse signals appear or stop-loss/take-profit levels are reached.
Strategy Advantages
-
Dynamic Adaptability: Bollinger Bands automatically adjust to market volatility, providing the strategy with good adaptability.
-
Trend Capture: Through Bollinger Band breakout signals, the strategy effectively captures the onset of short-term trends.
-
Risk Control: The use of OCA orders and ATR-based stops provides multi-layered risk management mechanisms.
-
Flexibility: Strategy parameters can be optimized and adjusted for different markets and timeframes.
-
Automation Potential: The strategy logic is clear and easily implementable on various trading platforms for automation.
Strategy Risks
-
False Breakouts: In ranging markets, frequent false breakout signals may lead to overtrading.
-
Slippage Risk: In fast-moving markets, stop orders may not execute at expected prices, potentially increasing actual losses.
-
Parameter Sensitivity: Strategy performance can be sensitive to changes in parameters such as SMA length and standard deviation multiplier.
-
Trend Dependency: The strategy may underperform in markets lacking clear trends.
-
Over-optimization: There's a risk of overfitting to historical data, which may lead to poor future performance.
Strategy Optimization Directions
-
Introduce Trend Filters: Consider adding long-term moving averages or ADX indicators to ensure trading only in strong trend markets.
-
Optimize Entry Timing: Consider combining RSI or Stochastic indicators to further confirm momentum on Bollinger Band breakouts.
-
Dynamic Parameter Adjustment: Implement adaptive Bollinger Band parameters, such as dynamically adjusting the standard deviation multiplier based on market volatility.
-
Improve Exit Strategy: Consider using trailing stops or price action-based exit rules to better lock in profits.
-
Add Volume Filters: Avoid trading during low volume periods to reduce risks associated with false breakouts.
-
Multi-Timeframe Analysis: Incorporate market structure analysis from longer timeframes to improve trade success rates.
Conclusion
The Bollinger Bands Momentum Optimization Strategy is a quantitative trading method that combines technical analysis with statistical principles. Through the dynamic properties of Bollinger Bands and volatility measurement of ATR, this strategy aims to capture short-term market reversals and momentum shifts. While the strategy shows promising potential, traders need to closely monitor market conditions and continuously optimize parameters and rules based on actual trading performance. Through ongoing backtesting and forward validation, combined with strict risk management, this strategy has the potential to achieve stable performance across various market environments. However, traders should always remember that there is no perfect strategy, and continuous learning and adaptation are key to success in quantitative trading.
[/trans]
Source (PineScript)
/*backtest
start: 2024-06-01 00:00:00
end: 2024-06-30 23:59:59
period: 1h
basePeriod: 15m
exchanges: [{"eid":"Futures_Binance","currency":"BTC_USDT"}]
*/

//@version=5
strategy("Optimized Bollinger Bands Strategy", overlay=true)

// Input parameters
source = close
length = input.int(20, minval=1, title="SMA Length")
mult = input.float(2.0, minval=0.001, maxval=50, title="Standard Deviation Multiplier")

// Calculate Bollinger Bands
basis = ta.sma(source, length)
dev = mult * ta.stdev(source, length)
upper = basis + dev
lower = basis - dev

// Entry conditions
buyEntry = ta.crossover(source, lower)
sellEntry = ta.crossunder(source, upper)

// Strategy entries with stops and OCA groups
if buyEntry
    strategy.entry("BBandLE", strategy.long, stop=lower, oca_name="BollingerBands", comment="BBandLE")

if sellEntry
    strategy.entry("BBandSE", strategy.short, stop=upper, oca_name="BollingerBands",  comment="BBandSE")

// Exit logic
// Implement exit conditions based on your risk management strategy
// Example: Use ATR-based stops and take profits
atrLength = input.int(14, minval=1, title="ATR Length")
atrStop = ta.atr(atrLength)
if strategy.opentrades > 0
    if strategy.position_size > 0
        strategy.exit("Take Profit/Stop Loss", "BBandLE", stop=close - atrStop, limit=close + atrStop)
    else if strategy.position_size < 0
        strategy.exit("Take Profit/Stop Loss", "BBandSE", stop=close + atrStop, limit=close - atrStop)

// Optional: Plot equity curve
// plot(strategy.equity, title="equity", color=color.red, linewidth=2, style=plot.style_area)
Detail
https://www.fmz.com/strategy/458082
Last Modified
2024-07-29 17:22:38