
17 KiB
Name
布林带动态止盈与动态加仓策略-Bollinger-Band-Dynamic-Take-Profit-and-Dynamic-Position-Adding-Strategy
Author
ChaoZhang
Strategy Description
 [trans]
策略概述
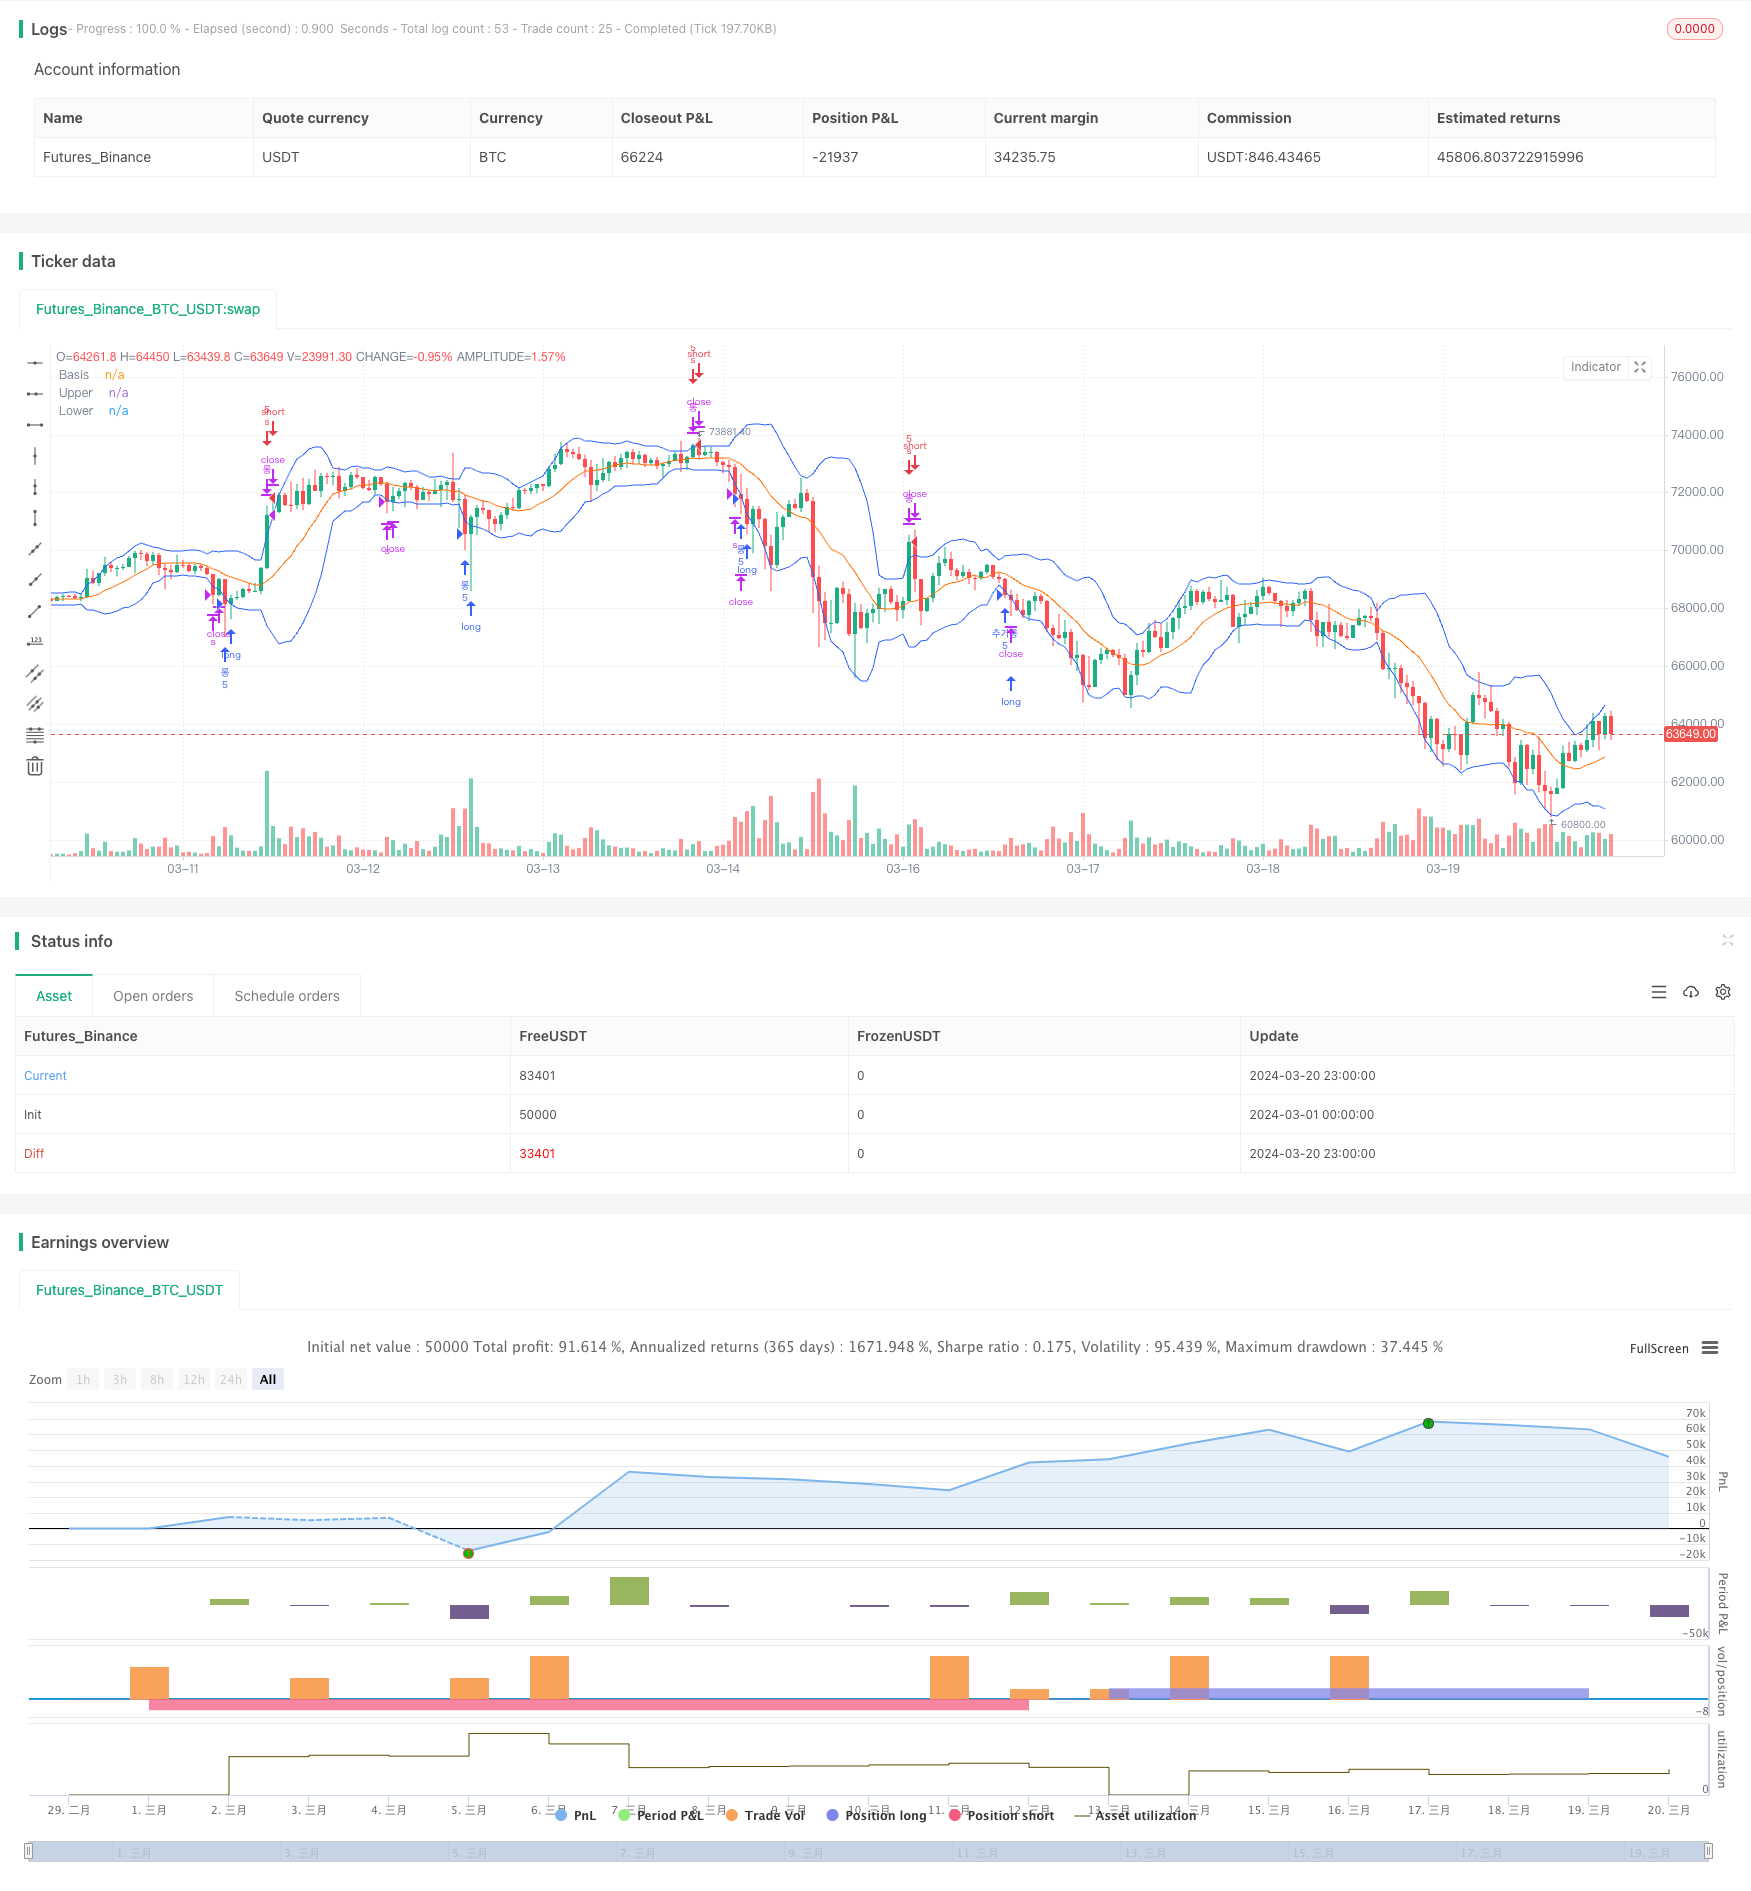
该策略基于布林带指标,在价格触及布林带上下轨时进行开仓,并设置动态止盈与动态加仓逻辑。当价格从下轨反弹并突破布林带中轨时,策略认为上涨趋势形成,此时策略会在价格回撤至中轨一定比例时进行加仓;当价格最终突破布林带上轨时,策略平仓获利了结。在下跌趋势中,策略则采取相反的操作逻辑。通过布林带动态止盈与动态加仓,该策略能够在趋势行情中获得更多利润。
策略原理
该策略的主要原理如下:
-
计算布林带上轨、中轨和下轨。上轨和下轨的计算公式为中轨加减标准差的 N 倍,其中 N 可以自定义。
-
当收盘价跌破布林带下轨且此前未开仓时,策略开多仓;当收盘价突破布林带上轨且此前未开仓时,策略开空仓。这里的开仓逻辑与传统布林带突破系统类似。
-
在开多仓后,如果收盘价向上突破布林带中轨,则认为上涨趋势形成,标记变量 basisCrossed 为 true。在开空仓后,如果收盘价向下突破布林带中轨,也标记 basisCrossed 为 true。
-
在多头情况下,如果收盘价跌破下轨且 basisCrossed 为 true,并且当前价格较原开仓价跌幅超过 2%,此时策略加仓,同时将 basisCrossed 重置为 false。空头情况与之相反。这里的加仓逻辑可以使策略在趋势回撤时低位加仓,增加获利空间。
-
如果多头持仓时收盘价突破布林带上轨,或空头持仓时收盘价跌破布林带下轨,策略平掉所有仓位,了结利润,并将各个标记变量重置,以准备下一次开仓。
通过以上动态开仓、加仓和止盈的逻辑,该策略能够在趋势行情中灵活操作,博取更高的利润。同时通过布林带这一经典技术指标来捕捉趋势,也使得策略具有一定的适应性和稳定性。
优势分析
-
动态止盈:该策略通过布林带上下轨来动态调整止盈位,相比固定点位止盈,能够更好地适应市场波动,灵活地保护利润。
-
动态加仓:在趋势形成后的回撤阶段,策略会逐步加仓,这样可以在趋势行情中博取更高利润。动态加仓使得该策略在趋势交易中更具优势。
-
参数灵活:布林带的参数如 N、P 值等都可以灵活调整,以适应不同的市场特点和交易风格。
-
适应性强:布林带是一个经典的技术指标,具有较好的趋势捕捉能力。将其与动态头寸管理相结合,可以在各类金融市场中发挥稳定的效用。
-
逻辑清晰:该策略的开平仓条件和加减仓逻辑非常清晰明了,便于traders理解和掌控。清晰的逻辑也意味着更容易做二次开发和策略优化。
风险分析
-
震荡市:布林带策略在震荡市中表现往往不佳,此时频繁的开平仓会导致较多交易成本,从而影响总体收益。
-
趋势转折:在趋势转折的关键时刻,该策略可能出现判断滞后,导致在错误的方向加仓,从而产生较大回撤。
-
极端行情:在极端行情下(如暴涨暴跌),布林带的走势可能出现异常,导致该策略失效。
-
参数设置:不恰当的参数设置会严重影响该策略的表现,如 N 值设置过小会导致频繁交易,N 值设置过大则会导致信号滞后。
-
黑天鹅事件:如遇重大的政治经济事件,该策略可能面临较大的风险敞口。
针对以上风险,可以从两方面着手控制:1)合理设置参数,针对不同的标的和市场状态进行参数优化;2)在策略中加入更多的过滤条件,如趋势判断、波动率过滤等,提高信号的质量。此外,在实际运用中还需要做好仓位控制和风险管理,严格控制单次交易的风险敞口。
优化方向
-
趋势过滤:在开仓时加入趋势判断的逻辑,如 MA 多头排列作为做多的过滤条件,MA空头排列作为做空的过滤条件,这样可以提高趋势把握的成功率。
-
波动率过滤:布林带实际上也是一种波动率指标,可以通过引入 ATR、历史波动率等指标来识别市场的波动状态,在高波状态下可以适当降低仓位,在低波状态下加大仓位,从而更好地控制风险。
-
动态参数优化:布林带的参数可以根据市场状态动态调整。如在趋势行情中可以增大N值,在震荡市中减小N值。这需要借助于机器学习等技术,通过对历史数据的训练来寻找最优参数。
-
组合策略:可以将该策略与其他经典策略如 MACD、RSI等结合,形成组合策略,提高系统的稳健性和盈利能力。
-
加入止损逻辑:目前该策略缺乏明确的止损逻辑,可以考虑加入移动止损或固定百分比止损等机制,以控制单次交易的最大损失。
-
仓位管理优化:在加仓和减仓的过程中,可以借鉴 Kelly 公式、最优F值等经典的仓位管理方法,以期在可控风险下实现利润最大化。
通过以上优化,可以进一步提升该策略的风险收益比,使其能够更好地适应多变的市场环境,为交易者带来稳定的回报。
总结
布林带动态止盈与动态加仓策略是一个经典的趋势追踪策略,它以布林带为基础,通过动态调整头寸来博取更高的趋势利润。该策略逻辑清晰,参数灵活,适应性强,是一个值得深入研究和应用的量化交易策略。但同时我们也要看到,该策略在震荡市中表现不佳,对极端行情和黑天鹅事件缺乏应对能力,这就需要我们在实际应用中注重参数优化、风险控制和策略组合,并定期检验策略在不同市场状态下的有效性。通过深入理解该策略的内在逻辑,不断优化和改进,相信该策略能够成为量化交易者的重要工具,为投资者带来长期而稳定的回报。
||
Strategy Overview
This strategy is based on the Bollinger Band indicator. It opens positions when the price reaches the upper or lower band, and sets up dynamic take profit and dynamic position adding logic. When the price rebounds from the lower band and breaks through the middle band, the strategy considers an uptrend has formed. At this time, the strategy will add positions when the price pulls back to a certain percentage of the middle band. When the price finally breaks through the upper band, the strategy closes positions to take profits. In a downtrend, the strategy adopts the opposite operating logic. Through dynamic take profit and dynamic position adding based on Bollinger Bands, this strategy can obtain more profits in trending markets.
Strategy Principle
The main principles of this strategy are as follows:
-
Calculate the upper, middle and lower bands of Bollinger Bands. The upper and lower bands are calculated by adding and subtracting N times the standard deviation from the middle band, where N can be customized.
-
When the closing price breaks down the lower band and no position has been opened before, the strategy opens a long position; when the closing price breaks up the upper band and no position has been opened before, the strategy opens a short position. The opening logic here is similar to the traditional Bollinger Band breakout system.
-
After opening a long position, if the closing price breaks upward through the middle band, it is considered that an uptrend has formed, and the variable basisCrossed is marked as true. After opening a short position, if the closing price breaks downward through the middle band, basisCrossed is also marked as true.
-
In the case of a long position, if the closing price breaks down the lower band and basisCrossed is true, and the current price has fallen by more than 2% from the original opening price, the strategy adds positions at this time, and resets basisCrossed to false at the same time. The case of a short position is the opposite. The position adding logic here allows the strategy to add positions at a low level during a trend pullback, increasing the profit space.
-
If the closing price breaks through the upper band when holding a long position, or the closing price breaks down the lower band when holding a short position, the strategy closes all positions, takes profits, and resets various marker variables to prepare for the next opening.
Through the above dynamic opening, adding positions and taking profit logic, this strategy can flexibly operate in trending markets to gain higher profits. At the same time, using the classic technical indicator of Bollinger Bands to capture trends also gives the strategy a certain adaptability and stability.
Advantage Analysis
-
Dynamic take profit: This strategy dynamically adjusts the take profit level through the upper and lower bands of Bollinger Bands. Compared with fixed point take profit, it can better adapt to market fluctuations and flexibly protect profits.
-
Dynamic position adding: In the pullback stage after the trend is formed, the strategy will gradually add positions, which can gain higher profits in trending markets. Dynamic position adding makes this strategy more advantageous in trend trading.
-
Flexible parameters: The parameters of Bollinger Bands, such as N and P values, can be flexibly adjusted to adapt to different market characteristics and trading styles.
-
Strong adaptability: Bollinger Band is a classic technical indicator with a good ability to capture trends. Combining it with dynamic position management, it can play a stable role in various financial markets.
-
Clear logic: The opening and closing conditions and the logic of adding and reducing positions of this strategy are very clear and easy to understand, which is convenient for traders to understand and control. Clear logic also means it is easier to do secondary development and strategy optimization.
Risk Analysis
-
Oscillating market: Bollinger Band strategies often perform poorly in oscillating markets. At this time, frequent opening and closing of positions will lead to more transaction costs, which will affect the overall return.
-
Trend reversal: At the key moment of trend reversal, this strategy may experience lagging judgment, leading to adding positions in the wrong direction, resulting in a larger drawdown.
-
Extreme situations: In extreme situations (such as sharp rises and falls), the trend of Bollinger Bands may be abnormal, causing the strategy to fail.
-
Parameter settings: Inappropriate parameter settings will seriously affect the performance of this strategy. For example, setting the N value too small will lead to frequent transactions, and setting the N value too large will lead to signal lag.
-
Black swan events: If there are major political and economic events, this strategy may face greater risk exposure.
In order to control the above risks, we can start from two aspects: 1) Reasonably set parameters and optimize parameters for different targets and market conditions; 2) Add more filtering conditions to the strategy, such as trend judgment, volatility filtering, etc., to improve the quality of signals. In addition, in actual use, it is also necessary to do a good job in position control and risk management, and strictly control the risk exposure of a single transaction.
Optimization Direction
-
Trend filtering: Add the logic of trend judgment when opening positions, such as using MA bullish arrangement as a filtering condition for going long, and MA bearish arrangement as a filtering condition for going short, which can improve the success rate of trend grasping.
-
Volatility filtering: Bollinger Bands are actually a kind of volatility indicator. Volatility indicators such as ATR and historical volatility can be introduced to identify the volatility state of the market. Positions can be appropriately reduced in high-volatility states and increased in low-volatility states, so as to better control risks.
-
Dynamic parameter optimization: The parameters of Bollinger Bands can be dynamically adjusted according to market conditions. For example, the N value can be increased in trending markets and decreased in oscillating markets. This requires the use of machine learning and other technologies to find the optimal parameters through training on historical data.
-
Combined strategies: This strategy can be combined with other classic strategies such as MACD and RSI to form combined strategies, improving the robustness and profitability of the system.
-
Add stop-loss logic: At present, this strategy lacks a clear stop-loss logic. We can consider adding mechanisms such as trailing stop or fixed percentage stop-loss to control the maximum loss of a single transaction.
-
Position management optimization: In the process of adding and reducing positions, classic position management methods such as the Kelly formula and optimal F value can be used to maximize profits under controllable risks.
Through the above optimizations, the risk-reward ratio of this strategy can be further improved, enabling it to better adapt to changing market environments and bring stable returns to traders.
Summary
The Bollinger Band dynamic take profit and dynamic position adding strategy is a classic trend tracking strategy. Based on Bollinger Bands, it seeks higher trend profits by dynamically adjusting positions. This strategy has clear logic, flexible parameters, and strong adaptability. It is a quantitative trading strategy worthy of in-depth research and application. But at the same time, we must also see that this strategy performs poorly in oscillating markets and lacks the ability to deal with extreme situations and black swan events. This requires us to focus on parameter optimization, risk control and strategy combination in actual application, and regularly test the effectiveness of the strategy in different market conditions. By deeply understanding the internal logic of this strategy and continuously optimizing and improving it, I believe this strategy can become an important tool for quantitative traders and bring long-term and stable returns to investors.
[/trans]
Strategy Arguments
| Argument | Default | Description |
|---|---|---|
| v_input_int_1 | 12 | length |
| v_input_1_close | 0 | Source: close |
| v_input_float_1 | 2 | StdDev |
| v_input_int_2 | false | Offset |
| v_input_float_2 | 0.98 | add |
Source (PineScript)
/*backtest
start: 2024-03-01 00:00:00
end: 2024-03-21 00:00:00
period: 1h
basePeriod: 15m
exchanges: [{"eid":"Futures_Binance","currency":"BTC_USDT"}]
*/

//@version=5
//  Bollinger Bands 1Bb 상하한 크로스 롱숏 실행

strategy(shorttitle="BB", title="Bollinger Bands", overlay=true )
 // bb
length = input.int(12, minval=1)
src = input(close, title="Source")
mult = input.float(2.0, minval=0.001, maxval=50, title="StdDev")
basis = ta.sma(src, length)
dev = mult * ta.stdev(src, length)
upper = basis + dev
lower = basis - dev
offset = input.int(0, "Offset", minval = -500, maxval = 500)
plot(basis, "Basis", color=#FF6D00, offset = offset)
p1 = plot(upper, "Upper", color=#2962FF, offset = offset)
p2 = plot(lower, "Lower", color=#2962FF, offset = offset)
add = input.float(0.98, step = 0.001)
// plot(upper - lower, "Basis", color=color.red, offset = offset)
var bool entryMade = false
var bool basisCrossed = false
var bool upperCrossed = false
var bool lowerCrossed = false
strategy.initial_capital = 50000
if close < lower and not entryMade
    strategy.entry("롱", strategy.long, qty = strategy.initial_capital/10000)
    entryMade := true
if ta.crossover(close, basis) and entryMade and not upperCrossed
    basisCrossed := true
if close > upper
    upperCrossed := true
if close < lower and entryMade and basisCrossed and not upperCrossed and close < strategy.position_avg_price*add
    strategy.entry("추가롱", strategy.long, strategy.initial_capital/10000)
    basisCrossed := false
if close > upper
    strategy.close("롱")
    strategy.close("추가롱")
    entryMade := false
    basisCrossed := false
    upperCrossed := false
///////////반대 포지션
if close > upper and not entryMade
    strategy.entry("s", strategy.short, qty = strategy.initial_capital/10000)
    entryMade := true
if ta.crossunder(close, basis) and entryMade and not lowerCrossed
    basisCrossed := true
if close < lower
    lowerCrossed := true
if close > upper and entryMade and basisCrossed and not lowerCrossed and close > strategy.position_avg_price*add
    strategy.entry("추가s", strategy.short, strategy.initial_capital/10000)
    basisCrossed := false
if close < lower
    strategy.close("s")
    strategy.close("추가s")
    entryMade := false
    basisCrossed := false
    upperCrossed := false
Detail
https://www.fmz.com/strategy/445836
Last Modified
2024-03-22 15:49:28