
7.5 KiB
Name
布林带动态止损止盈策略-Dynamic-Stop-Loss-and-Take-Profit-Bollinger-Bands-Strategy
Author
ChaoZhang
Strategy Description
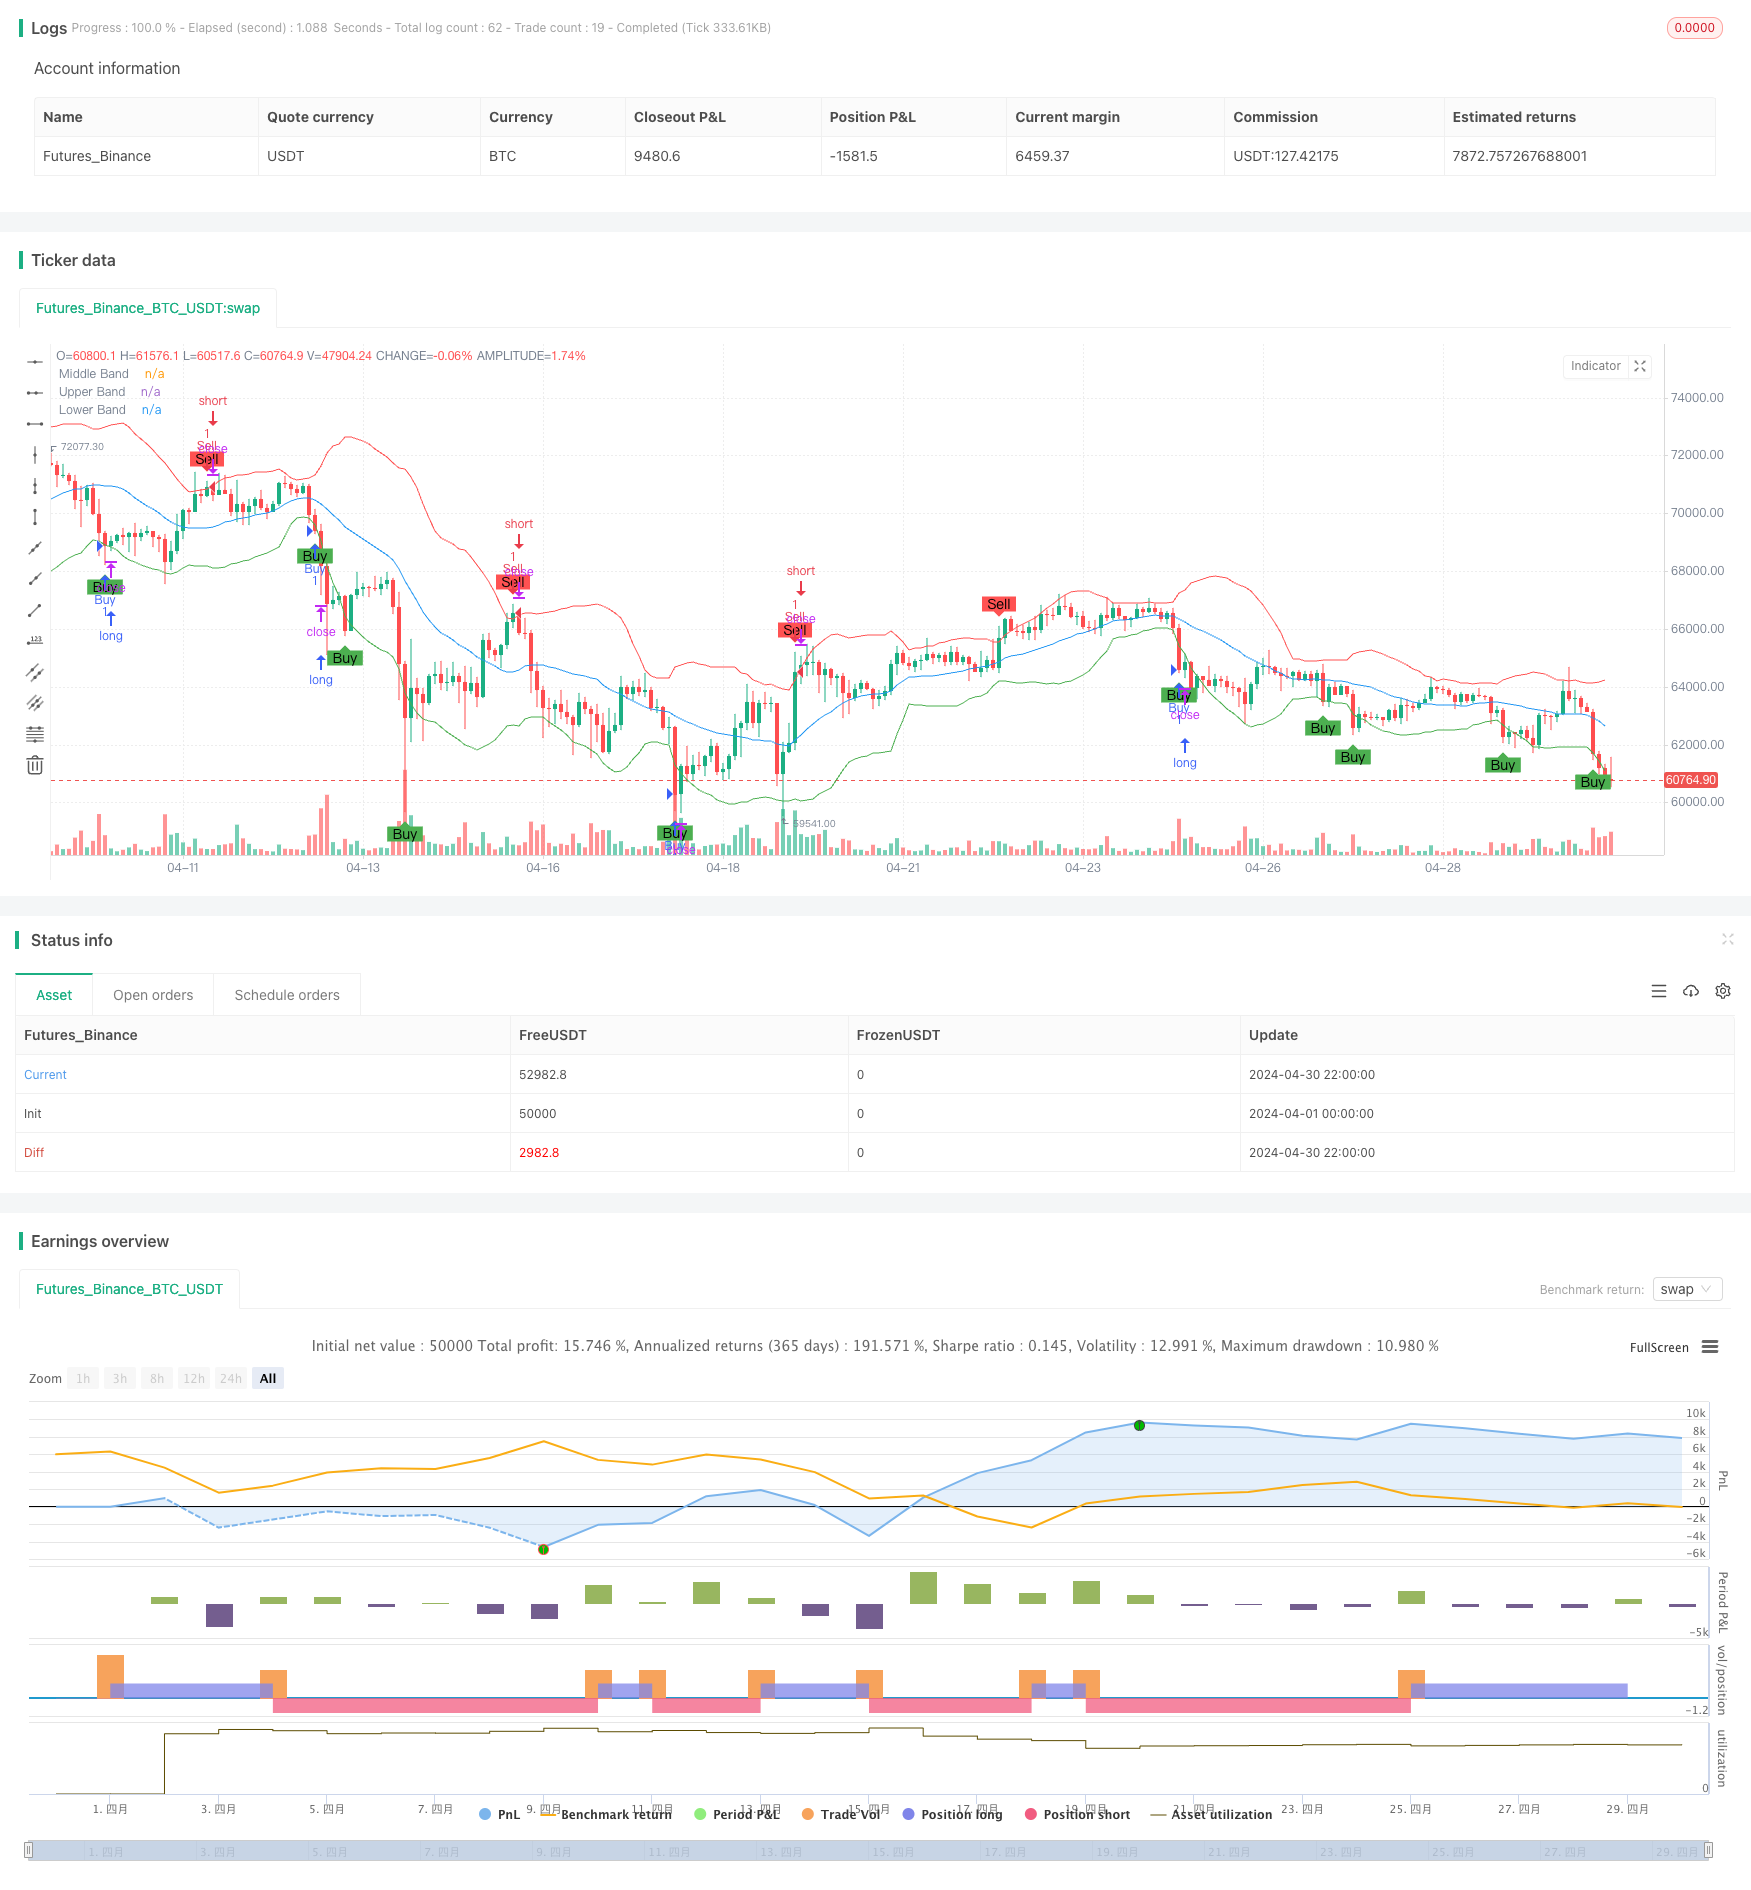
[trans]
概述
该策略是一个基于布林带的交易策略。它使用布林带来生成买卖信号,并动态设置止损和止盈水平。当价格穿越下轨时产生买入信号,穿越上轨时产生卖出信号。止损位置设置在过去一段时间内的最低价或最高价,止盈位置则根据新的信号动态调整。
策略原理
- 计算布林带上轨、中轨和下轨。
- 当价格穿越下轨时,产生买入信号;当价格穿越上轨时,产生卖出信号。
- 买入时,止损位置设置为过去一段时间内的最低价,止盈位置暂不设置。
- 卖出时,止损位置设置为过去一段时间内的最高价,止盈位置暂不设置。
- 当出现新的买入或卖出信号时,止盈位置重置为空。
策略优势
- 布林带是一个成熟且广泛使用的技术指标,能够有效捕捉市场波动。
- 动态止损和止盈设置能够适应不同的市场条件,提高策略的适应性。
- 止损位置的设置能够有效控制风险,防止单笔交易损失过大。
- 策略逻辑清晰,易于理解和实现。
策略风险
- 在震荡市场中,频繁的买卖信号可能导致过多的交易,增加交易成本。
- 止损位置的设置基于历史数据,可能无法适应未来的市场变化。
- 策略缺乏对趋势方向的判断,可能在强趋势市场中错失机会。
策略优化方向
- 引入趋势判断指标,如移动平均线,在趋势方向上进行交易,提高策略的趋势适应性。
- 优化止损和止盈位置的设置方法,如使用ATR等波动率指标,使其更加动态和适应市场变化。
- 在买卖信号中加入额外的过滤条件,如交易量、波动率等,提高信号的可靠性。
- 对参数进行优化,如布林带的长度和标准差倍数,找到最佳的参数组合。
总结
该策略是一个基于布林带的交易策略,通过布林带的穿越来产生买卖信号,并动态设置止损和止盈水平。策略逻辑清晰,易于实现,能够适应不同的市场条件。但在震荡市场中可能产生过多的交易,并且缺乏对趋势方向的判断。未来可以通过引入趋势判断指标、优化止损止盈设置方法、添加过滤条件和参数优化等方式来提高策略的表现。
||
Overview
This strategy is a Bollinger Bands-based trading strategy. It uses Bollinger Bands to generate buy and sell signals and dynamically sets stop loss and take profit levels. A buy signal is generated when the price crosses below the lower band, and a sell signal is generated when the price crosses above the upper band. The stop loss level is set at the lowest or highest price over a past period, and the take profit level is dynamically adjusted based on new signals.
Strategy Principle
- Calculate the upper, middle, and lower Bollinger Bands.
- Generate a buy signal when the price crosses below the lower band and a sell signal when the price crosses above the upper band.
- When buying, set the stop loss level at the lowest price over a past period and do not set the take profit level yet.
- When selling, set the stop loss level at the highest price over a past period and do not set the take profit level yet.
- Reset the take profit level to empty when a new buy or sell signal appears.
Strategy Advantages
- Bollinger Bands are a mature and widely used technical indicator that can effectively capture market volatility.
- Dynamic stop loss and take profit settings can adapt to different market conditions, improving the strategy's adaptability.
- The setting of the stop loss level can effectively control risk and prevent excessive losses from a single trade.
- The strategy logic is clear and easy to understand and implement.
Strategy Risks
- In a sideways market, frequent buy and sell signals may lead to excessive trading and increase trading costs.
- The setting of the stop loss level is based on historical data and may not adapt to future market changes.
- The strategy lacks judgment of the trend direction and may miss opportunities in strong trending markets.
Strategy Optimization Directions
- Introduce trend judgment indicators, such as moving averages, to trade in the direction of the trend and improve the strategy's trend adaptability.
- Optimize the setting method of stop loss and take profit levels, such as using volatility indicators like ATR, to make them more dynamic and adaptable to market changes.
- Add additional filtering conditions to the buy and sell signals, such as trading volume and volatility, to improve the reliability of the signals.
- Optimize parameters, such as the length and standard deviation multiplier of the Bollinger Bands, to find the best parameter combination.
Summary
This strategy is a Bollinger Bands-based trading strategy that generates buy and sell signals through the crossing of Bollinger Bands and dynamically sets stop loss and take profit levels. The strategy logic is clear and easy to implement, and it can adapt to different market conditions. However, it may generate excessive trading in sideways markets and lacks judgment of the trend direction. In the future, the strategy's performance can be improved by introducing trend judgment indicators, optimizing the setting method of stop loss and take profit levels, adding filtering conditions, and optimizing parameters. [/trans]
Source (PineScript)
/*backtest
start: 2024-04-01 00:00:00
end: 2024-04-30 23:59:59
period: 2h
basePeriod: 15m
exchanges: [{"eid":"Futures_Binance","currency":"BTC_USDT"}]
*/

//@version=5
strategy("Bollinger Bands Strategy", overlay=true)

// Bollinger Bands settings
length = 20
src = close
mult = 2.0

// Calculate Bollinger Bands
basis = ta.sma(src, length)
dev = mult * ta.stdev(src, length)
upper = basis + dev
lower = basis - dev

// Plot Bollinger Bands
plot(basis, color=color.blue, title="Middle Band")
plot(upper, color=color.red, title="Upper Band")
plot(lower, color=color.green, title="Lower Band")

// Trade logic
// Buy when the price crosses below the lower Bollinger Band
buySignal = ta.crossover(lower, src)
// Sell when the price crosses above the upper Bollinger Band
sellSignal = ta.crossover(src, upper)

// Define stop loss and take profit levels
var float stopLoss = na
var float takeProfit = na

// Calculate stop loss and take profit levels
if (buySignal)
    stopLoss := ta.lowest(low, length)
    takeProfit := na
if (sellSignal)
    stopLoss := ta.highest(high, length)
    takeProfit := na

// Update take profit on new signals
if (buySignal)
    takeProfit := na
if (sellSignal)
    takeProfit := na

// Execute trades
if (buySignal)
    strategy.entry("Buy", strategy.long, stop=stopLoss, limit=takeProfit)

if (sellSignal)
    strategy.entry("Sell", strategy.short, stop=stopLoss, limit=takeProfit)

// Plot signals on chart
plotshape(series=buySignal, location=location.belowbar, color=color.green, style=shape.labelup, text="Buy", title="Buy Signal")
plotshape(series=sellSignal, location=location.abovebar, color=color.red, style=shape.labeldown, text="Sell", title="Sell Signal")

// Alert conditions
alertcondition(buySignal, title="Buy Alert", message="Buy Signal detected")
alertcondition(sellSignal, title="Sell Alert", message="Sell Signal detected")
Detail
https://www.fmz.com/strategy/451725
Last Modified
2024-05-17 15:11:50