
10 KiB
Name
布林带与随机指标KD交叉策略Bollinger-Bands-and-Stochastic-KD-Crossover-Strategy
Author
ChaoZhang
Strategy Description
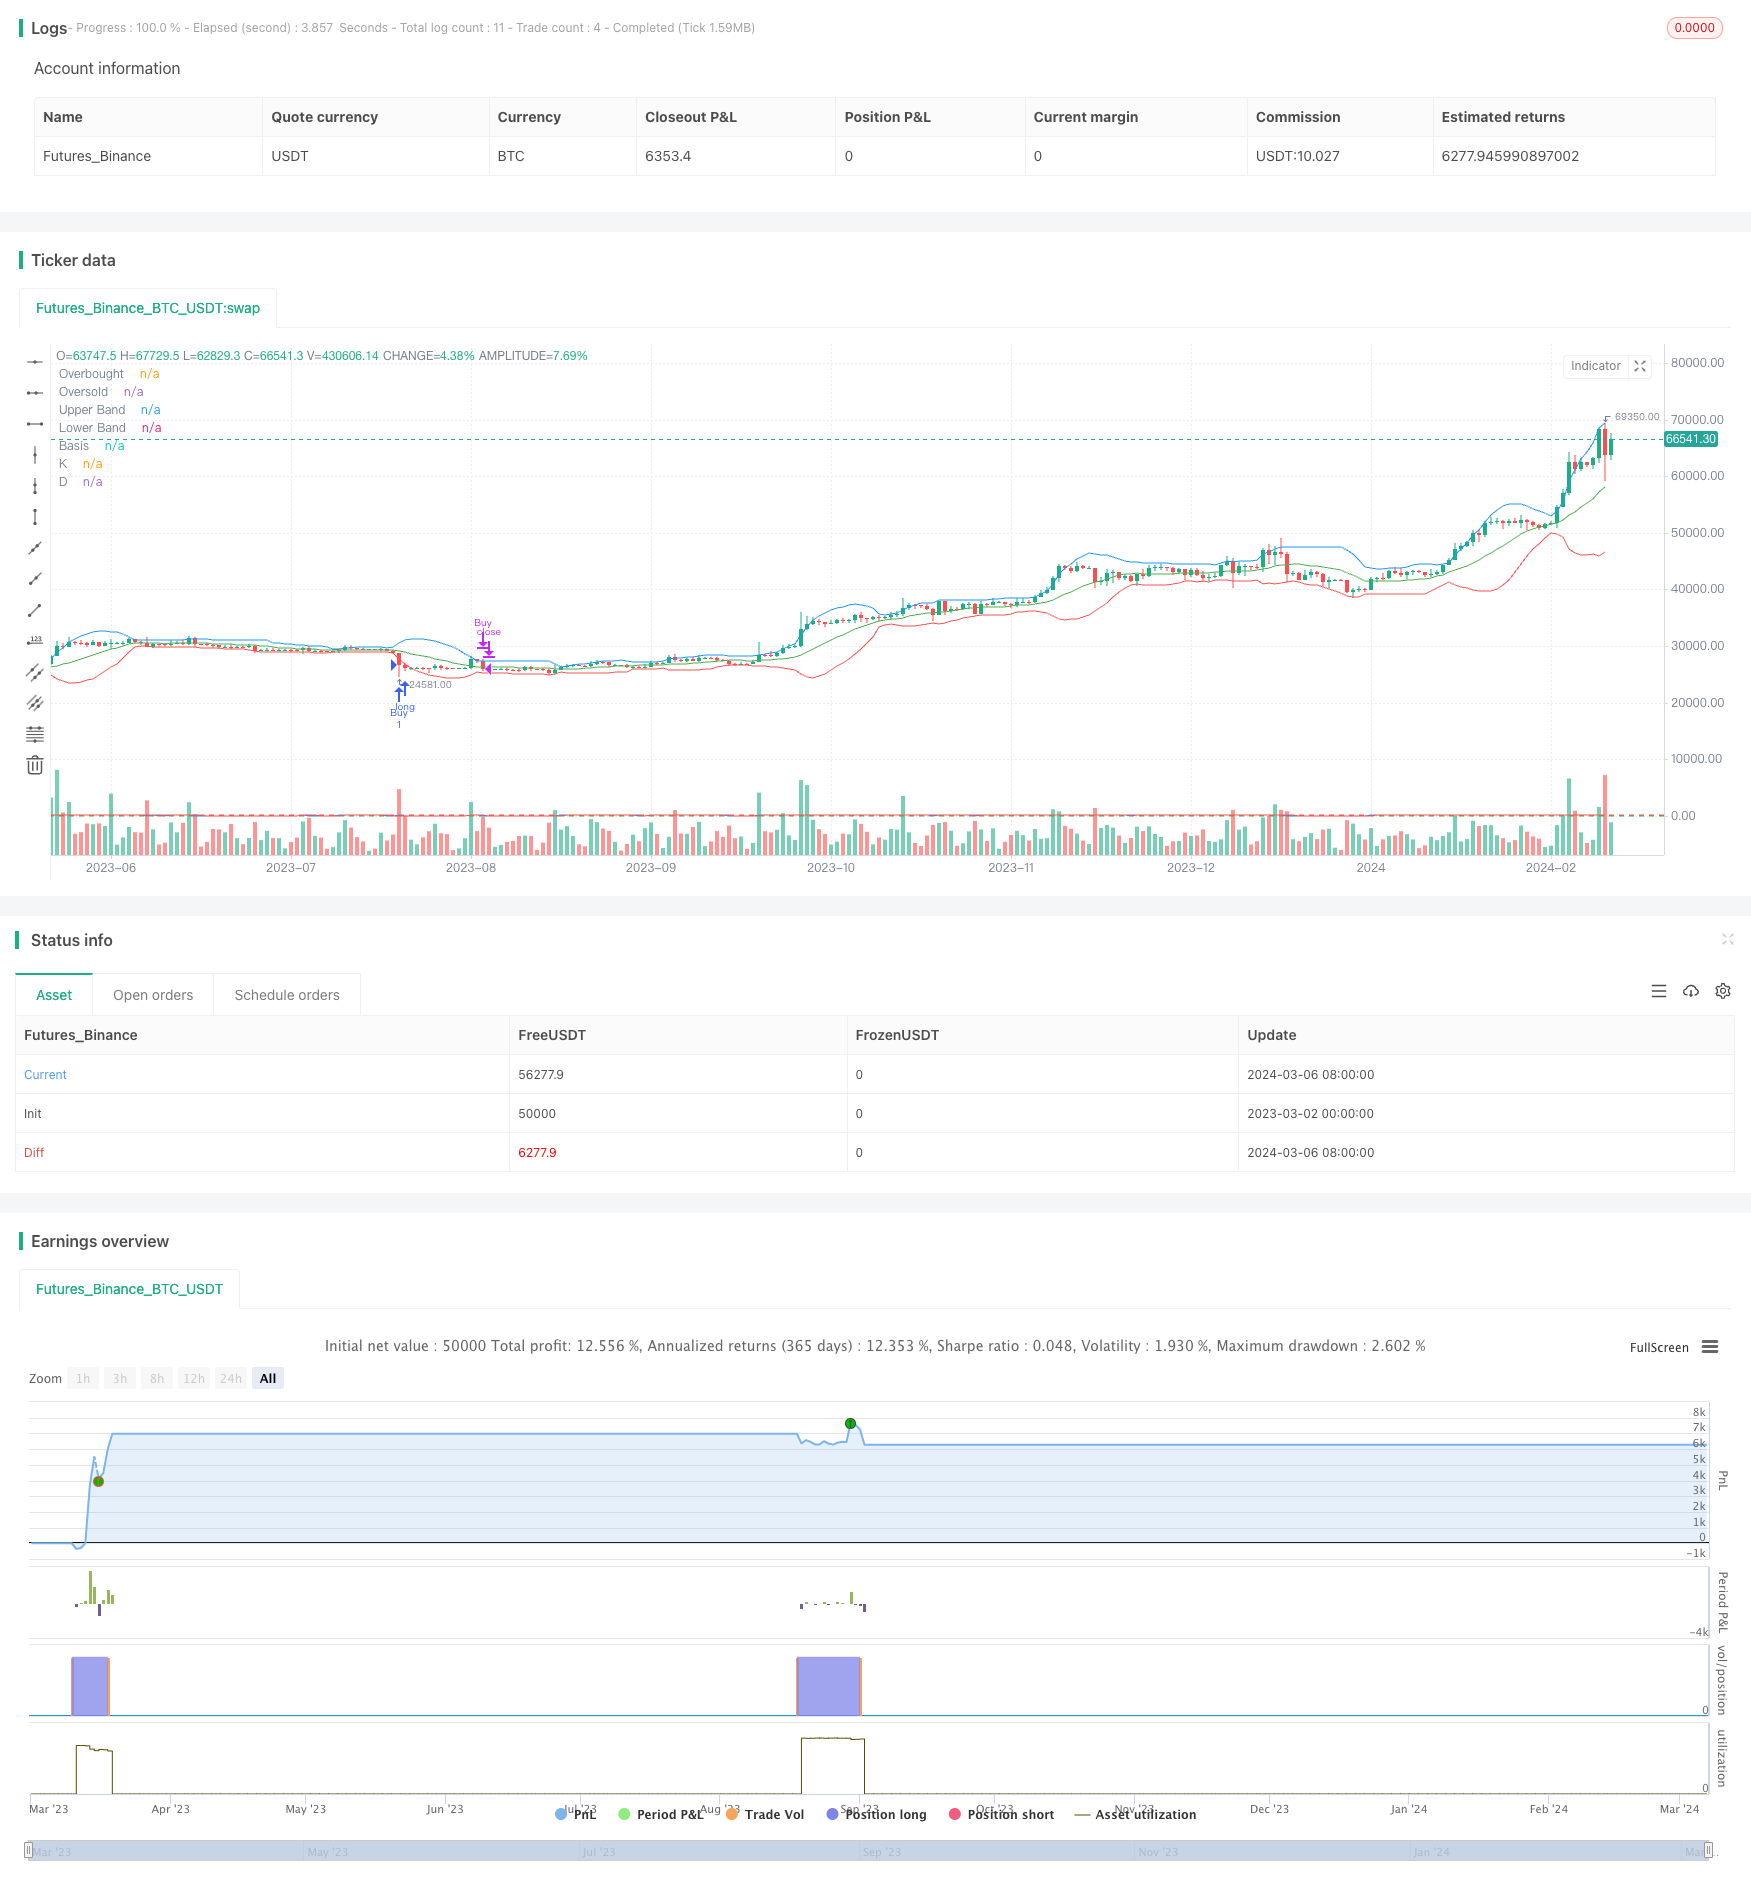 [trans]
概述
该策略结合了布林带和随机指标KD两个技术指标,通过判断价格是否跌破布林带下轨以及随机指标KD是否金叉来决定买入时机,并通过判断价格是否跌破布林带中轨或者价格是否突破布林带上轨来决定卖出时机。该策略力求捕捉市场超卖后的反弹行情,同时控制回撤风险。
策略原理
-
计算布林带:使用价格的简单移动平均线作为布林带中轨,上下轨的计算方式为中轨加减价格标准差的固定倍数。
-
计算随机指标KD:随机指标K值为当前收盘价在最近N个周期最高价最低价区间的相对位置,D值为K值的M日简单移动平均。
-
买入条件:当前收盘价跌破布林带下轨,且随机指标KD金叉(K值上穿D值)时,策略买入。
-
卖出条件:当前收盘价跌破布林带中轨或者突破布林带上轨时,策略卖出。
通过布林带判断价格是否处于相对低位,再结合随机指标KD金叉确认反转信号,以此作为买入时机;当价格重新回归至布林带中轨附近或者超买至上轨时,及时卖出以控制风险并锁定利润。
优势分析
-
结合价格和动量指标,能较好地捕捉超卖后的反弹行情。
-
布林带能动态刻画价格的相对高低位置,与固定阈值相比更加客观有效。
-
随机指标KD能反映价格的超买超卖状态以及动量变化,与布林带形成有效互补。
-
设置明确的止损位和止盈位,控制单笔交易风险敞口。
-
参数可调,适用于不同市场和周期。
风险分析
-
对于震荡市或趋势不明朗时,该策略表现可能欠佳,需要结合趋势判断指标甄别。
-
随机指标KD在某些情况下可能出现骗线,需要结合其他方法进一步确认。
-
布林带和随机指标KD参数的选取需要根据回测进行优化,不恰当的参数可能导致过早止损或持仓时间过长。
-
缺乏仓位管理和资金管理方面的考虑,回撤控制能力有限。
优化方向
-
引入趋势判断指标如移动平均线,仅在趋势明确时采用该策略。
-
对随机指标KD金叉信号进行二次确认,如判断K值是否位于低位区。
-
对布林带和随机指标KD参数进行优化,找出最佳参数组合。
-
在策略中加入仓位管理和资金管理模块,如采用凯利公式计算仓位、设置总体止损线等。
-
不同市场和周期分别进行参数优化和回测,提高策略的适用性。
总结
本文介绍了一种基于布林带和随机指标KD的交易策略。该策略通过比较价格与布林带的位置关系以及随机指标KD的交叉信号来判断买卖时机,力求捕捉超卖后的反弹行情并控制回撤风险。策略优点在于能动态刻画价格相对高低位置,并结合价格超买超卖状态进行决策,信号明确且互为补充。但该策略也存在一定局限性,如对于震荡市表现欠佳、随机指标KD存在骗线可能、缺乏仓位管理等问题。未来可以从趋势判断、信号确认、参数优化、资金管理等方面对策略进行完善,提高其适用性和稳健性。总的来说,该策略提供了一个布林带和随机指标KD联用的思路,但在实盘应用中还需要根据具体市场特点和风险偏好进行调整和优化。
||
Overview
This strategy combines two technical indicators, Bollinger Bands and Stochastic KD, to determine entry and exit points. It aims to capture the rebound after the market is oversold while controlling the drawdown risk. The strategy enters a long position when the closing price breaks below the lower Bollinger Band and the Stochastic KD lines cross bullishly (K line crosses above D line). It closes the position when the closing price either breaks below the middle Bollinger Band or breaks above the upper Bollinger Band.
Strategy Principles
-
Calculate Bollinger Bands: Use the simple moving average of price as the middle band, and the upper and lower bands are calculated by adding and subtracting a fixed multiple of the price standard deviation from the middle band.
-
Calculate Stochastic KD: The K value represents the relative position of the current closing price within the range of the highest and lowest prices over the past N periods. The D value is the M-day simple moving average of the K value.
-
Entry condition: When the current closing price breaks below the lower Bollinger Band and the Stochastic KD lines cross bullishly (K line crosses above D line), the strategy enters a long position.
-
Exit condition: When the current closing price either breaks below the middle Bollinger Band or breaks above the upper Bollinger Band, the strategy closes the position.
By using Bollinger Bands to determine if the price is at a relatively low level and confirming the reversal signal with the Stochastic KD bullish crossover, the strategy seeks to capture the entry point. When the price returns to the vicinity of the middle Bollinger Band or becomes overbought and reaches the upper band, the strategy promptly exits to control risk and lock in profits.
Advantages
-
By combining price and momentum indicators, the strategy can effectively capture the rebound after oversold conditions.
-
Bollinger Bands dynamically depict the relative high and low levels of price, which is more objective and effective compared to fixed thresholds.
-
The Stochastic KD indicator reflects the overbought and oversold status of the price and its momentum changes, complementing the Bollinger Bands.
-
Clear stop-loss and take-profit levels are set to control the risk exposure of each trade.
-
Parameters are adjustable, making the strategy suitable for different markets and timeframes.
Risks
-
The strategy may underperform in range-bound markets or when the trend is unclear, requiring additional trend-detecting indicators for discernment.
-
The Stochastic KD indicator may occasionally give false signals, necessitating further confirmation using other methods.
-
The selection of parameters for Bollinger Bands and Stochastic KD needs to be optimized through backtesting. Inappropriate parameters may lead to premature stop-losses or prolonged holding periods.
-
The strategy lacks consideration for position sizing and money management, limiting its ability to control drawdowns.
Optimization Directions
-
Introduce trend-following indicators such as moving averages and only apply the strategy when the trend is clear.
-
Perform secondary confirmation on the Stochastic KD bullish crossover signal, such as checking if the K value is in the low range.
-
Optimize the parameters of Bollinger Bands and Stochastic KD to find the best combination.
-
Incorporate position sizing and money management modules into the strategy, such as using the Kelly Criterion to calculate position size and setting overall stop-loss levels.
-
Perform parameter optimization and backtesting for different markets and timeframes separately to improve the strategy's adaptability.
Conclusion
This article introduces a trading strategy based on Bollinger Bands and Stochastic KD. The strategy determines entry and exit points by comparing the price's position relative to the Bollinger Bands and the crossover signals of the Stochastic KD, aiming to capture the rebound after oversold conditions while controlling drawdown risk. The strategy's advantages lie in its ability to dynamically depict the relative high and low levels of price and make decisions based on the overbought and oversold status of the price, providing clear and complementary signals. However, the strategy also has certain limitations, such as underperforming in range-bound markets, the possibility of false signals from Stochastic KD, and lack of position sizing, among others. In the future, the strategy can be refined in terms of trend identification, signal confirmation, parameter optimization, and money management to improve its adaptability and robustness. Overall, the strategy provides an idea of combining Bollinger Bands and Stochastic KD, but it needs to be adjusted and optimized according to specific market characteristics and risk preferences when applied to real trading. [/trans]
Strategy Arguments
| Argument | Default | Description |
|---|---|---|
| v_input_1 | 14 | Bollinger Bands Length |
| v_input_2 | 2 | Bollinger Bands Multiplier |
| v_input_3 | 14 | KD Length |
| v_input_4 | 3 | KD Smooth |
| v_input_5 | 3 | KD D |
Source (PineScript)
/*backtest
start: 2023-03-02 00:00:00
end: 2024-03-07 00:00:00
period: 1d
basePeriod: 1h
exchanges: [{"eid":"Futures_Binance","currency":"BTC_USDT"}]
*/

//@version=5
strategy("Bollinger Bands and KD Strategy with Take Profit", overlay=true)

// 輸入參數
length = input(14, title="Bollinger Bands Length")
mult = input(2, title="Bollinger Bands Multiplier")
kdLength = input(14, title="KD Length")
kdSmooth = input(3, title="KD Smooth")
kdD = input(3, title="KD D")

// 計算布林通道
basis = ta.sma(close, length)
upper_band = basis + mult * ta.stdev(close, length)
lower_band = basis - mult * ta.stdev(close, length)

// 計算KD指標
k = ta.stoch(close, high, low, kdLength)
d = ta.sma(k, kdSmooth)  // 使用sma計算KD D

// 判斷進出點的條件
price_below_lower_band = close < lower_band
cross_above_kd = ta.crossover(k, d)
price_above_upper_band = close > upper_band
cross_below_basis = ta.crossunder(close, basis)

// 策略進出點
if (price_below_lower_band and cross_above_kd)
    strategy.entry("Buy", strategy.long)
if (cross_below_basis or price_above_upper_band)
    strategy.close("Buy")

// 繪製布林通道
plot(upper_band, color=color.blue, title="Upper Band")
plot(lower_band, color=color.red, title="Lower Band")
plot(basis, color=color.green, title="Basis")

// 繪製KD指標
hline(80, "Overbought", color=color.red)
hline(20, "Oversold", color=color.green)
plot(k, color=color.blue, title="K")
plot(d, color=color.red, title="D")
Detail
https://www.fmz.com/strategy/444025
Last Modified
2024-03-08 16:49:06