
17 KiB
Name
市场结构突破与成交量峰值RSI多重指标交叉策略-Market-Structure-Breakthrough-with-Volume-Spike-and-RSI-Confluence-Strategy
Author
ianzeng123
Strategy Description
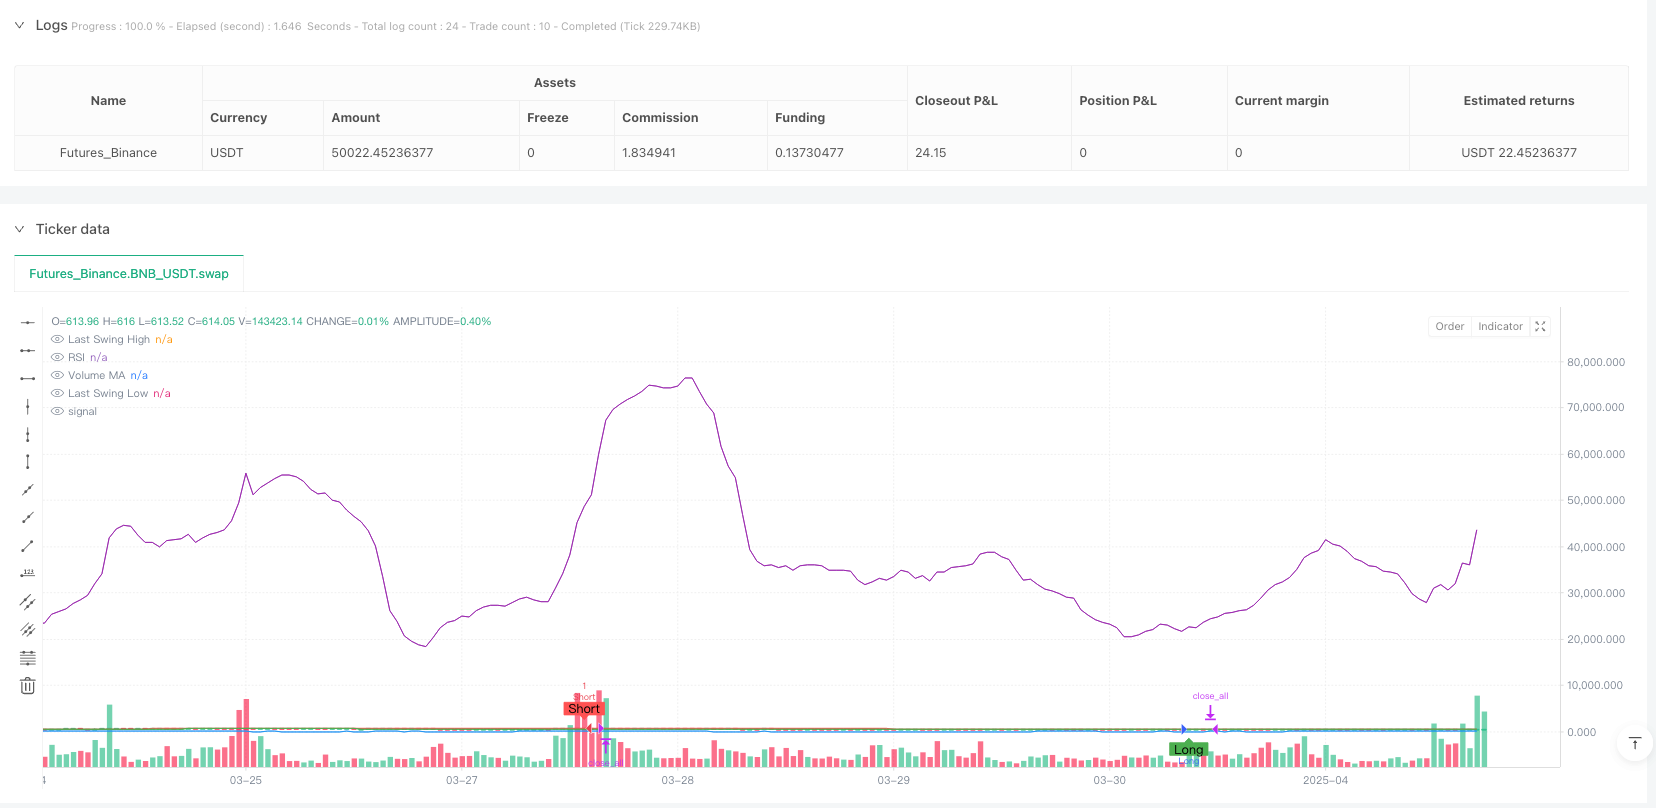
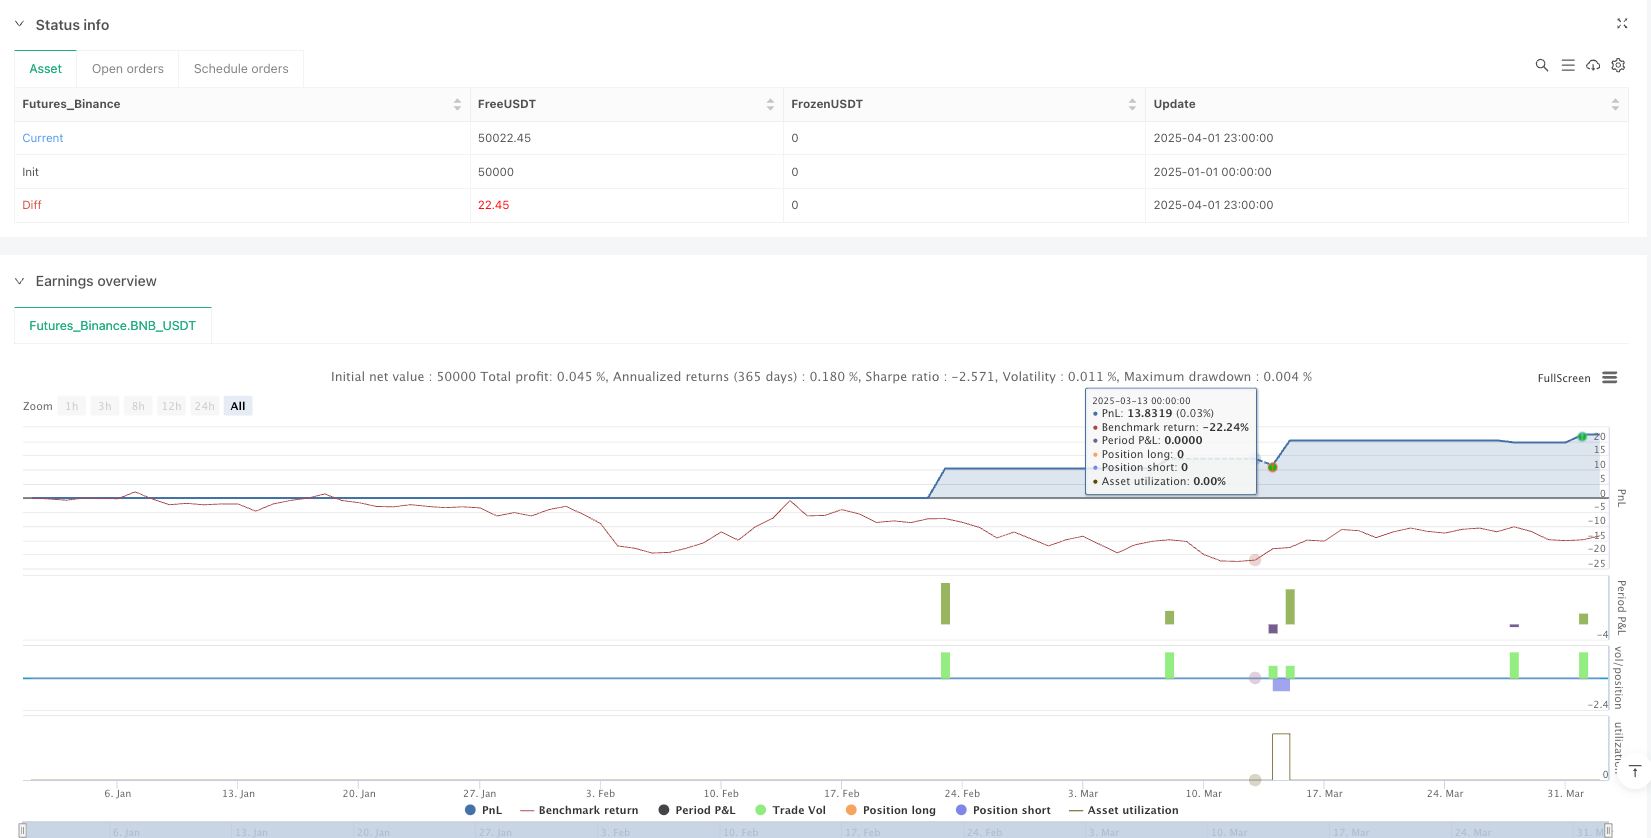
[trans]
概述
"市场结构突破与成交量峰值、RSI多重指标交叉策略"是一种结合市场结构(SMC)、成交量突破和相对强弱指数(RSI)的多重指标交易策略。该策略主要通过识别关键的波动点(swing points)来分析市场结构,并在结构突破时结合成交量峰值和RSI指标确认交易信号。策略设计目的是识别潜在的市场反转或突破点,提供更加精确的交易入场时机,减少假突破带来的风险。
策略原理
该策略的核心原理是通过多重指标的共振来确认交易信号的有效性。策略运作流程如下:
- 波动点识别: 使用pivot函数识别市场中的波动高点(pivot high)和波动低点(pivot low),通过参数
swing_len控制回溯周期。 - 市场结构分析: 持续记录并更新最近确认的波动高点和低点,这些点位构成了市场的结构支撑和阻力区域。
- 成交量确认: 计算成交量的简单移动平均线(SMA),识别成交量突破情况,当当前成交量大于平均成交量的指定倍数时,判定为成交量峰值。
- RSI过滤: 利用相对强弱指数(RSI)作为额外的过滤条件,增强信号的可靠性。
- 交易信号生成:
- 多头信号: 价格突破上一个波动低点(结构突破),伴随成交量峰值,且RSI低于50(表明可能的超卖状态)
- 空头信号: 价格跌破上一个波动高点(结构突破),伴随成交量峰值,且RSI高于50(表明可能的超买状态)
- 持仓管理: 采用固定持仓周期策略,在交易开始后持有指定的K线数量(holdBars)后平仓。
策略优势
- 结构化的市场分析: 策略通过识别关键的波动点,为交易者提供清晰的市场结构视角,有助于理解价格走势的本质。
- 多重指标确认: 结合成交量和RSI指标进行信号确认,大大降低了假突破的风险,提高了交易信号的质量。
- 成交量验证: 成交量是价格移动背后的动力,成交量峰值的要求确保了有足够的市场参与度支持价格突破。
- RSI对立面确认: 策略中的RSI设置(多头信号要求RSI<50,空头信号要求RSI>50)提供了一种逆向思维的确认机制,有助于捕捉超买超卖反弹的机会。
- 明确的持仓期限: 固定持仓周期避免了主观判断退出时机的困难,同时也限制了单笔交易的风险暴露时间。
- 高度可定制: 策略提供多个可调参数,包括波动点回溯周期、成交量均线长度、成交量倍数、RSI周期和持仓周期等,使交易者可以根据不同市场和时间框架进行优化。
策略风险
- 假突破风险: 尽管策略使用多重指标确认,市场仍可能出现假突破情况,特别是在波动较大的市场环境中。
- 解决方法: 可以考虑增加额外的确认指标或增加突破确认的K线数量。
- 固定持仓期限的局限性: 固定持仓周期可能导致在趋势尚未完全展开时过早退出,或在趋势反转后仍然持仓。
- 解决方法: 考虑引入动态的退出机制,如追踪止损或基于技术指标的退出信号。
- 参数优化陷阱: 过度优化参数可能导致策略在历史数据上表现良好但在实盘中表现不佳。
- 解决方法: 进行稳健的参数优化,使用足够长的回测周期,并在不同市场环境中测试策略的鲁棒性。
- 缺少止损机制: 当前策略没有明确的止损机制,可能导致单笔交易的损失过大。
- 解决方法: 增加基于波动率或固定百分比的止损机制。
- 交易频率问题: 根据参数设置,策略可能在某些市场条件下产生过多或过少的信号。
- 解决方法: 调整参数以适应特定市场的波动特性,或增加交易频率控制机制。
策略优化方向
-
动态退出机制: 当前策略使用固定持仓周期退出,可以考虑引入更加动态的退出机制:
- 追踪止损: 根据市场结构或ATR(Average True Range)设置动态止损线。
- 反向信号退出: 当出现与当前持仓方向相反的信号时退出。
- 利润目标: 基于市场结构或关键阻力/支撑位设置利润目标。
-
风险管理完善:
- 引入止损机制: 基于波动率(如ATR的倍数)或固定百分比设置止损。
- 仓位管理: 根据市场波动性或信号强度调整仓位大小。
- 风险控制: 限制每日/每周最大交易次数和最大风险敞口。
-
信号质量增强:
- 趋势过滤: 增加长期趋势判断,仅在趋势方向上开仓。
- 时间过滤: 避免在重要经济数据发布前后交易。
- 波动率过滤: 在过高或过低波动率环境下调整策略参数或暂停交易。
-
多时间周期确认:
- 引入更长时间周期的市场结构分析,仅在多个时间周期结构一致时交易。
- 这样优化可以减少噪音交易,提高大趋势捕捉能力。
-
机器学习增强:
- 使用机器学习算法优化参数选择,根据不同市场环境自动调整策略参数。
- 引入模式识别算法,增强市场结构识别的准确性。
总结
"市场结构突破与成交量峰值、RSI多重指标交叉策略"是一种综合性强的交易系统,它通过结合市场结构分析、成交量确认和RSI指标过滤,提供了一套系统化的交易方法。该策略的核心优势在于多重指标的共振确认,大大提高了交易信号的可靠性。
策略的主要特点是使用swing points来识别市场关键结构,然后在价格突破这些结构时,结合成交量峰值和RSI指标进行交易确认。这种方法不仅能捕捉市场结构的变化,还能通过成交量和RSI的辅助确认减少假突破的风险。
尽管如此,该策略仍有优化空间,特别是在退出机制、风险管理和信号质量方面。通过引入更加动态的退出策略、完善风险管理系统和增强信号过滤机制,可以进一步提升策略的稳健性和盈利能力。
最重要的是,交易者在使用该策略时应该理解其背后的市场结构理念,而不仅仅是机械地遵循信号。理解市场结构变化的本质,结合成交量和RSI指标的辅助分析,才能真正发挥该策略的潜力。 ||
Overview
The "Market Structure Breakthrough with Volume Spike and RSI Confluence Strategy" is a multi-indicator trading approach that combines Smart Money Concept (SMC), volume breakouts, and Relative Strength Index (RSI) confirmation. This strategy primarily analyzes market structure by identifying key swing points and confirms trading signals when structural breakouts occur along with volume spikes and RSI validation. The strategy aims to identify potential market reversals or breakout points, providing more precise entry timing while reducing the risk of false breakouts.
Strategy Principles
The core principle of this strategy is to confirm trading signals through the resonance of multiple indicators. The operational flow is as follows:
- Swing Point Identification: Uses pivot functions to identify swing highs and swing lows in the market, controlled by the
swing_lenparameter that determines the lookback period. - Market Structure Analysis: Continuously records and updates the most recently confirmed swing highs and lows, which form structural support and resistance areas in the market.
- Volume Confirmation: Calculates the Simple Moving Average (SMA) of volume and identifies volume spikes when current volume exceeds the average by a specified multiplier.
- RSI Filtering: Utilizes the Relative Strength Index (RSI) as an additional filter condition to enhance signal reliability.
- Signal Generation:
- Long Signal: Price breaks above the previous swing low (structure break), accompanied by a volume spike, and RSI below 50 (indicating potential oversold conditions)
- Short Signal: Price breaks below the previous swing high (structure break), accompanied by a volume spike, and RSI above 50 (indicating potential overbought conditions)
- Position Management: Employs a fixed holding period strategy, closing positions after a specified number of bars (holdBars) following trade initiation.
Strategy Advantages
- Structured Market Analysis: The strategy identifies key swing points, providing traders with a clear perspective on market structure, helping to understand the essence of price movements.
- Multi-Indicator Confirmation: Combining volume and RSI indicators for signal confirmation significantly reduces the risk of false breakouts and improves signal quality.
- Volume Validation: Volume represents the driving force behind price movements, and the volume spike requirement ensures sufficient market participation to support price breakouts.
- RSI Contrarian Confirmation: The RSI settings (requiring RSI<50 for long signals and RSI>50 for short signals) provide a contrarian confirmation mechanism, helping to capture oversold/overbought rebound opportunities.
- Defined Holding Period: The fixed holding period avoids the difficulty of subjective exit timing while also limiting risk exposure time for each trade.
- Highly Customizable: The strategy offers multiple adjustable parameters, including swing point lookback period, volume MA length, volume multiplier, RSI period, and holding period, allowing traders to optimize for different markets and timeframes.
Strategy Risks
- False Breakout Risk: Despite using multiple indicators for confirmation, false breakouts can still occur, especially in highly volatile market environments.
- Solution: Consider adding additional confirmation indicators or increasing the number of candles required for breakout confirmation.
- Limitations of Fixed Holding Period: A fixed holding period may lead to exiting too early while a trend is still developing, or remaining in position after a trend reversal.
- Solution: Consider introducing dynamic exit mechanisms such as trailing stops or technical indicator-based exit signals.
- Parameter Optimization Trap: Excessive parameter optimization may lead to strategies that perform well on historical data but poorly in live trading.
- Solution: Conduct robust parameter optimization using sufficiently long backtest periods and test strategy robustness across different market environments.
- Lack of Stop-Loss Mechanism: The current strategy lacks an explicit stop-loss mechanism, potentially leading to excessive losses on individual trades.
- Solution: Add stop-loss mechanisms based on volatility or fixed percentage.
- Trading Frequency Issues: Depending on parameter settings, the strategy may generate too many or too few signals under certain market conditions.
- Solution: Adjust parameters to adapt to the specific volatility characteristics of markets or add frequency control mechanisms.
Strategy Optimization Directions
-
Dynamic Exit Mechanisms: The current strategy uses a fixed holding period for exits; consider introducing more dynamic exit mechanisms:
- Trailing Stop: Set dynamic stop-loss lines based on market structure or ATR (Average True Range).
- Reverse Signal Exit: Exit when signals opposite to the current position direction appear.
- Profit Targets: Set profit targets based on market structure or key resistance/support levels.
-
Risk Management Improvements:
- Introduce Stop-Loss Mechanisms: Based on volatility (such as ATR multiples) or fixed percentages.
- Position Sizing: Adjust position size based on market volatility or signal strength.
- Risk Control: Limit the maximum number of trades per day/week and maximum risk exposure.
-
Signal Quality Enhancement:
- Trend Filtering: Add long-term trend determination, only opening positions in the trend direction.
- Time Filtering: Avoid trading before and after important economic data releases.
- Volatility Filtering: Adjust strategy parameters or pause trading in environments with excessively high or low volatility.
-
Multi-Timeframe Confirmation:
- Introduce market structure analysis from longer timeframes, only trading when structures align across multiple timeframes.
- This optimization can reduce noise trades and improve the ability to capture major trends.
-
Machine Learning Enhancement:
- Use machine learning algorithms to optimize parameter selection, automatically adjusting strategy parameters based on different market environments.
- Introduce pattern recognition algorithms to enhance the accuracy of market structure identification.
Summary
The "Market Structure Breakthrough with Volume Spike and RSI Confluence Strategy" is a comprehensive trading system that provides a systematic trading approach by combining market structure analysis, volume confirmation, and RSI indicator filtering. The core advantage of this strategy lies in the resonance confirmation of multiple indicators, greatly improving the reliability of trading signals.
The main feature of the strategy is using swing points to identify key market structures, then confirming trades when prices break through these structures, combined with volume spikes and RSI indicator validation. This approach not only captures changes in market structure but also reduces the risk of false breakouts through auxiliary confirmation from volume and RSI.
Nevertheless, the strategy still has room for optimization, particularly in exit mechanisms, risk management, and signal quality. By introducing more dynamic exit strategies, improving risk management systems, and enhancing signal filtering mechanisms, the robustness and profitability of the strategy can be further improved.
Most importantly, traders using this strategy should understand the market structure concepts behind it, rather than mechanically following signals. Understanding the essence of market structure changes, combined with auxiliary analysis from volume and RSI indicators, is key to truly unleashing the potential of this strategy. [/trans]
Source (PineScript)
/*backtest
start: 2025-01-01 00:00:00
end: 2025-04-02 00:00:00
period: 1h
basePeriod: 1h
exchanges: [{"eid":"Futures_Binance","currency":"BNB_USDT"}]
*/

//@version=5
strategy("SMC Structure Break with Volume Spike + RSI Confluence", overlay=true, initial_capital=100000, currency=currency.USD)

// ===== INPUTS =====
swing_len   = input.int(5, "Swing Lookback Length", minval=2)
vol_len     = input.int(20, "Volume MA Length", minval=1)
vol_mult    = input.float(2.0, "Volume Spike Multiplier", minval=1.0)
holdBars    = input.int(3, "Bars to Hold Trade", minval=1)
rsi_length  = input.int(14, "RSI Length", minval=1)

// ===== CALCULATIONS =====
// Calculate average volume and volume spike condition
vol_avg   = ta.sma(volume, vol_len)
vol_spike = volume > vol_avg * vol_mult

// Calculate RSI value
rsi_val = ta.rsi(close, rsi_length)

// Detect swing highs and swing lows using pivot functions
pivot_high = ta.pivothigh(high, swing_len, swing_len)
pivot_low  = ta.pivotlow(low, swing_len, swing_len)

// Use persistent variables to store the last confirmed swing high and swing low
var float last_swing_high = na
var float last_swing_low  = na

if not na(pivot_high)
    last_swing_high := pivot_high
if not na(pivot_low)
    last_swing_low := pivot_low

// ===== ENTRY CONDITIONS =====
// Long entry: structure break above last swing low, volume spike, and RSI below 50
long_condition = not na(last_swing_low) and (close > last_swing_low) and (close[1] <= last_swing_low) and vol_spike and (rsi_val < 50)
// Short entry: structure break below last swing high, volume spike, and RSI above 50
short_condition = not na(last_swing_high) and (close < last_swing_high) and (close[1] >= last_swing_high) and vol_spike and (rsi_val > 50)

// Persistent variable to store the bar index when a trade is entered
var int entryBar = na

// Reset entryBar when flat
if strategy.position_size == 0
    entryBar := na

// Execute trades only when no position is held
if strategy.position_size == 0
    if long_condition
        strategy.entry("Long", strategy.long)
        entryBar := bar_index
    if short_condition
        strategy.entry("Short", strategy.short)
        entryBar := bar_index

// ===== EXIT LOGIC =====
// Exit the trade after the specified number of bars (holdBars) since entry.
if strategy.position_size != 0 and not na(entryBar)
    if (bar_index - entryBar) >= holdBars
        strategy.close_all("Hold Time Reached")
        entryBar := na

// ===== PLOTS =====
plot(last_swing_high, color=color.red, title="Last Swing High")
plot(last_swing_low, color=color.green, title="Last Swing Low")
plot(vol_avg, title="Volume MA", color=color.purple)
plot(rsi_val, title="RSI", color=color.blue)
plotshape(long_condition, title="Long Signal", location=location.belowbar, color=color.green, style=shape.labelup, text="Long")
plotshape(short_condition, title="Short Signal", location=location.abovebar, color=color.red, style=shape.labeldown, text="Short")
Detail
https://www.fmz.com/strategy/489280
Last Modified
2025-04-03 10:23:22