
7.8 KiB
Name
市云转向指标改良型多空交叉交易策略-Enhanced-Ichimoku-Cloud-Trading-Strategy-with-Dynamic-Crossover-Signals
Author
ianzeng123
Strategy Description
[trans]
概述
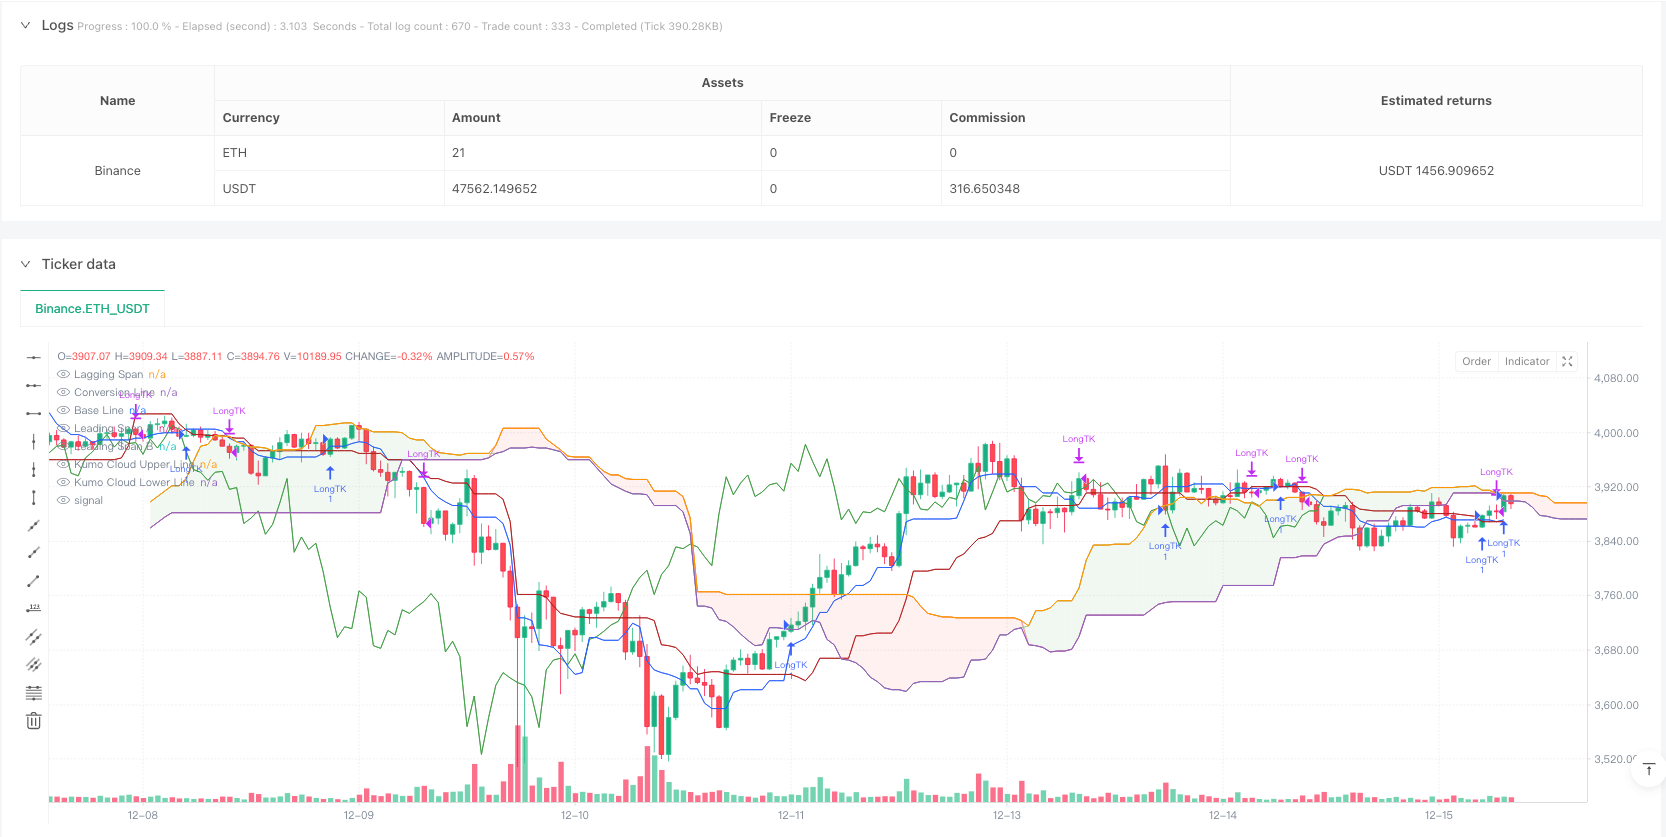
该策略是基于经典市云转向系统(Ichimoku Kinko Hyo)的改良版本,通过转换线与基准线的动态交叉来识别交易信号。策略在传统的市云系统基础上,增加了自动交易信号的生成和执行逻辑,并配合可视化标签来提高市场趋势的可读性。
策略原理
策略的核心是基于市云系统的五条主要曲线:转换线(9周期)、基准线(26周期)、领先线A、领先线B(52周期)和滞后线。其中最关键的交易信号来自于转换线与基准线的交叉。当转换线上穿基准线时产生做多信号,下穿时平仓。策略使用了动态唐奇安通道来计算各条线,通过取最高价和最低价的平均值来反映价格波动。
策略优势
- 系统化的趋势跟踪 - 通过多重时间框架的指标组合,能够全面捕捉市场趋势。
- 视觉直观 - 使用颜色标签和云图显示,交易信号清晰可见。
- 风险管理集成 - 具有内置的止损机制,当市场反转时自动平仓。
- 适应性强 - 参数可调整,能够适应不同市场环境。
- 信号稳定 - 使用均线交叉来过滤虚假信号,提高交易质量。
策略风险
- 趋势反转延迟 - 由于使用了移动平均线,存在一定的滞后性。
- 震荡市不适用 - 在横盘整理阶段可能产生虚假信号。
- 参数敏感性 - 不同的参数设置会显著影响策略表现。
- 云图复杂性 - 多条线路的交织可能造成信号解读困难。
策略优化方向
- 引入波动率过滤 - 可以添加ATR指标来调整仓位大小。
- 优化进场时机 - 结合RSI等动量指标来确认交易信号。
- 完善止损机制 - 可以设置基于云图支撑位的动态止损。
- 增加交易量确认 - 在信号生成时检查交易量,提高可靠性。
- 添加市场环境过滤 - 通过趋势强度指标来选择适合的交易环境。
总结
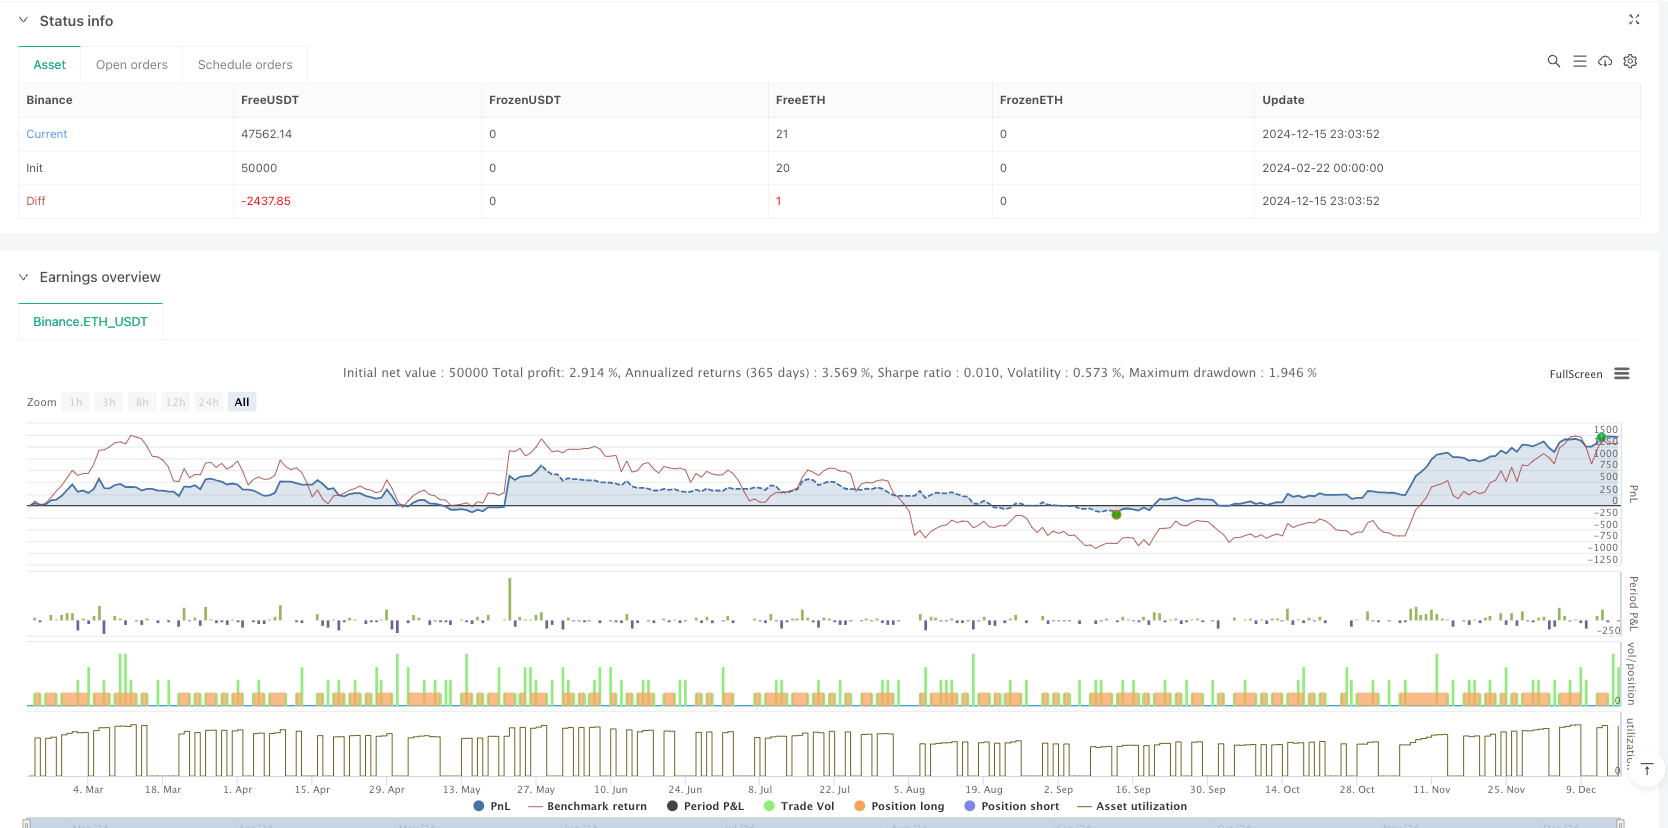
该策略通过改良传统市云系统,构建了一个完整的趋势跟踪交易系统。虽然存在一定的滞后性,但通过信号过滤和风险管理的优化,能够在趋势市场中获得稳定表现。建议交易者在实盘使用时,结合市场环境和个人风险偏好来调整参数,并持续监控策略表现。 ||
Overview
This strategy is an enhanced version of the classic Ichimoku Kinko Hyo system, utilizing dynamic crossovers between the Conversion and Base lines to identify trading signals. It incorporates automated trading signal generation and execution logic, along with visual labels to improve trend readability.
Strategy Principles
The strategy is built upon the five main lines of the Ichimoku system: Conversion Line (9 periods), Base Line (26 periods), Leading Span A, Leading Span B (52 periods), and Lagging Span. The primary trading signals are generated from crossovers between the Conversion and Base lines. Long positions are entered when the Conversion Line crosses above the Base Line and closed when it crosses below. The strategy employs dynamic Donchian channels to calculate each line by averaging the highest and lowest prices to reflect price volatility.
Strategy Advantages
- Systematic Trend Following - Combines multiple timeframe indicators for comprehensive trend capture.
- Visual Clarity - Utilizes color labels and cloud visualization for clear signal identification.
- Integrated Risk Management - Features built-in stop-loss mechanisms for automatic position closure on market reversals.
- High Adaptability - Adjustable parameters allow adaptation to different market conditions.
- Signal Stability - Uses moving average crossovers to filter false signals and improve trade quality.
Strategy Risks
- Trend Reversal Delay - Inherent lag due to moving average calculations.
- Poor Performance in Ranging Markets - May generate false signals during consolidation phases.
- Parameter Sensitivity - Strategy performance significantly affected by parameter settings.
- Cloud Complexity - Multiple intersecting lines may complicate signal interpretation.
Optimization Directions
- Volatility Filtering - Incorporate ATR indicator for position sizing adjustment.
- Entry Timing Enhancement - Integrate momentum indicators like RSI for signal confirmation.
- Stop-Loss Refinement - Implement dynamic stop-loss based on cloud support levels.
- Volume Confirmation - Add volume analysis for signal validation.
- Market Environment Filtering - Include trend strength indicators for market condition selection.
Summary
This strategy enhances the traditional Ichimoku system to create a comprehensive trend-following trading system. While it exhibits some lag, optimization through signal filtering and risk management enables stable performance in trending markets. Traders should adjust parameters based on market conditions and risk preferences while continuously monitoring strategy performance.[/trans]
Source (PineScript)
/*backtest
start: 2024-02-22 00:00:00
end: 2024-12-16 00:00:00
period: 1h
basePeriod: 1h
exchanges: [{"eid":"Binance","currency":"ETH_USDT"}]
*/

//@version=6

strategy(title="Ichimoku Cloud with Lables", shorttitle="Ichimoku", overlay=true)
conversionPeriods = input.int(9, minval=1, title="Conversion Line Length")
basePeriods = input.int(26, minval=1, title="Base Line Length")
laggingSpan2Periods = input.int(52, minval=1, title="Leading Span B Length")
displacement = input.int(26, minval=1, title="Lagging Span")
donchian(len) => math.avg(ta.lowest(len), ta.highest(len))
conversionLine = donchian(conversionPeriods)
baseLine = donchian(basePeriods)
leadLine1 = math.avg(conversionLine, baseLine)
leadLine2 = donchian(laggingSpan2Periods)
plot(conversionLine, color=#2962FF, title="Conversion Line")
plot(baseLine, color=#B71C1C, title="Base Line")


plot(close, offset = -displacement + 1, color=#43A047, title="Lagging Span", display = display.none)
p1 = plot(leadLine1, offset = displacement - 1, color=#A5D6A7,
	 title="Leading Span A")
p2 = plot(leadLine2, offset = displacement - 1, color=#EF9A9A,
	 title="Leading Span B")
plot(leadLine1 > leadLine2 ? leadLine1 : leadLine2, offset = displacement - 1, title = "Kumo Cloud Upper Line", display = display.none)
plot(leadLine1 < leadLine2 ? leadLine1 : leadLine2, offset = displacement - 1, title = "Kumo Cloud Lower Line", display = display.none)
fill(p1, p2, color = leadLine1 > leadLine2 ? color.rgb(67, 160, 71, 90) : color.rgb(244, 67, 54, 90))

if barstate.islast
    label.new(bar_index+5,baseLine,style=label.style_none,xloc=xloc.bar_index,text="Base",color=color.white,textcolor=#B71C1C)
    label.new(bar_index +8, conversionLine,style=label.style_none,xloc=xloc.bar_index,text="Conversion",color=color.white,textcolor=#2962FF)
	label.new(bar_index+(displacement-1)+5,leadLine1,style=label.style_none,xloc=xloc.bar_index,text="Lead1",color=color.white,textcolor=#A5D6A7)
	label.new(bar_index+(displacement-1)+5,leadLine2,style=label.style_none,xloc=xloc.bar_index,text="Lead2",color=color.white,textcolor=#EF9A9A)

// --- TRADING LOGIC ---

// 1) Detect bullish cross (Conversion crosses above Base)
longSignal = ta.crossover(conversionLine, baseLine)

// 2) Detect bearish cross (Conversion crosses below Base)
closeSignal = ta.crossunder(conversionLine, baseLine)

// 3) If bullish cross occurs, open a new long
if longSignal
    strategy.entry("LongTK", strategy.long)

// 4) If bearish cross occurs, close the open long
if closeSignal
    // Closes all orders opened with the ID "LongTK"
    strategy.close("LongTK")
Detail
https://www.fmz.com/strategy/483042
Last Modified
2025-02-21 10:41:00