
11 KiB
Name
定投Golden趋势追踪策略Golden-Trend-Tracking-Strategy-Based-on-Periodic-Investment
Author
ChaoZhang
Strategy Description
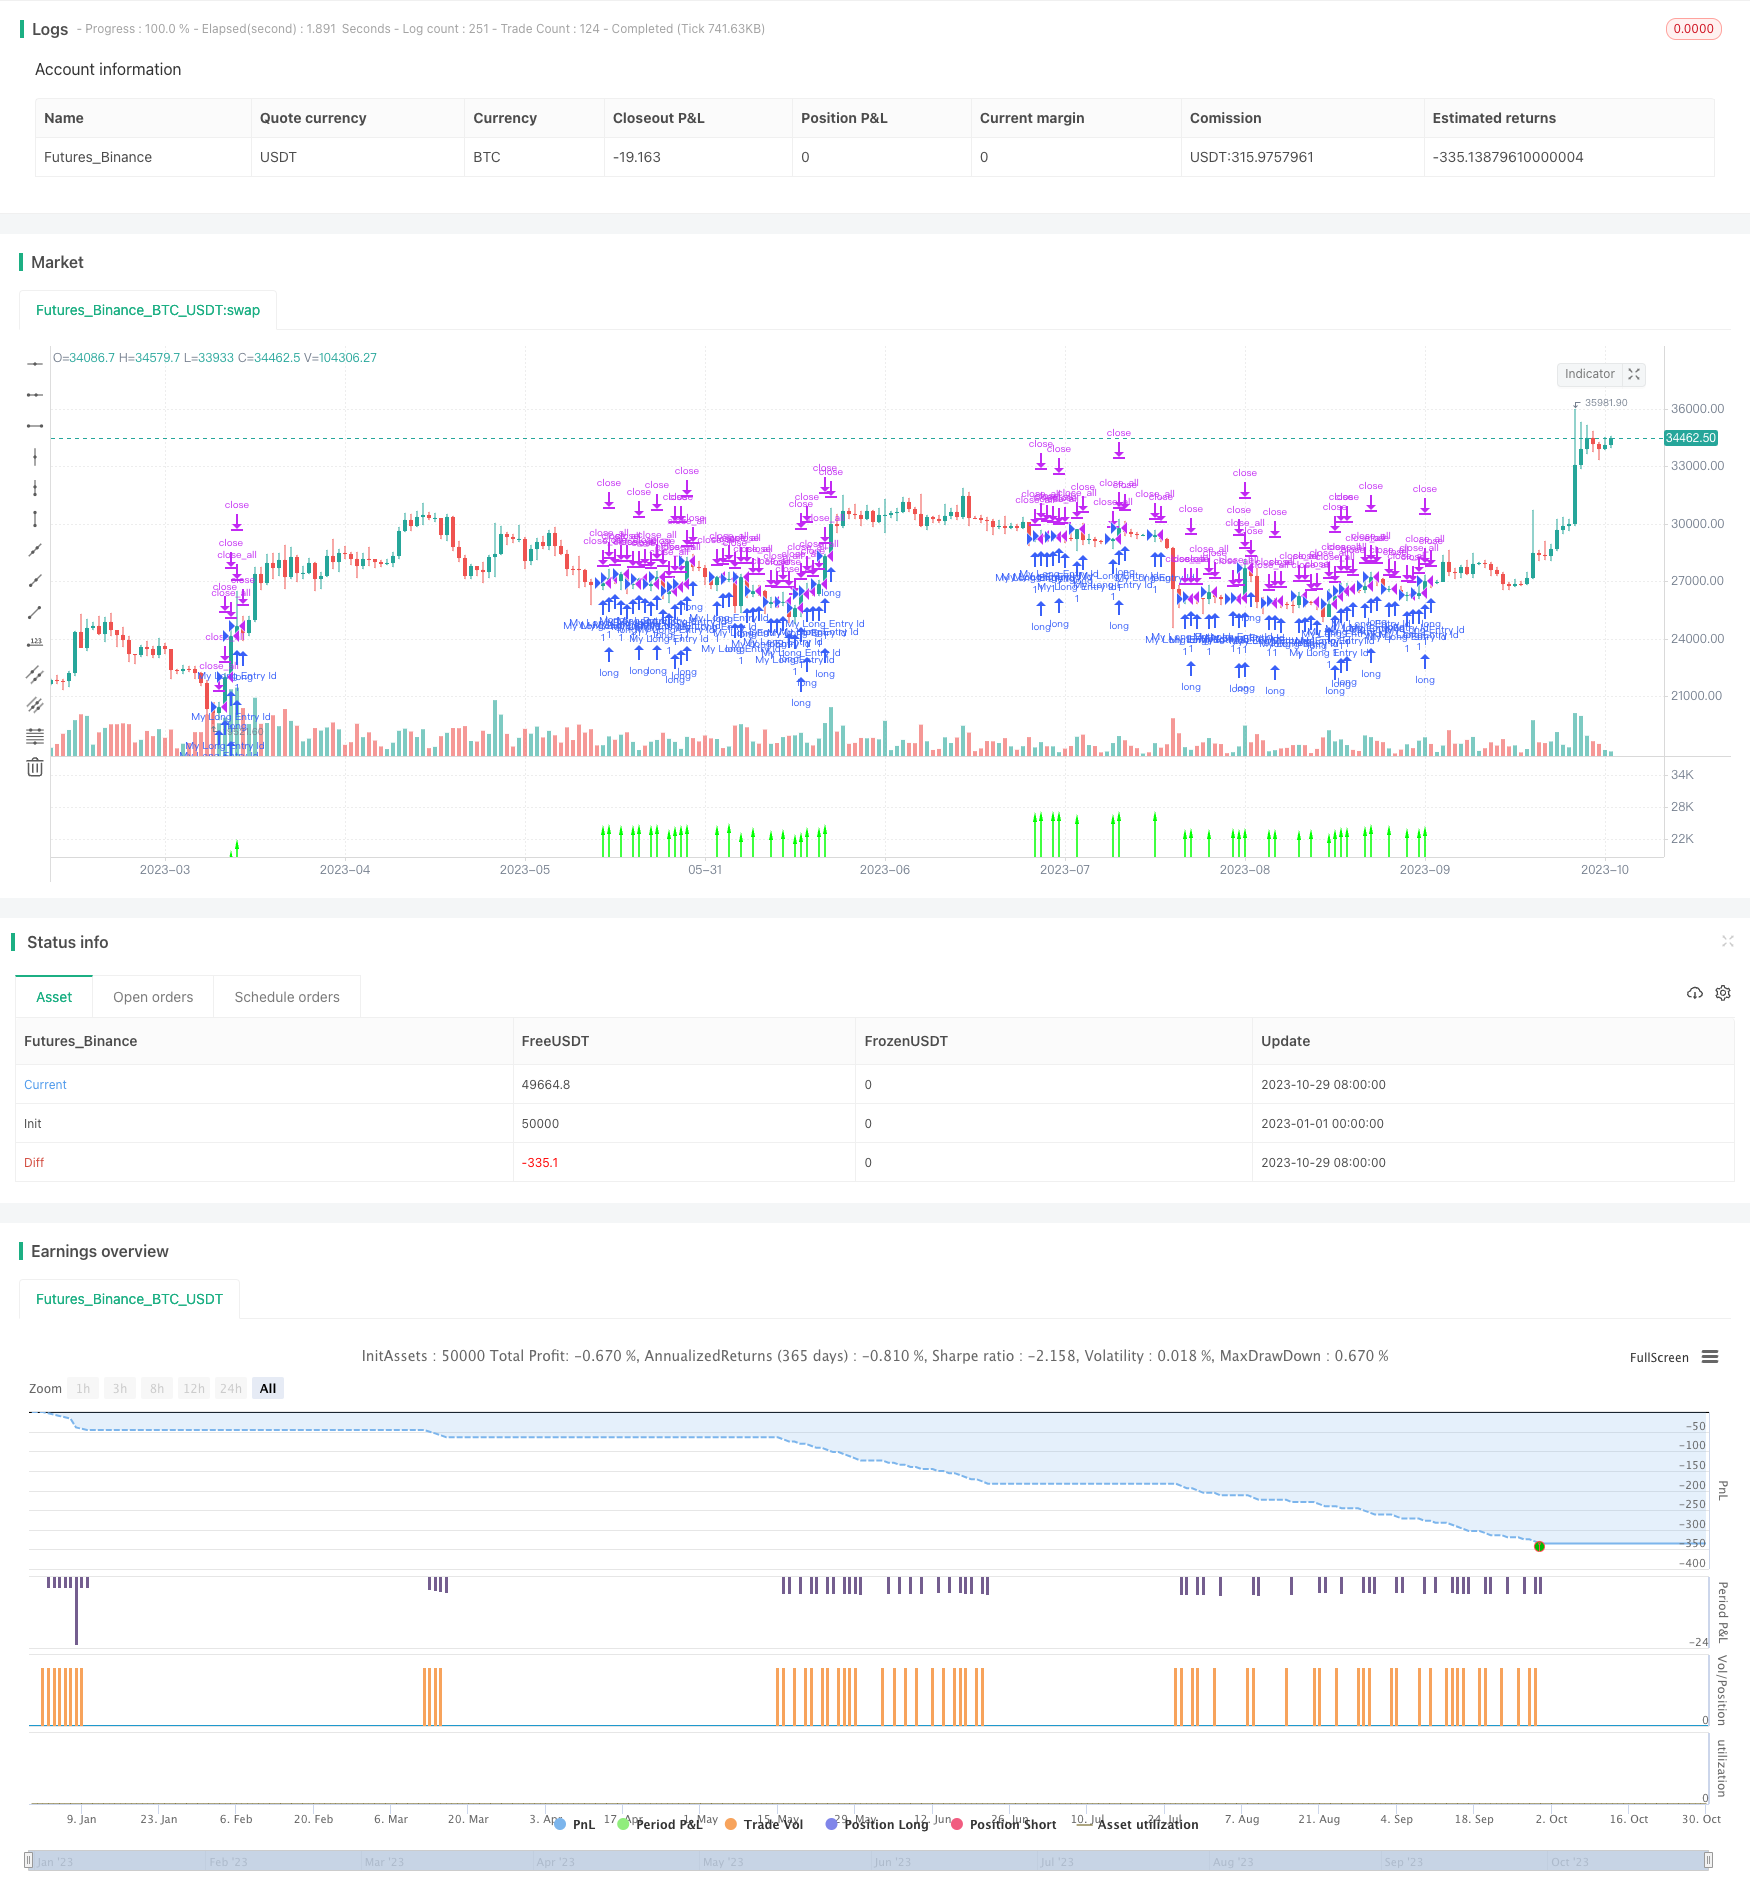
[trans]
概述
该策略运用均线模型判断市场趋势方向,在看涨趋势时定期定额建仓做多,以追踪市场Golden交叉上涨趋势的策略。
策略原理
该策略主要基于以下几点技术原理:
-
使用EMA均线判断市场趋势方向。当快速EMA线上穿慢速EMA线时,判断为看涨趋势,做多方向准备入场。
-
结合MACD指标判断入场时点。当MACD指标由正转负时,说明买盘开始减弱,做多方向入场。
-
限制每个月只能入场一次,避免追高杀跌。每次入场的数量可以固定设置。
-
可以设置起始日期和结束日期,对回测周期进行限定。当回测结束时,策略会平掉所有头寸。
具体来说,该策略首先计算快速EMA线和慢速EMA线,并检测二者金叉关系来判断市场趋势。同时计算MACD指标判断具体入场点。在二者条件成立时产生做多信号,根据限定每个月只能入场一次的规则来确定实际发出入场指令。可以预先设置每次入场的资金量。在回测结束时,策略会主动平掉所有头寸。
策略优势
这是一个较为简单直接的趋势追踪策略,具有以下几点优势:
-
使用EMA均线判断大趋势方向简单实用。EMA均线对价格变化具有一定平滑作用,可以有效过滤震荡市场的噪声。
-
MACD指标可以较为精确地判定买盘结构转弱的时点,这样入场风险较小。
-
限制每个月只做一次追涨操作,可以避免在牛市中追高杀跌。
-
允许自定义每个月入场的资金量,可以根据自己的策略灵活调整仓位。
-
可以通过起始和结束日期进行回测检验,评估策略效果。
-
当回测结束时会主动平仓,可以避免模拟交易退出市场时仍持有仓位的尴尬。
风险及对策
该策略也存在一些潜在风险,主要包括:
-
依赖均线判断趋势的方法可能会漏掉短期调整中的机会,或在趋势反转时反应不够敏捷。可以适当缩短均线周期或增加其他判决指标进行优化。
-
每月只做一次追涨操作可能会错过较好的入场时点。可以考虑放宽入场频率或在突破新高时再追入一次。
-
存在一定的回测拟合风险。应增加参数调整空间,并做跨市场和跨时间周期的稳健性测试。
-
存在追涨杀跌和超买的风险。应适当控制每月入场资金额,避免仓位过大。
优化方向
这种定投追涨策略还可以从以下几个方面进行扩展和优化:
-
增加止损 EXIT 逻辑,在市场出现明显熊头的时候主动止损。
-
在 MACD 微笑准则成立时再追加一次买入,以获取更充分的涨势曝光。
-
引入当月新增高点与前月新增高点对比的多空力道判断,评估趋势是否仍然强劲。
-
增加仓位控制逻辑。每月入场资金额可以做比例控制,而不是固定值。
-
评估不同均线组合和MACD参数对策略效果的影响。寻找最佳参数组合。
-
增加一个trailing stop跟踪止损。在价格达到一个新高后开始以一定幅度跟踪,让利润继续运行。
总结
本策略整体作为一个简单的趋势追踪策略,核心思路清晰,易于实现,适合用来检验均线趋势跟踪和定投结合的效果。可以作为量化交易入门策略之一进行学习。但实盘中需要注意控制仓位规模,并继续对策略进行优化,使其可以适应更复杂的市场环境。
||
Overview
This strategy uses moving average models to determine market trend direction. When a bullish trend is identified, it will periodically open long positions with fixed amounts to track the uptrend of golden cross in the market.
Strategy Logic
The strategy is mainly based on the following technical principles:
-
Use EMA lines to determine market trend direction. When the fast EMA line crosses over the slow EMA line, it is judged as a bullish trend and prepares to enter long positions.
-
Combine the MACD indicator to determine entry timing. When MACD turns from positive to negative, it indicates that buying power starts to weaken, so it's time to enter long positions.
-
Limit to only enter once per month to avoid chasing highs. The entry amount each time can be fixed.
-
Allow setting a start date and end date to limit the backtest period. When backtest ends, the strategy will close all positions.
Specifically, the strategy first calculates the fast EMA line and slow EMA line, and detects golden cross between them to determine the market trend. At the same time, it calculates the MACD indicator to determine specific entry point. When both criteria are met, a long signal is generated. According to the rule of only entering once per month, actual entry orders are determined. The capital amount for each entry can be preset. When the backtest ends, the strategy will actively close all positions.
Advantages
This is a simple and direct trend following strategy with the following advantages:
-
Using EMA lines to determine the major trend is simple and practical. EMA has a smoothing effect on price changes and can filter out market noise effectively.
-
The MACD indicator can identify the turning point when buying power starts to weaken relatively accurately, making entries safer.
-
Limiting to only chase the uptrend once per month can avoid chasing highs and killing the uptrend in a bull market.
-
Allow customizing the entry amount each month provides flexibility in position sizing.
-
Backtest can be used to evaluate strategy performance by setting a start date and end date.
-
It will close out all positions automatically when backtest ends, avoiding awkward remaining positions.
Risks and Mitigations
There are some potential risks of this strategy:
-
Trend determination via moving averages may miss opportunities during temporary pullbacks or react slowly on trend reversal. The period can be shortened or more indicators can be added.
-
Only entering once per month may miss better entry opportunities. Consider loosening the frequency or adding another entry when breaking recent highs.
-
There are risks of curve fitting. More parameter tuning space should be allowed and robustness should be tested across markets and time periods.
-
There are risks of chasing momentum and overbuying. The monthly entry amount should be controlled to avoid oversized positions.
Enhancement Opportunities
This periodic investment trend following strategy can be further extended and enhanced from the following aspects:
-
Add stop loss logic to actively cut losses when a bearish reversal pattern emerges.
-
Consider adding another buy when MACD histogram shows bullish divergence to get more exposure to the uptrend.
-
Introduce comparison of current month's new high vs previous month to assess the momentum strength.
-
Add position sizing logic. The monthly entry amount can be made adaptive based on percentage rather than fixed value.
-
Evaluate the impact of different MA combinations and MACD parameters. Find the optimal parameter set.
-
Add a trailing stop loss that follows the price at a certain distance after reaching new highs, allowing profits to run.
Summary
This strategy represents a simple and clean trend following approach using periodic investment and moving averages. It is easy to understand and implement, serving as a good starting point for learning algorithmic trading. But in live trading, position sizing needs to be controlled carefully. The strategy should be further enhanced to adapt to complex market conditions.
[/trans]
Strategy Arguments
| Argument | Default | Description |
|---|---|---|
| v_input_1 | 50000 | Maximum EMA Distance |
| v_input_2 | 200 | EMA Length |
| v_input_3 | true | Start Date |
| v_input_4 | true | Start Month |
| v_input_5 | 2020 | Start Year |
| v_input_6 | 12 | End Date |
| v_input_7 | 2 | End Month |
| v_input_8 | 2021 | End Year |
Source (PineScript)
/*backtest
start: 2023-01-01 00:00:00
end: 2023-10-30 00:00:00
period: 1d
basePeriod: 1h
exchanges: [{"eid":"Futures_Binance","currency":"BTC_USDT"}]
*/

// This source code is subject to the terms of the Mozilla Public License 2.0 at https://mozilla.org/MPL/2.0/
// © runescapeyttanic

//@version=4
// strategy("Buy and Hold entry finder Strategy",pyramiding=10000, overlay=true,initial_capital=0,default_qty_type=strategy.cash,default_qty_value=1000,currency = currency.EUR,commission_type=strategy.commission.cash_per_order,commission_value=0)

//INPUTS##################################################################################################################

maxEmaDistance = input(title="Maximum EMA Distance", type=input.float, step=0.01, defval=50000)
emalength = input(title="EMA Length", type=input.integer,defval=200)

// Make input options that configure backtest date range
startDate = input(title="Start Date", type=input.integer,
     defval=1, minval=1, maxval=31)
startMonth = input(title="Start Month", type=input.integer,
     defval=1, minval=1, maxval=12)
startYear = input(title="Start Year", type=input.integer,
     defval=2020, minval=1800, maxval=2100)

endDate = input(title="End Date", type=input.integer,
     defval=12, minval=1, maxval=31)
endMonth = input(title="End Month", type=input.integer,
     defval=02, minval=1, maxval=12)
endYear = input(title="End Year", type=input.integer,
     defval=2021, minval=1800, maxval=2100)

endDate1=endDate-1
//starttag
//startmonat
//MACD########################################################################################################################

fast_length=12
slow_length=26
src=close
col_macd=#0094ff
fast_ma = ema(src, fast_length)
slow_ma = ema(src, slow_length)
macd = fast_ma - slow_ma

//EMA Distance CALC########################################################################################################

ma1 =ema(close,emalength)
distFromMean = close - ma1

inDateRange = true

longCondition = (distFromMean<=maxEmaDistance and distFromMean>=distFromMean[1] and macd<=0 and inDateRange)
longnow=false

if(longCondition and strategy.position_size == 0)
    strategy.entry("My Long Entry Id", strategy.long)
    longnow:=true

if(longCondition and strategy.position_size > 0)
    longnow:=true


if(longCondition and strategy.position_size > 0 and month>valuewhen(longnow, month ,1) or longCondition and strategy.position_size > 0 and year>valuewhen(longnow, year ,1) and inDateRange)
    strategy.entry("My Long Entry Id", strategy.long)

plotchar(minute, "Minuten", "", location = location.top)

plotchar(hour, "Stunden", "", location = location.top)

plotchar(dayofmonth, "Tage", "", location = location.top)

plotchar(month, "Monat", "", location = location.top)

plotchar(year, "Jahr", "", location = location.top)

plotchar(strategy.position_size, "Positionen", "", location = location.top)

plotchar(longCondition, "Long Condition", "", location = location.top)

if true
    strategy.close_all()

//#########################################################################################################################

plotArrow = if (distFromMean<=maxEmaDistance and distFromMean>=distFromMean[1] and macd<=0)
    1
else
    0

plotarrow(series=plotArrow)
Detail
https://www.fmz.com/strategy/430674
Last Modified
2023-10-31 15:09:22