
9.6 KiB
Name
威廉姆累积-分配指标Williams-AD策略Williams-Accumulation-Distribution-Williams-AD-Strategy
Author
ChaoZhang
Strategy Description
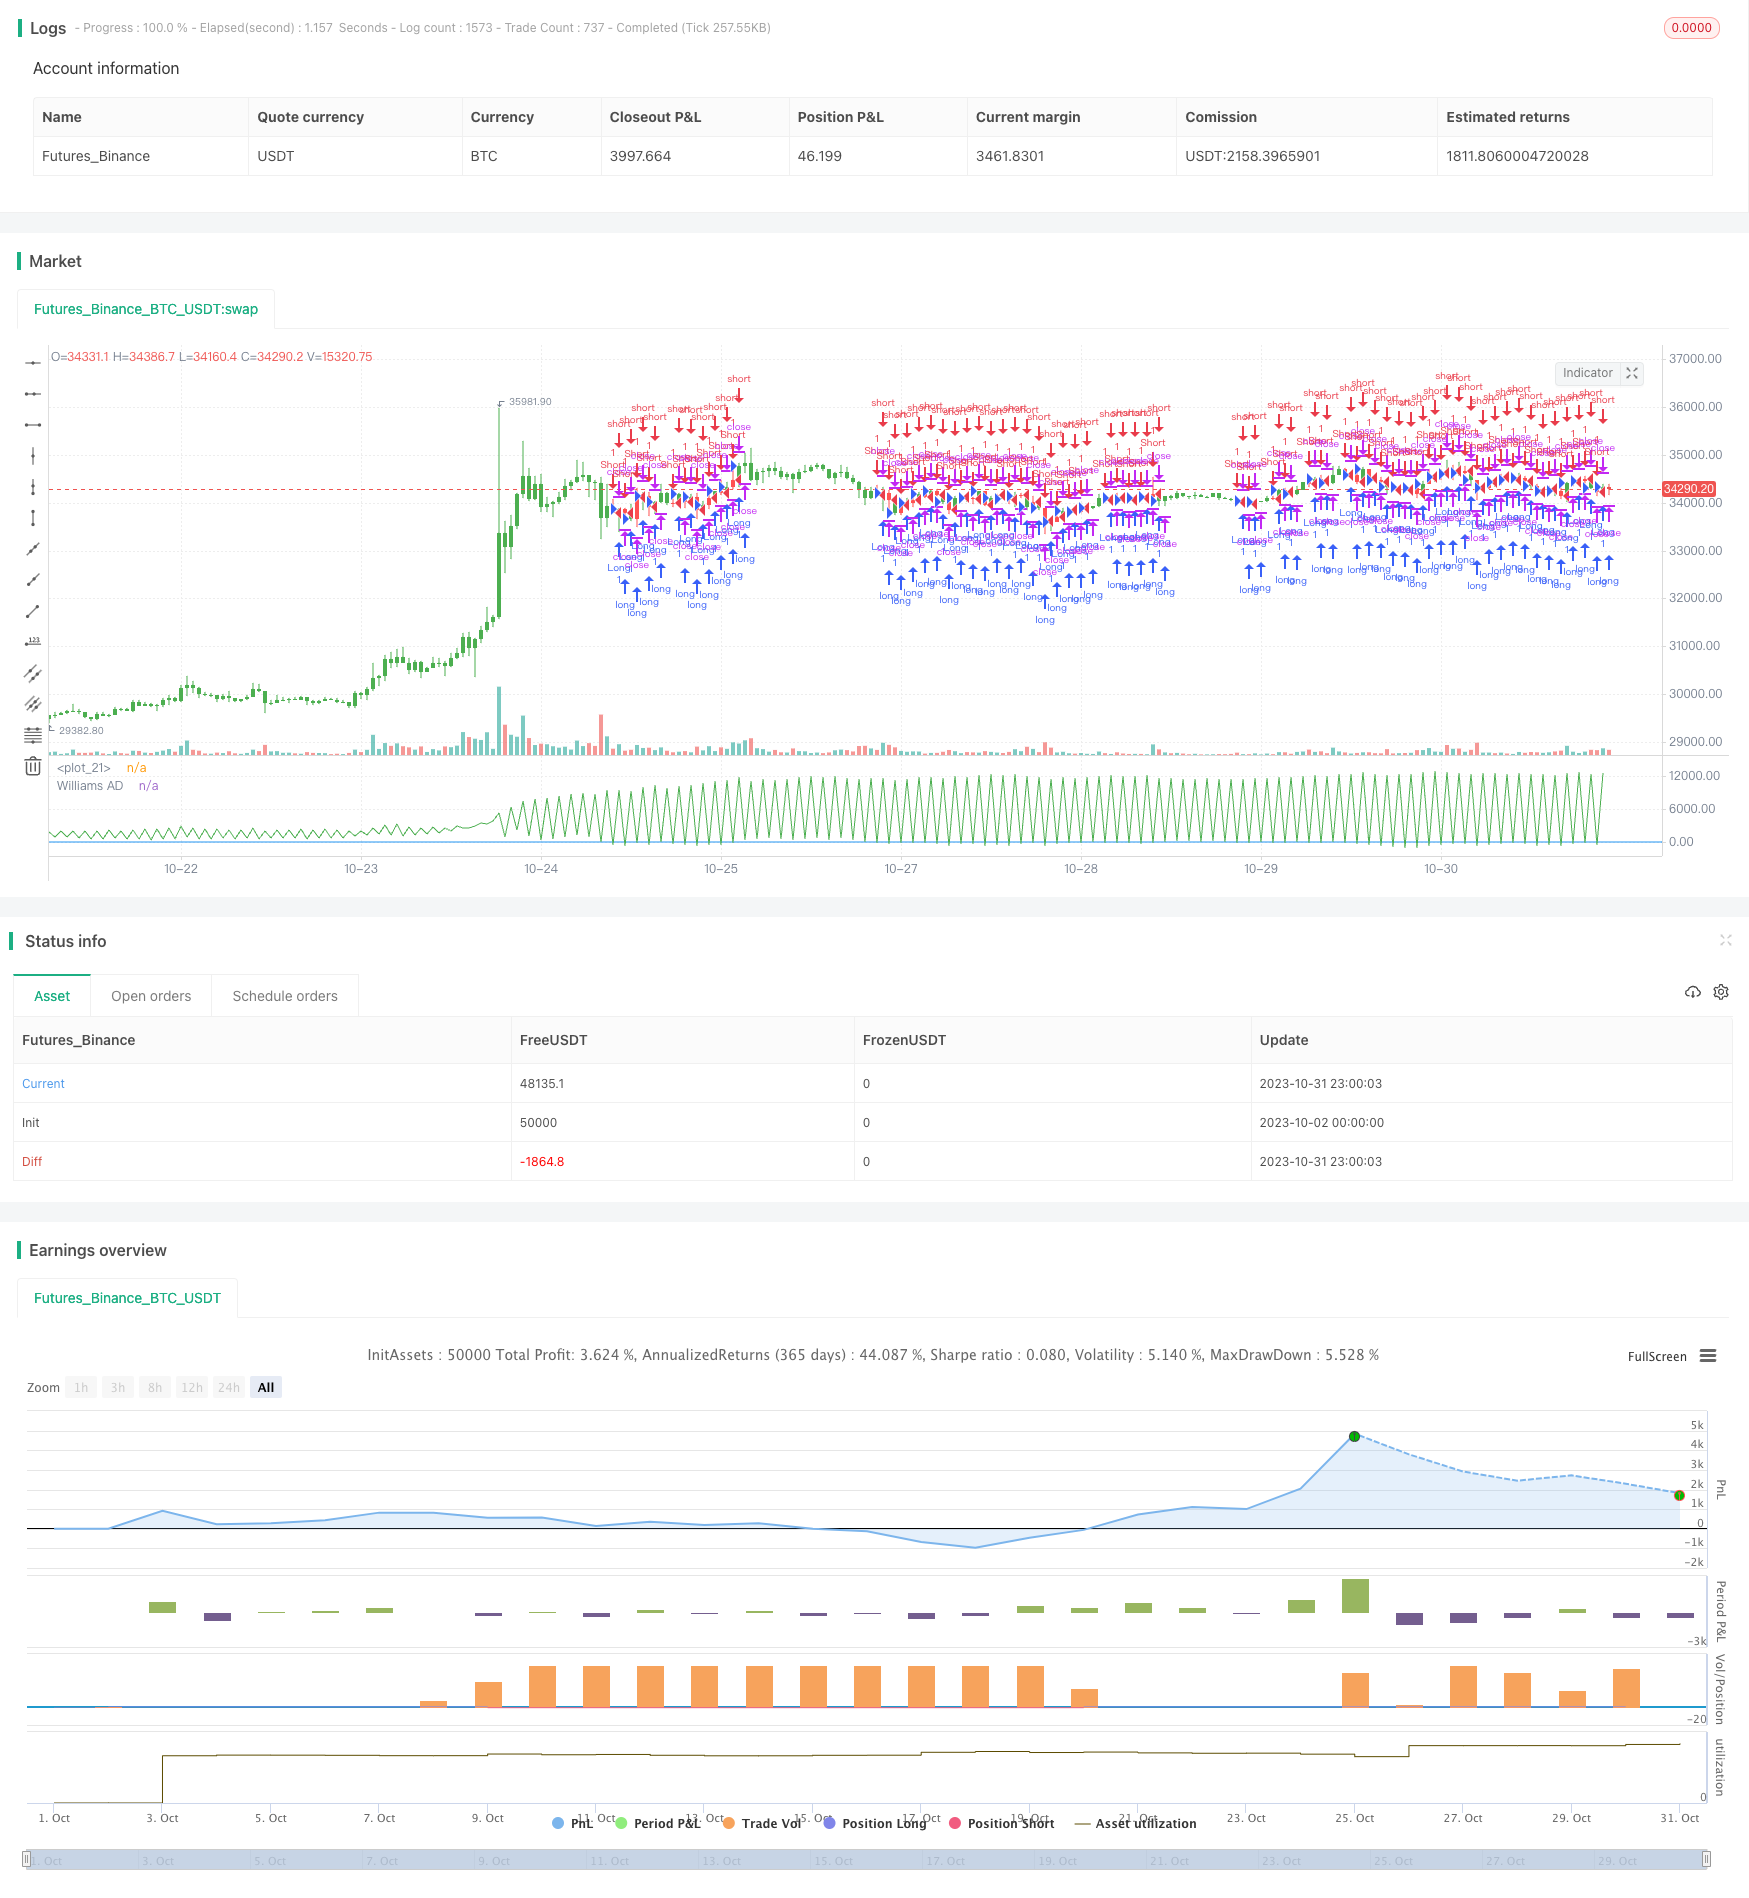
[trans]
概述
威廉姆累积/分配指标(Williams Accumulation/Distribution,简称Williams AD)是一种通过监测价格变动和交易量变化,判断市场买卖气势的技术分析指标。该指标基于威廉姆于下跌市场中,成交量通常会增大的假设。它反映了目前的市场趋势是被买方控制还是卖方控制。
该策略通过分析威廉姆累积/分配指标的值变化,判断目前趋势是处于累积阶段还是分配阶段,从而产生买入和卖出信号。
策略原理
该策略的核心指标是威廉姆累积/分配指标(Williams AD)。计算公式如下:
If Close > Previous Close
   Williams AD = Previous Williams AD + (Close - Low)
If Close < Previous Close
   Williams AD = Previous Williams AD + (Close - High)
If Close == Previous Close
   Williams AD = Previous Williams AD
其中,如果今天的收盘价高于昨天,则今天的AD值等于昨天的AD值加上“今收-今低”的差价。如果今天收盘价低于昨天,则今天的AD值等于昨天的AD值加上“今收-今高”的差价。
该指标反映了交易中的力量关系,主要判断规则如下:
- AD指标上涨,代表买方力量增加,属于累积行情。
- AD指标下跌,代表卖方力量增加,属于分配行情。
当股票价格创新高,而AD指标没有创新高时,视为分配信号,做空。当股票价格创新低,而AD指标没有创新低时,视为累积信号,做多。
根据该判断规则,该策略具体交易信号生成规则为:
- AD > 0,产生做多信号
- AD < 0,产生做空信号
并且可以通过输入参数reverse来反转做多做空方向。
策略优势分析
该策略具有以下优势:
-
利用威廉姆累积/分配指标判断市场买卖气力,可提高交易胜率。
-
指标计算方法简单,容易实现。
-
可通过反转参数,灵活适应不同行情。
-
通过监测指标和价格的背离,可产生较准确的交易信号。
-
可清晰直观地通过K线颜色展示目前市场气势。
风险分析
该策略也存在以下风险:
-
威廉姆累积/分配指标存在滞后,可能产生错误信号。
-
仅依靠一个指标易受假突破等因素影响,信号产生过于频繁。
-
参数设置不当可能导致过于频繁交易。
-
需要同时结合其他因素确定买卖时机。
-
牛熊转换时,指标判断可能存在误区。
可通过优化参数设置、结合多个指标确认、适当过滤交易次数等方式降低风险。
策略优化方向
该策略可以从以下方面进行优化:
-
增加参数进行优化,如设置交易区间、交易频率等。
-
结合其他指标进行滤波,避免错误信号,如量价指标、移动平均线等。
-
增加止损策略,以控制单笔损失。
-
进行参数训练,寻找最优参数组合。
-
结合机器学习算法实现动态参数优化。
-
在不同品种、周期等市场环境中测试策略健壮性。
-
构建模拟交易系统进行回测,评估策略风险收益情况。
总结
威廉姆累积/分配指标策略通过指标的多空变化判断市场气力方向,具有交易信号生成简单、参数设置灵活等特点。但作为单一技术指标策略,其存在一定固有缺陷,需要进行多维度优化,并辅以其他技术手段进行验证,才能在实盘中稳定获利。该策略提供了判断市场买卖气力的参考,但交易时还需谨慎。
||
Overview
The Williams Accumulation/Distribution Indicator (Williams AD) is a technical analysis indicator that monitors price changes and trading volumes to determine market sentiment. This indicator is based on Williams' assumption that volume tends to increase in a falling market. It reflects whether the current market trend is controlled by buyers or sellers.
This strategy analyzes the changes in the values of the Williams Accumulation/Distribution indicator to determine whether the current trend is in an accumulation phase or a distribution phase, thereby generating buy and sell signals.
Strategy Logic
The core indicator of this strategy is the Williams Accumulation/Distribution (Williams AD). The calculation formula is as follows:
If Close > Previous Close
   Williams AD = Previous Williams AD + (Close - Low)
If Close < Previous Close
   Williams AD = Previous Williams AD + (Close - High)
If Close == Previous Close
   Williams AD = Previous Williams AD
Where if today's close is higher than yesterday's, today's AD value is equal to yesterday's AD value plus the difference between "today's close - today's low". If today's close is lower than yesterday's, today's AD value is equal to yesterday's AD value plus the difference between "today's close - today's high".
This indicator reflects the power relationship in trading. The main judgment rules are as follows:
- Rising AD indicates increasing buying power, which is an accumulation trend.
- Falling AD indicates increasing selling power, which is a distribution trend.
When the security price hits a new high and the AD indicator does not hit a new high, it is considered a distribution signal to go short. When the security price hits a new low and the AD indicator does not hit a new low, it is considered an accumulation signal to go long.
According to these rules, the specific trading signal generation rules for this strategy are:
- AD > 0, generate long signal
- AD < 0, generate short signal
The long and short direction can be reversed through the input parameter "reverse".
Advantage Analysis
The advantages of this strategy include:
-
Using Williams AD to judge market sentiment can improve win rate.
-
The indicator calculation is simple and easy to implement.
-
The reverse parameter allows flexible adaptation to different market conditions.
-
Divergence between indicator and price can generate relatively accurate trading signals.
-
Market sentiment can be clearly visualized through candlestick colors.
Risk Analysis
This strategy also has the following risks:
-
Williams AD has lagging issues which may generate wrong signals.
-
Relying solely on one indicator can be affected by false breakouts and generate too frequent signals.
-
Improper parameter settings may lead to over-trading.
-
Other factors need to be considered to determine entry and exit timing.
-
Indicator judgements may be problematic around trend reversals.
Risks can be reduced through optimizing parameters, combining multiple indicators for confirmation, filtering trade frequency, etc.
Optimization Directions
This strategy can be optimized in the following aspects:
-
Add more parameters for optimization, such as trading range, frequency, etc.
-
Combine with other indicators for signal filtering, such as volume-price indicators, moving averages, etc.
-
Add stop loss strategies to control single trade loss.
-
Conduct parameter training to find optimal parameter combinations.
-
Incorporate machine learning algorithms for dynamic parameter optimization.
-
Test robustness across different products, timeframes, market environments.
-
Build backtesting system to evaluate strategy's risk-reward profile.
Conclusion
The Williams AD strategy judges market sentiment based on indicator direction changes. It has the advantages of simple signal generation and flexible parameter tuning. But as a single indicator strategy, it has inherent limitations and needs multi-dimensional optimizations and additional techniques for verification before stable profitability in live trading. It provides reference for judging market sentiment but still requires prudent trading.
[/trans]
Strategy Arguments
| Argument | Default | Description |
|---|---|---|
| v_input_1 | false | Trade reverse |
Source (PineScript)
/*backtest
start: 2023-10-02 00:00:00
end: 2023-11-01 00:00:00
period: 1h
basePeriod: 15m
exchanges: [{"eid":"Futures_Binance","currency":"BTC_USDT"}]
*/

//@version=2
////////////////////////////////////////////////////////////
//  Copyright by HPotter v1.0 18/01/2018
// Accumulation is a term used to describe a market controlled by buyers;
// whereas distribution is defined by a market controlled by sellers.
// Williams recommends trading this indicator based on divergences:
//
//  Distribution of the security is indicated when the security is making
//  a new high and the A/D indicator is failing to make a new high. Sell.
//
//  Accumulation of the security is indicated when the security is making
//  a new low and the A/D indicator is failing to make a new low. Buy.
//
//You can change long to short in the Input Settings
//WARNING:
//- For purpose educate only
//- This script to change bars colors.
////////////////////////////////////////////////////////////
strategy(title="Williams Accumulation/Distribution (Williams AD)", shorttitle="Williams AD")
reverse = input(false, title="Trade reverse")
hline(0, color=blue, linestyle=line)
xPrice = close
xWAD = iff(close > nz(close[1], 0), nz(xWAD[1],0) + close - low[1],
         iff(close < nz(close[1],0), nz(xWAD[1],0) + close - high[1],0))
pos = iff(xWAD > 0, 1,
       iff(xWAD < 0, -1, nz(pos[1], 0)))
possig = iff(reverse and pos == 1, -1,
          iff(reverse and pos == -1, 1, pos))
if (possig == 1)
    strategy.entry("Long", strategy.long)
if (possig == -1)
    strategy.entry("Short", strategy.short)
barcolor(possig == -1 ? red: possig == 1 ? green : blue )
plot(xWAD, color=green, title="Williams AD")
Detail
https://www.fmz.com/strategy/430903
Last Modified
2023-11-02 17:25:51