
12 KiB
Name
多重RSI-EMA动量对冲增仓策略-Multi-RSI-EMA-Momentum-Hedging-Strategy-with-Position-Scaling
Author
ChaoZhang
Strategy Description
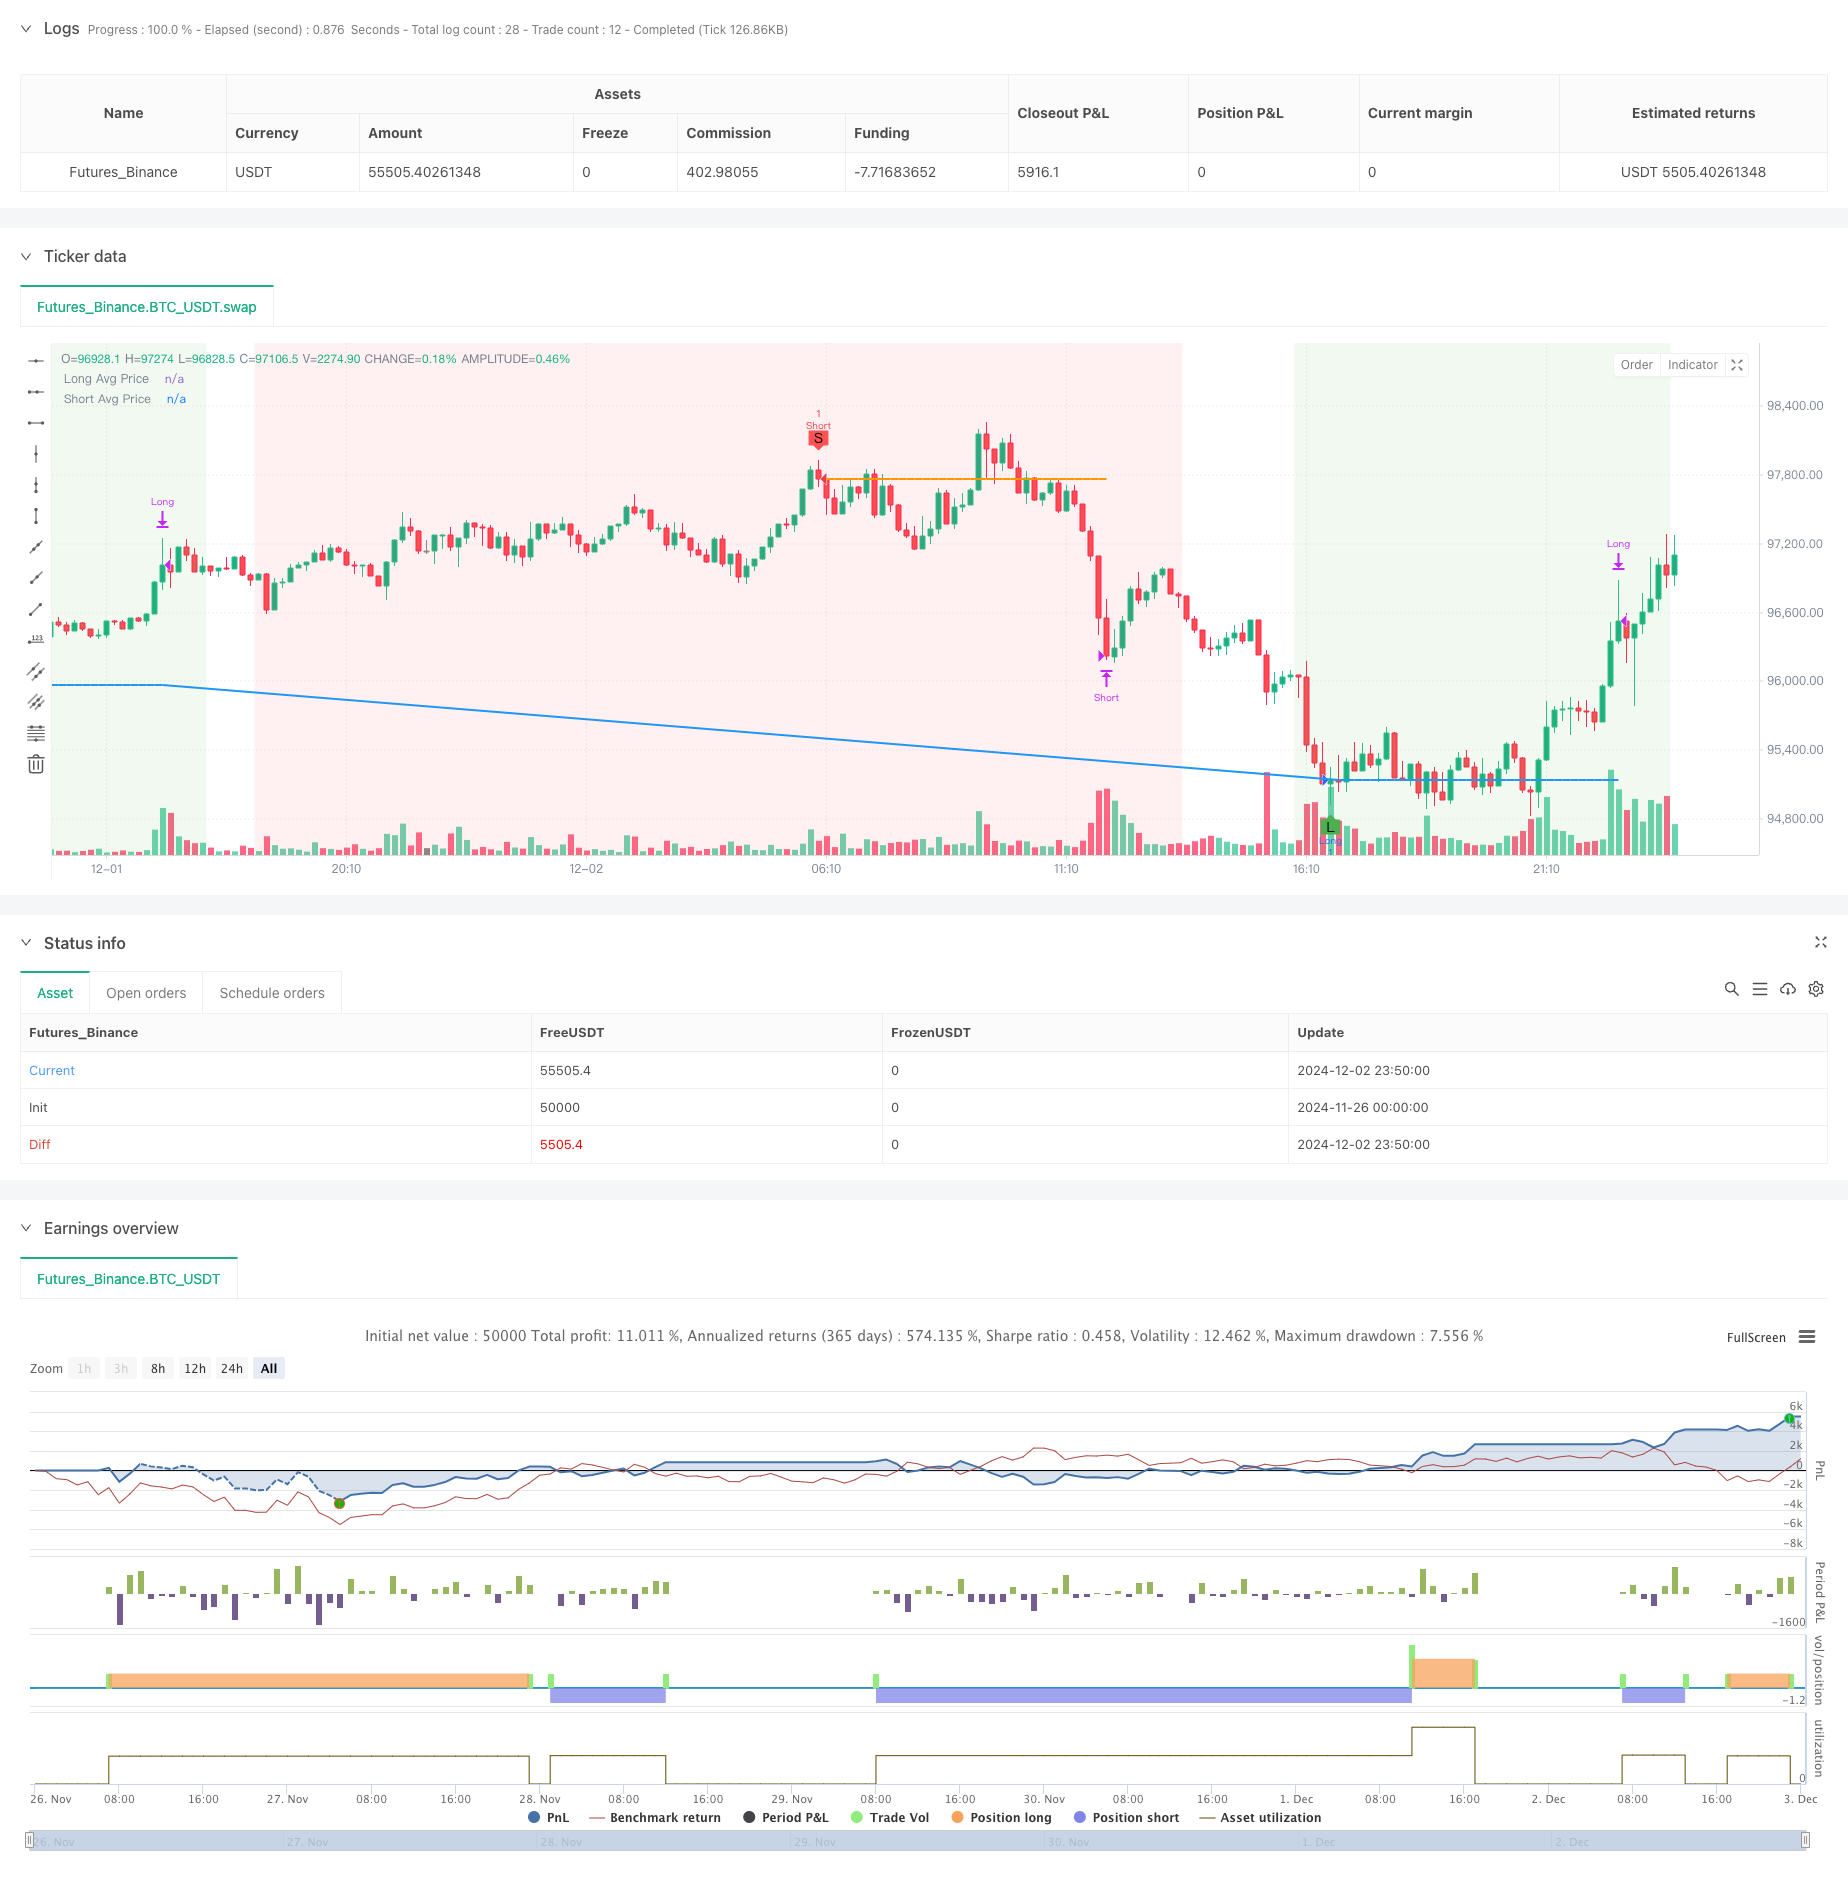
[trans]
概述
这是一个基于RSI指标和EMA均线的动量对冲交易策略。该策略采用了双重RSI时间周期(RSI-14和RSI-2)结合三重EMA均线(50、100、200)来捕捉市场趋势反转机会,并通过动态仓位管理实现对冲效果。策略的核心特点是在满足入场条件时逐步增加仓位,同时设置了基于RSI超买超卖的止盈条件。
策略原理
策略使用RSI-14和RSI-2两个不同周期的相对强弱指数,配合EMA-50、EMA-100和EMA-200三条均线来确定交易信号。做多条件需要RSI-14低于31且RSI-2向上突破10,同时要求三条均线呈现空头排列(EMA-50 < EMA-100 < EMA-200)。做空条件则相反,要求RSI-14高于69且RSI-2向下突破90,同时三条均线呈现多头排列(EMA-50 > EMA-100 > EMA-200)。策略采用20倍杠杆,并在每次交易时基于当前权益动态计算交易数量。当现有仓位满足条件时,新开仓位会以两倍于当前仓位的数量进行交易。止盈条件基于RSI指标的反向突破设置。
策略优势
- 多层技术指标交叉验证,提高信号可靠性
- 动态仓位管理,可以根据市场情况灵活调整持仓
- 双向交易机制,可以在多空两个方向上获利
- 自适应的止盈条件,避免过早离场
- 图形化界面清晰展示交易信号和市场状态
- 对冲机制可以降低单向风险暴露
- 基于权益的动态仓位计算,风险控制更合理
策略风险
- 高杠杆倍数(20倍)可能带来较大的爆仓风险
- 递增式仓位可能在市场剧烈波动时造成严重损失
- 没有设置止损条件,可能面临持续下跌风险
- RSI指标在横盘市场可能产生虚假信号
- 多个技术指标的组合可能导致交易机会减少
- 仓位管理方式可能在连续同向交易时积累过大风险
策略优化方向
- 引入自适应的止损机制,如基于ATR或波动率的动态止损
- 优化杠杆倍数,可考虑根据市场波动性动态调整
- 添加时间过滤器,避免在低波动期间交易
- 引入成交量指标,提高信号可靠性
- 优化仓位增加的倍数,可考虑设置最大仓位限制
- 增加趋势强度过滤器,避免在弱趋势中交易
- 完善风险管理机制,如设置每日最大亏损限制
总结
这是一个结合了动量和趋势的综合性策略,通过多重技术指标的配合来提高交易的准确性。策略的创新点在于采用了动态的仓位管理方式和对冲机制,但同时也带来了较高的风险。通过优化风险控制机制和引入更多的过滤条件,该策略有望在实际交易中取得更好的表现。建议在实盘使用前进行充分的回测和参数优化。
||
Overview
This is a momentum hedging trading strategy based on RSI indicators and EMA moving averages. The strategy utilizes dual RSI periods (RSI-14 and RSI-2) combined with triple EMA lines (50, 100, 200) to capture market trend reversal opportunities, implementing hedging through dynamic position management. The strategy's core feature is gradually increasing positions when entry conditions are met, with profit-taking conditions based on RSI overbought/oversold levels.
Strategy Principles
The strategy employs RSI-14 and RSI-2 with different periods, along with EMA-50, EMA-100, and EMA-200 to determine trading signals. Long conditions require RSI-14 below 31 and RSI-2 crossing above 10, while EMAs must be in bearish alignment (EMA-50 < EMA-100 < EMA-200). Short conditions are opposite, requiring RSI-14 above 69 and RSI-2 crossing below 90, with EMAs in bullish alignment (EMA-50 > EMA-100 > EMA-200). The strategy uses 20x leverage and dynamically calculates trade quantities based on current equity. New positions are opened with twice the current position size when conditions are met. Take-profit conditions are set based on RSI indicator reverse breakouts.
Strategy Advantages
- Multiple technical indicator cross-validation improves signal reliability
- Dynamic position management allows flexible portfolio adjustment
- Bi-directional trading mechanism enables profit from both directions
- Adaptive take-profit conditions prevent premature exits
- Clear graphical interface showing trading signals and market conditions
- Hedging mechanism reduces directional risk exposure
- Equity-based dynamic position calculation for better risk control
Strategy Risks
- High leverage (20x) may lead to significant liquidation risks
- Incremental positioning could cause severe losses during market volatility
- Absence of stop-loss conditions may face continuous drawdown risks
- RSI indicators may generate false signals in ranging markets
- Multiple technical indicator combination may reduce trading opportunities
- Position management method may accumulate excessive risk during consecutive trades
Strategy Optimization Directions
- Introduce adaptive stop-loss mechanism based on ATR or volatility
- Optimize leverage multiplier with dynamic adjustment based on market volatility
- Add time filters to avoid trading during low volatility periods
- Incorporate volume indicators to improve signal reliability
- Optimize position increment multiplier with maximum position limits
- Add trend strength filters to avoid trading in weak trends
- Enhance risk management with daily maximum loss limits
Summary
This comprehensive strategy combines momentum and trend following, using multiple technical indicators to improve trading accuracy. The strategy innovates through dynamic position management and hedging mechanisms, though it carries significant risks. Through optimization of risk control mechanisms and introduction of additional filters, this strategy has potential for better performance in live trading. Thorough backtesting and parameter optimization are recommended before live implementation.[/trans]
Source (PineScript)
/*backtest
start: 2024-11-26 00:00:00
end: 2024-12-03 00:00:00
period: 10m
basePeriod: 10m
exchanges: [{"eid":"Futures_Binance","currency":"BTC_USDT"}]
*/

//@version=5
strategy("Custom RSI EMA Strategy Hedge", overlay=true, default_qty_type=strategy.fixed, default_qty_value=1)

// Definování vstupních podmínek
rsi_14 = ta.rsi(close, 14)
rsi_2 = ta.rsi(close, 2)
ema_50 = ta.ema(close, 50)
ema_100 = ta.ema(close, 100)
ema_200 = ta.ema(close, 200)

// Pákový efekt
leverage = 20

// Podmínky pro long pozici
longCondition = (rsi_14[1] < 31) and ta.crossover(rsi_2, 10) and (ema_50 < ema_100) and (ema_100 < ema_200)

// Podmínky pro short pozici
shortCondition = (rsi_14[1] > 69) and ta.crossunder(rsi_2, 90) and (ema_50 > ema_100) and (ema_100 > ema_200)

// Identifikátory pozic
long_id = "Long"
short_id = "Short"

// Definování průměrné ceny pozice pro long a short
var float long_avg_price = na
var float short_avg_price = na

// Sledujeme, zda se velikost pozice změnila
var float last_long_position_size = na
var float last_short_position_size = na

// Přerušení průměrné ceny pozice při změně pozice
if (last_long_position_size != strategy.position_size and strategy.position_size > 0)
    long_avg_price := na
if (last_short_position_size != strategy.position_size and strategy.position_size < 0)
    short_avg_price := na

// Aktualizace průměrné ceny pozice
if (strategy.position_size > 0)
    long_avg_price := strategy.position_avg_price
else
    long_avg_price := na

if (strategy.position_size < 0)
    short_avg_price := strategy.position_avg_price
else
    short_avg_price := na

// Uložení aktuální velikosti pozice pro příští bar
if (strategy.position_size > 0)
    last_long_position_size := strategy.position_size
else if (strategy.position_size < 0)
    last_short_position_size := strategy.position_size

// Podmínky pro take profit
takeProfitLongCondition = (rsi_14 > 69) and (rsi_2 > 90) and (long_avg_price < close)
takeProfitShortCondition = (rsi_14 < 31) and (rsi_2 < 10) and (short_avg_price > close)

// Velikost pozice
new_long_position_size = strategy.position_size == 0 ? na : math.abs(strategy.position_size) * 2
new_short_position_size = strategy.position_size == 0 ? na : math.abs(strategy.position_size) * 2

// Úprava velikosti pozice s ohledem na pákový efekt
position_value = strategy.equity * leverage
trade_qty_long = position_value / close
trade_qty_short = position_value / close

// Vstup do long pozice s dvojnásobkem aktuální pozice nebo standardní velikostí při první pozici
if (longCondition)
    strategy.entry(long_id, strategy.long, qty=new_long_position_size == na ? trade_qty_long : new_long_position_size)

// Vstup do short pozice s dvojnásobkem aktuální pozice nebo standardní velikostí při první pozici
if (shortCondition)
    strategy.entry(short_id, strategy.short, qty=new_short_position_size == na ? trade_qty_short : new_short_position_size)

// Výstup z long pozice při splnění podmínek pro take profit
if (takeProfitLongCondition)
    strategy.close(long_id)

// Výstup z short pozice při splnění podmínek pro take profit
if (takeProfitShortCondition)
    strategy.close(short_id)

// Zvýraznění části grafu, kde platí podmínky pro long
highlightLongCondition = (ema_50 < ema_100) and (ema_100 < ema_200)
bgcolor(highlightLongCondition ? color.new(color.green, 90) : na)

// Zvýraznění části grafu, kde platí podmínky pro short
highlightShortCondition = (ema_50 > ema_100) and (ema_100 > ema_200)
bgcolor(highlightShortCondition ? color.new(color.red, 90) : na)

// Přidání bodů pozic do grafu
plotshape(series=longCondition, location=location.belowbar, color=color.green, style=shape.labelup, text="L")
plotshape(series=shortCondition, location=location.abovebar, color=color.red, style=shape.labeldown, text="S")

// Vykreslení průměrné ceny pozice pro long a short pouze pokud pozice existuje
plot(strategy.position_size > 0 ? long_avg_price : na, title="Long Avg Price", color=color.blue, linewidth=2)
plot(strategy.position_size < 0 ? short_avg_price : na, title="Short Avg Price", color=color.orange, linewidth=2)

// Zvýraznění čtverců pro RSI14 > 70 (červeně) a RSI14 < 30 (zeleně)
var int rsi_above_70_start = na
var int rsi_below_30_start = na

var float top_value_above_70 = na
var float bottom_value_above_70 = na

var float top_value_below_30 = na
var float bottom_value_below_30 = na

// Identifikace začátku a konce období pro RSI14 > 70
if (rsi_14[1] > 70 and rsi_14[2] > 70)
    if na(rsi_above_70_start)
        rsi_above_70_start := bar_index
        top_value_above_70 := high
        bottom_value_above_70 := low
    else
        top_value_above_70 := math.max(top_value_above_70, high)
        bottom_value_above_70 := math.min(bottom_value_above_70, low)
else
    if not na(rsi_above_70_start)
        // box.new(left = rsi_above_70_start, right = bar_index - 1, top = top_value_above_70, bottom = bottom_value_above_70, border_color = color.red, border_width = 2, bgcolor=color.new(color.red, 90))
        rsi_above_70_start := na
        top_value_above_70 := na
        bottom_value_above_70 := na

// Identifikace začátku a konce období pro RSI14 < 30
if (rsi_14[1] < 30 and rsi_14[2] < 30)
    if na(rsi_below_30_start)
        rsi_below_30_start := bar_index
        top_value_below_30 := high
        bottom_value_below_30 := low
    else
        top_value_below_30 := math.max(top_value_below_30, high)
        bottom_value_below_30 := math.min(bottom_value_below_30, low)
else
    if not na(rsi_below_30_start)
        // box.new(left = rsi_below_30_start, right = bar_index - 1, top = top_value_below_30, bottom = bottom_value_below_30, border_color = color.green, border_width = 2, bgcolor=color.new(color.green, 90))
        rsi_below_30_start := na
        top_value_below_30 := na
        bottom_value_below_30 := na
Detail
https://www.fmz.com/strategy/473945
Last Modified
2024-12-04 15:41:10