
8.0 KiB
Name
多重EMA交叉趋势跟踪量化交易策略-Multi-EMA-Crossover-Trend-Following-Quantitative-Trading-Strategy
Author
ChaoZhang
Strategy Description
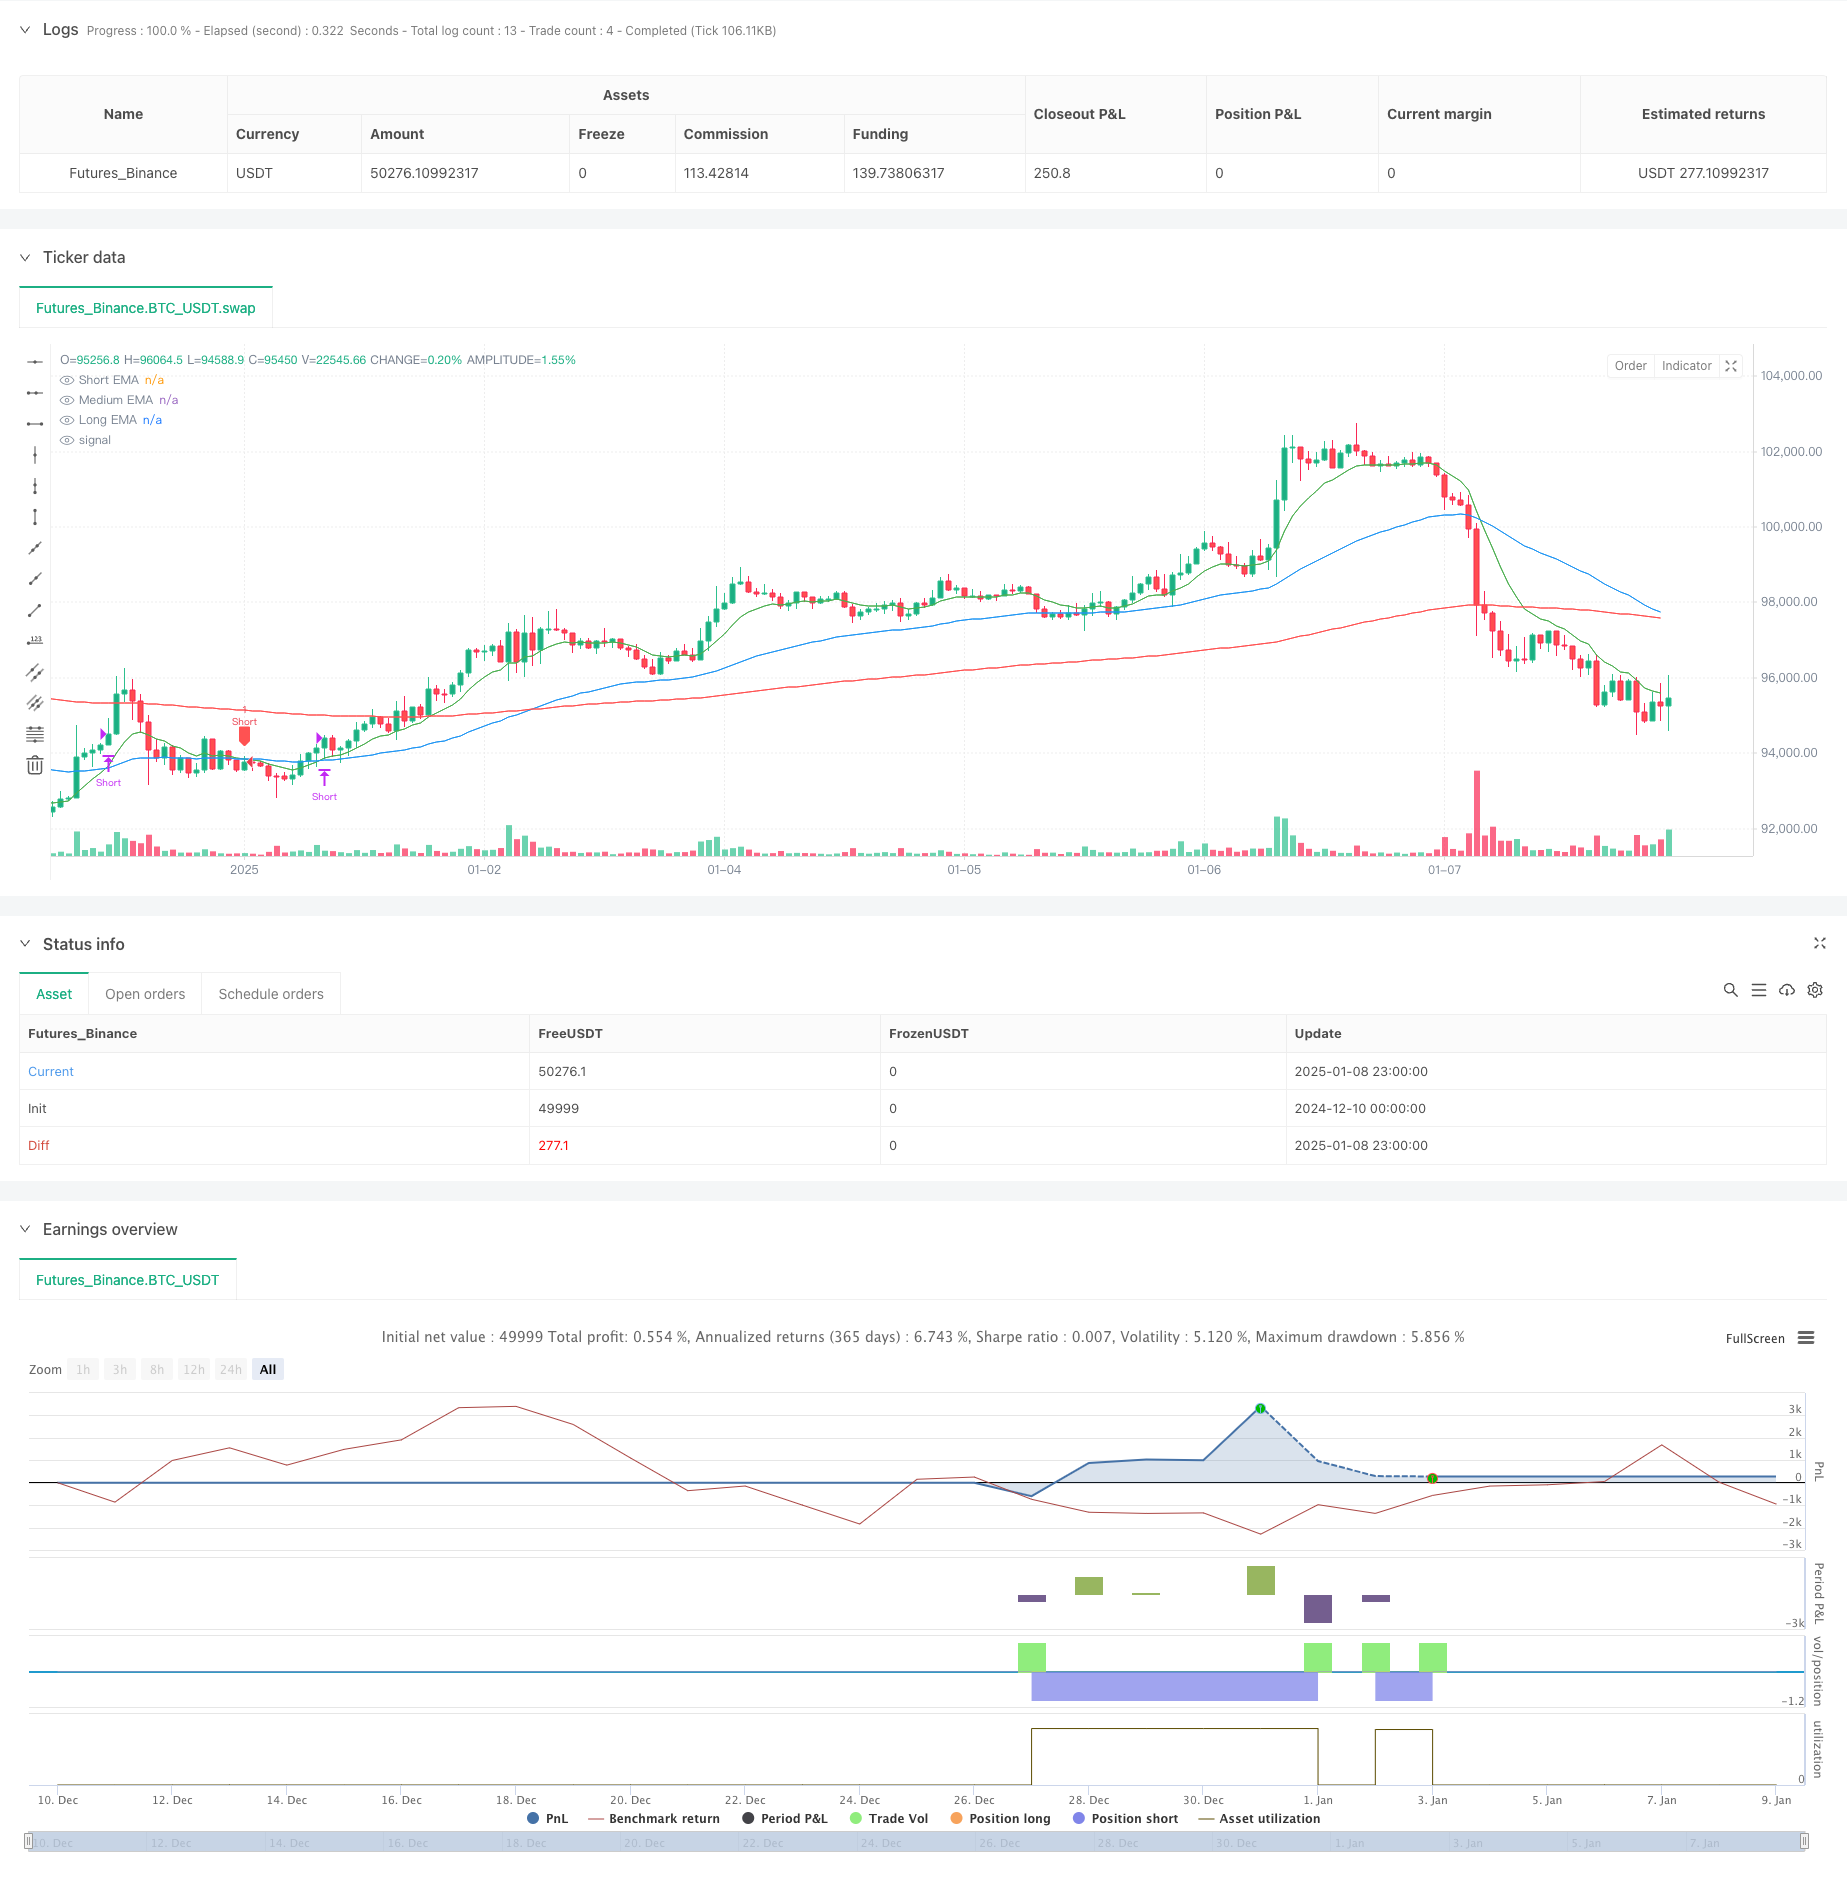
[trans]
概述
这是一个基于多重指数移动平均线(EMA)交叉的趋势跟踪策略。该策略利用10周期短期EMA、50周期中期EMA和200周期长期EMA的交叉关系来捕捉市场趋势,并在符合条件时进行多空交易。策略的核心思想是通过多重时间框架的移动平均线来过滤市场噪音,识别主要趋势方向,并在趋势延续时获取收益。
策略原理
策略采用三重EMA交叉系统作为交易信号生成机制。具体来说:
- 使用200周期EMA作为主要趋势判断指标,价格在其上方时只做多,在其下方时只做空
- 当短期EMA(10周期)向上穿越中期EMA(50周期)且价格在长期EMA之上时,开启做多仓位
- 当短期EMA向下穿越中期EMA且价格在长期EMA之下时,开启做空仓位
- 当短期EMA向下穿越中期EMA时,平掉多头仓位
- 当短期EMA向上穿越中期EMA时,平掉空头仓位 策略还包含调试功能,用于监控异常的EMA交叉情况和关系。
策略优势
- 多重时间框架过滤:通过结合不同周期的EMA,有效降低假信号
- 趋势跟踪性强:策略设计符合趋势跟踪逻辑,能较好地捕捉主要趋势
- 风险控制完善:通过EMA交叉作为止损信号,控制风险
- 逻辑简单明确:策略规则清晰,易于理解和执行
- 适应性强:可应用于不同市场和时间周期
- 自动化程度高:策略规则明确,便于编程实现
策略风险
- 震荡市场风险:在横盘震荡市可能频繁交易导致亏损
- 滞后性风险:移动平均线具有滞后性,可能错过趋势转折点
- 假突破风险:短期价格波动可能触发错误信号
- 资金管理风险:固定仓位可能在某些市况下风险过大
- 参数优化风险:过度优化可能导致策略过拟合
策略优化方向
- 引入波动率指标:考虑加入ATR等波动率指标来动态调整仓位
- 增加趋势强度过滤:可引入ADX等指标衡量趋势强度
- 优化止损机制:考虑设置跟踪止损或固定止损
- 增加市场状态判断:加入对趋势/震荡市的判断逻辑
- 完善仓位管理:根据市场波动性动态调整仓位大小
总结
该策略是一个经典的趋势跟踪系统,通过多重EMA的配合使用,既保证了对主要趋势的把握,又能及时进行止盈止损。虽然存在一定的滞后性,但通过合理的参数设置和风险管理,仍能在趋势市场中获得稳定收益。策略的优化空间较大,可以通过引入其他技术指标和完善交易规则来提升性能。 ||
Overview
This is a trend following strategy based on multiple Exponential Moving Average (EMA) crossovers. The strategy utilizes the crossover relationships between a 10-period short-term EMA, 50-period medium-term EMA, and 200-period long-term EMA to capture market trends and execute long/short trades when conditions are met. The core idea is to filter market noise through multiple timeframe moving averages, identify the main trend direction, and capture profits during trend continuation.
Strategy Principles
The strategy employs a triple EMA crossover system as its signal generation mechanism. Specifically:
- Uses 200-period EMA as the main trend indicator, only taking long positions above it and short positions below it
- Opens long positions when short-term EMA (10-period) crosses above medium-term EMA (50-period) and price is above long-term EMA
- Opens short positions when short-term EMA crosses below medium-term EMA and price is below long-term EMA
- Closes long positions when short-term EMA crosses below medium-term EMA
- Closes short positions when short-term EMA crosses above medium-term EMA The strategy includes debugging features to monitor abnormal EMA crossovers and relationships.
Strategy Advantages
- Multiple timeframe filtering: Effectively reduces false signals by combining EMAs of different periods
- Strong trend following capability: Strategy design aligns with trend following logic, capturing major trends well
- Robust risk control: Uses EMA crossovers as stop-loss signals to control risk
- Simple and clear logic: Strategy rules are clear, easy to understand and execute
- High adaptability: Applicable to different markets and timeframes
- High automation potential: Clear strategy rules facilitate programming implementation
Strategy Risks
- Choppy market risk: May result in frequent trades and losses during sideways markets
- Lag risk: Moving averages have inherent lag, potentially missing trend reversal points
- False breakout risk: Short-term price fluctuations may trigger false signals
- Money management risk: Fixed position sizing may be too risky in certain market conditions
- Parameter optimization risk: Over-optimization may lead to strategy overfitting
Strategy Optimization Directions
- Introduce volatility indicators: Consider adding ATR or similar indicators for dynamic position sizing
- Add trend strength filtering: Consider incorporating ADX or similar indicators to measure trend strength
- Optimize stop-loss mechanism: Consider implementing trailing stops or fixed stops
- Enhance market state detection: Add logic to distinguish between trending and ranging markets
- Improve position management: Dynamically adjust position sizes based on market volatility
Summary
This strategy is a classic trend following system that ensures major trend capture while maintaining timely profit-taking and stop-loss through the use of multiple EMAs. Though it has some inherent lag, reasonable parameter settings and risk management can still generate stable returns in trending markets. The strategy has significant optimization potential through the introduction of additional technical indicators and refined trading rules.[/trans]
Source (PineScript)
/*backtest
start: 2024-12-10 00:00:00
end: 2025-01-09 00:00:00
period: 1h
basePeriod: 1h
exchanges: [{"eid":"Futures_Binance","currency":"BTC_USDT","balance":49999}]
*/

//@version=5
strategy("EMA Crossover Strategy (Enhanced Debug)", overlay=true)

// Inputs for EMA periods
shortEMA = input.int(10, title="Short EMA Period")
mediumEMA = input.int(50, title="Medium EMA Period")
longEMA = input.int(200, title="Long EMA Period")

// Calculating EMAs
emaShort = ta.ema(close, shortEMA)
emaMedium = ta.ema(close, mediumEMA)
emaLong = ta.ema(close, longEMA)

// Plot EMAs
plot(emaShort, color=color.green, title="Short EMA")
plot(emaMedium, color=color.blue, title="Medium EMA")
plot(emaLong, color=color.red, title="Long EMA")

// Conditions for entry and exit
longCondition = close > emaLong and ta.crossover(emaShort, emaMedium) and emaMedium > emaLong
shortCondition = close < emaLong and ta.crossunder(emaShort, emaMedium) and emaMedium < emaLong
closeLongCondition = ta.crossunder(emaShort, emaMedium)
closeShortCondition = ta.crossover(emaShort, emaMedium)

// Debugging labels for unexpected behavior
if (ta.crossover(emaShort, emaLong) and not ta.crossover(emaShort, emaMedium))
    label.new(bar_index, high, "Short > Long", style=label.style_circle, color=color.red, textcolor=color.white)

// Debugging EMA relationships
if (emaMedium <= emaLong)
    label.new(bar_index, high, "Medium < Long", style=label.style_cross, color=color.orange, textcolor=color.white)

// Entry logic
if (longCondition)
    strategy.entry("Long", strategy.long)

if (shortCondition)
    strategy.entry("Short", strategy.short)

// Exit logic
if (closeLongCondition)
    strategy.close("Long")

if (closeShortCondition)
    strategy.close("Short")

// Display labels for signals
plotshape(series=longCondition, style=shape.labelup, color=color.green, location=location.belowbar, title="Buy Signal")
plotshape(series=shortCondition, style=shape.labeldown, color=color.red, location=location.abovebar, title="Sell Signal")
Detail
https://www.fmz.com/strategy/477977
Last Modified
2025-01-10 16:33:35