
11 KiB
Name
多重随机震荡策略与动量分析系统-Multi-Stochastic-Oscillation-and-Momentum-Analysis-System
Author
ChaoZhang
Strategy Description
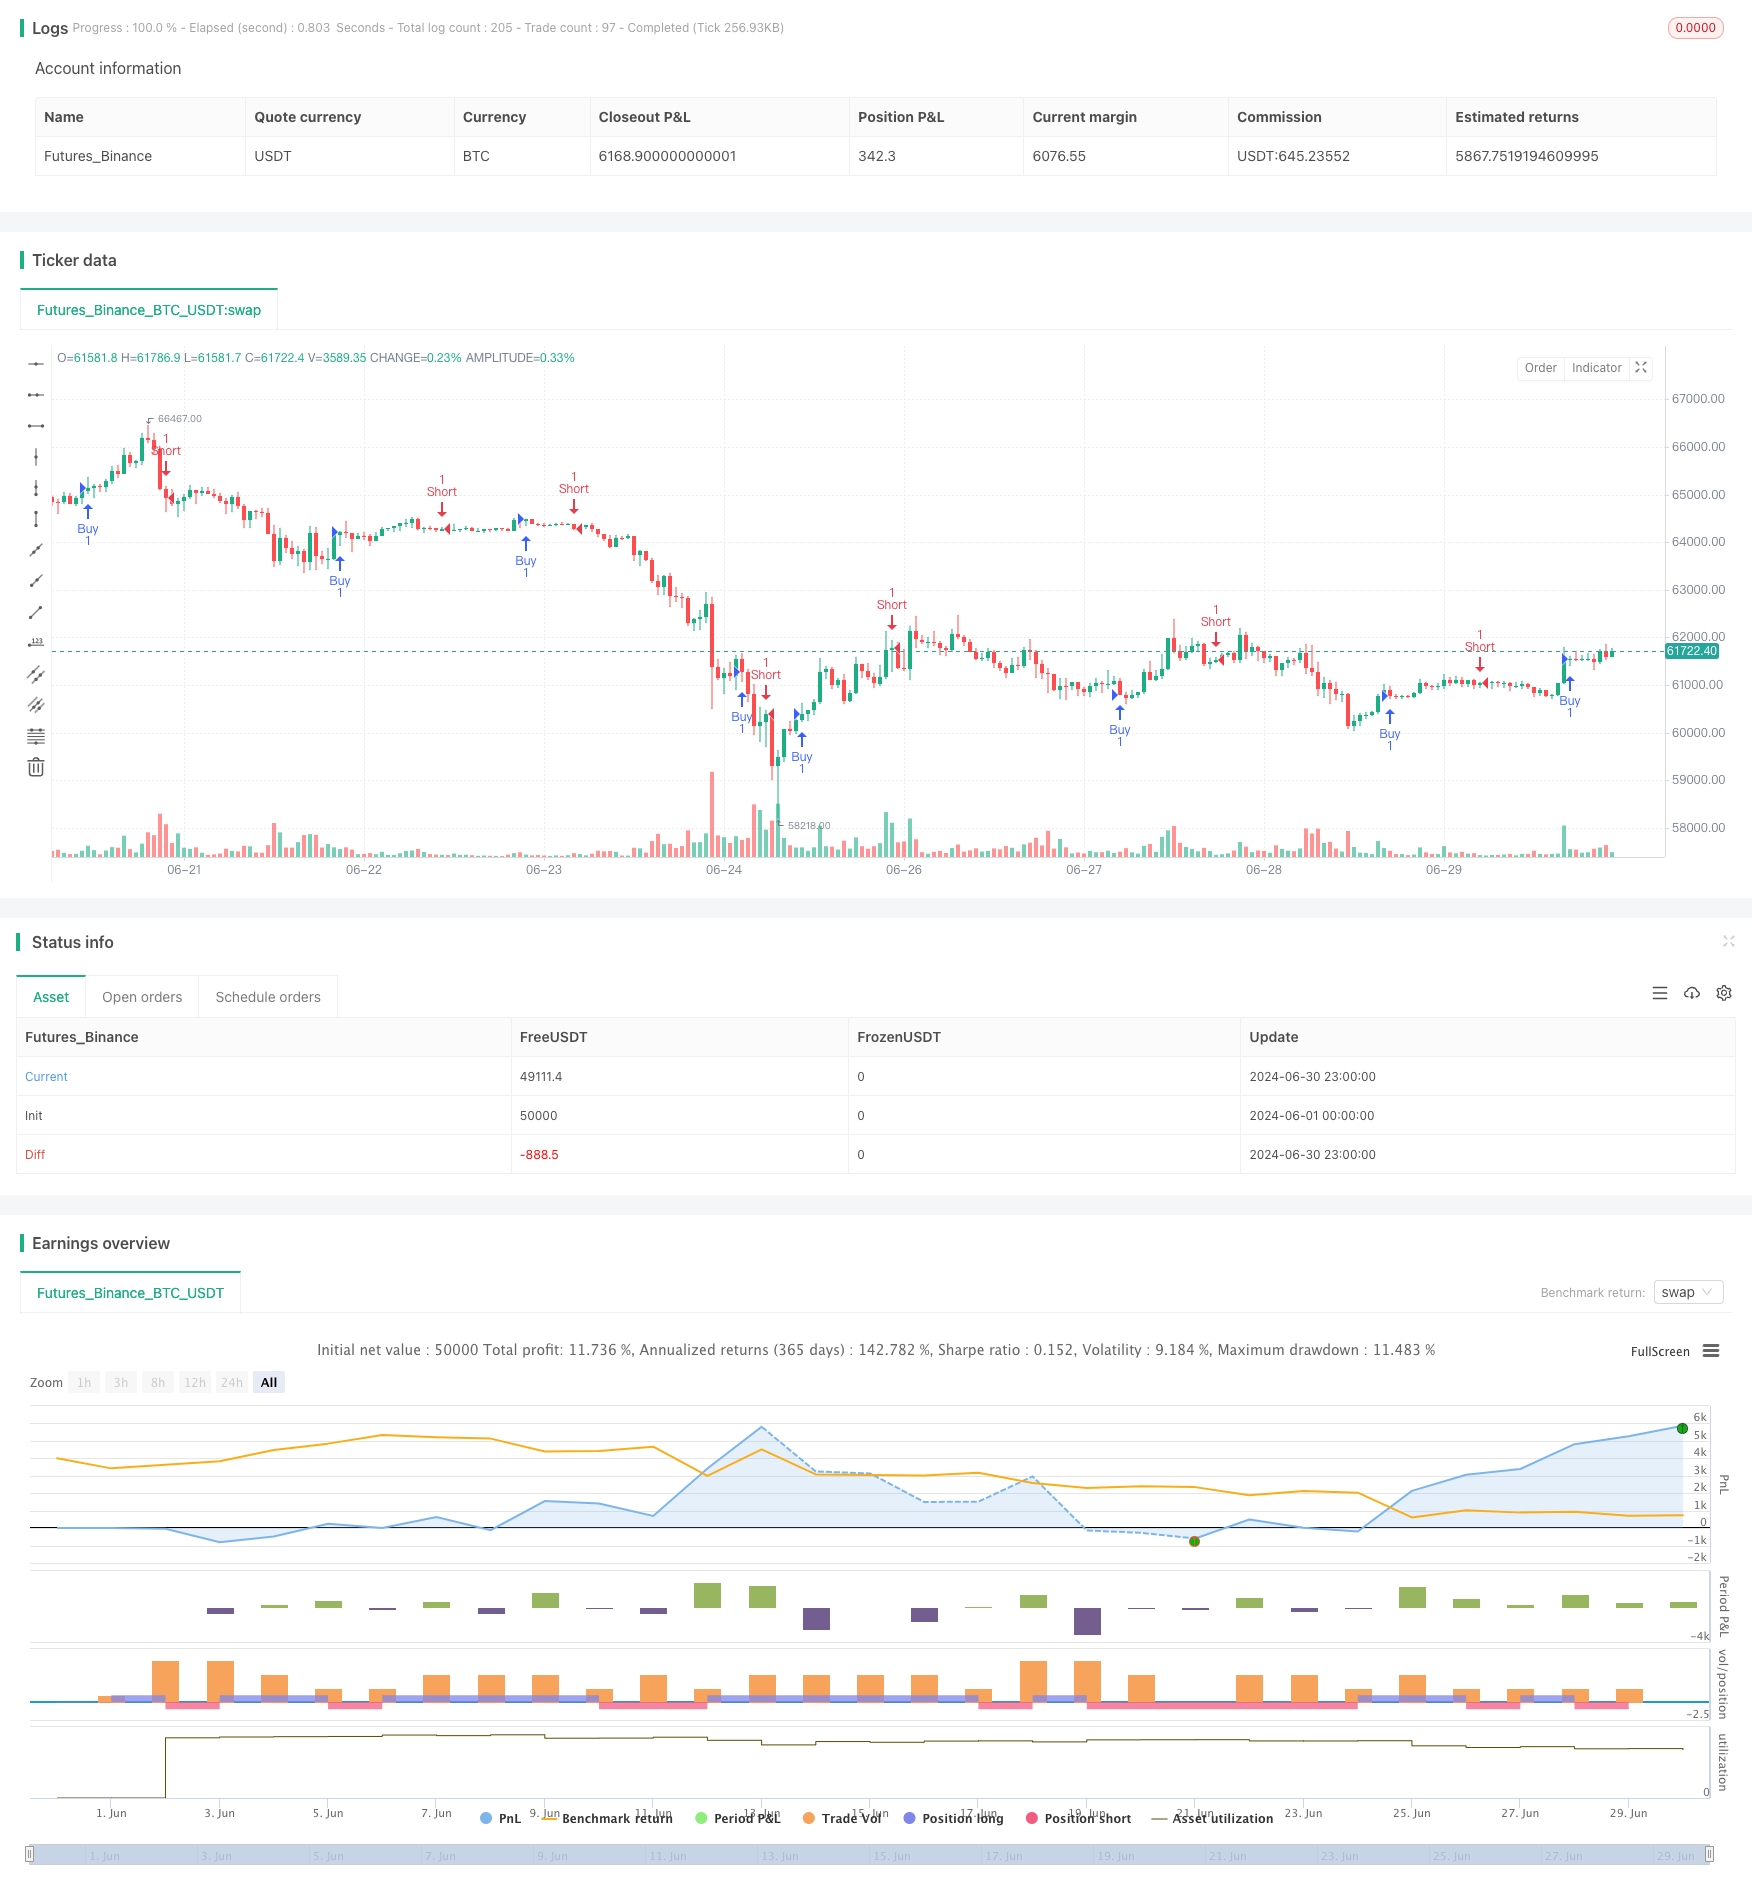
[trans]
概述
多重随机震荡策略与动量分析系统是一种基于多重随机指标和动量分析的量化交易策略。该策略利用8条不同参数设置的随机震荡指标线,通过分析这些指标线之间的相对位置和走势,来判断市场的趋势和动量。策略的核心思想是,当所有指标线按照特定顺序排列时,表明市场具有强烈的上涨或下跌趋势,此时进行相应的多头或空头交易。
策略原理
该策略的核心原理是使用多重随机震荡指标来分析市场动量和趋势。具体实现如下:
- 计算8条随机震荡指标线(k1到k8),每条线使用不同的参数设置。
- 所有指标线都基于HLC3(最高价、最低价和收盘价的平均值)计算。
- 每条指标线都经过SMA(简单移动平均线)和EMA(指数移动平均线)的双重平滑处理。
- 策略通过比较相邻指标线的位置关系来判断市场趋势:
- 当k1 >= k2 >= k3 >= k4 >= k5 >= k6 >= k7 >= k8 >= k8[1]时,触发多头信号。
- 当k1 < k2 < k3 < k4 < k5 < k6 < k7 < k8 < k8[1]时,触发空头信号。
- 策略还设置了超买(80)和超卖(20)水平线,以及中间水平线(50),用于辅助判断市场状态。
策略优势
-
多重指标融合:通过使用8条不同参数的随机震荡指标,策略能够全面捕捉市场的多个时间框架的动态变化,减少单一指标可能带来的假信号。
-
动量捕捉:策略设计能有效捕捉市场的强劲趋势,特别是在趋势初期阶段,有助于及早进场。
-
视觉化决策支持:策略将不同指标线用不同颜色显示,直观反映市场状态,有助于交易者快速判断市场走势。
-
灵活性:策略参数可调整,使用者可以根据不同市场环境和交易品种进行优化。
-
风险管理:通过设置超买超卖水平线,策略提供了额外的风险控制手段。
策略风险
-
过度交易风险:在震荡市场中,策略可能产生频繁的交易信号,导致过度交易和增加交易成本。
-
滞后性:由于使用了多重移动平均线,策略在快速反转行情中可能反应较慢。
-
假突破风险:在横盘整理阶段,策略可能误判小幅波动为趋势开始,造成错误交易。
-
参数敏感性:策略效果高度依赖于参数设置,不同市场环境可能需要频繁调整参数。
-
缺乏止损机制:代码中未明确设置止损条件,可能导致在错误判断时承受较大亏损。
策略优化方向
-
引入自适应参数:可以考虑使用自适应算法动态调整随机震荡指标的参数,以适应不同市场环境。
-
增加过滤条件:结合其他技术指标(如ATR、RSI等)作为辅助过滤条件,减少假信号。
-
完善风险管理:加入止损和止盈机制,如基于ATR的动态止损,保护已获利润和限制潜在亏损。
-
优化入场时机:可以考虑在指标线交叉时入场,而不是等待所有指标线完全排列,以提高入场的及时性。
-
引入成交量分析:结合成交量指标,验证趋势的有效性,提高交易信号的可靠性。
-
增加时间过滤:添加交易时间窗口限制,避开波动较大或流动性不足的时段。
-
实现部分仓位管理:根据信号强度调整仓位大小,在更强烈的信号出现时增加仓位。
总结
多重随机震荡策略与动量分析系统是一种创新性的量化交易方法,通过融合多重随机震荡指标,有效捕捉市场动量和趋势。该策略在趋势明确的市场中表现出色,能够及早发现并跟随大趋势。然而,策略也存在一些潜在风险,如过度交易和参数敏感性等。通过引入自适应参数、增加过滤条件、完善风险管理等优化措施,可以进一步提升策略的稳定性和盈利能力。对于追求趋势跟踪和动量交易的投资者来说,这是一个值得深入研究和实践的策略框架。
||
Overview
The Multi-Stochastic Oscillation and Momentum Analysis System is a quantitative trading strategy based on multiple stochastic indicators and momentum analysis. This strategy utilizes 8 stochastic oscillator lines with different parameter settings to analyze market trends and momentum by examining the relative positions and movements of these indicator lines. The core idea of the strategy is that when all indicator lines are aligned in a specific order, it signals a strong upward or downward trend in the market, triggering corresponding long or short trades.
Strategy Principle
The core principle of this strategy is to use multiple stochastic oscillators to analyze market momentum and trends. The specific implementation is as follows:
- Calculate 8 stochastic oscillator lines (k1 to k8), each using different parameter settings.
- All indicator lines are based on HLC3 (average of High, Low, and Close prices).
- Each indicator line undergoes double smoothing with SMA (Simple Moving Average) and EMA (Exponential Moving Average).
- The strategy determines market trends by comparing the positions of adjacent indicator lines:
- A long signal is triggered when k1 >= k2 >= k3 >= k4 >= k5 >= k6 >= k7 >= k8 >= k8[1].
- A short signal is triggered when k1 < k2 < k3 < k4 < k5 < k6 < k7 < k8 < k8[1].
- The strategy also sets overbought (80) and oversold (20) levels, as well as a mid-level (50) line to assist in judging market conditions.
Strategy Advantages
-
Multiple Indicator Integration: By using 8 stochastic oscillators with different parameters, the strategy can comprehensively capture market dynamics across multiple timeframes, reducing false signals that might arise from a single indicator.
-
Momentum Capture: The strategy design effectively captures strong market trends, especially in the early stages, helping to enter trades early.
-
Visual Decision Support: The strategy displays different indicator lines in different colors, intuitively reflecting market conditions and helping traders quickly judge market trends.
-
Flexibility: Strategy parameters are adjustable, allowing users to optimize for different market environments and trading instruments.
-
Risk Management: By setting overbought and oversold levels, the strategy provides additional risk control measures.
Strategy Risks
-
Overtrading Risk: In oscillating markets, the strategy may generate frequent trading signals, leading to overtrading and increased transaction costs.
-
Lag: Due to the use of multiple moving averages, the strategy may react slowly in rapidly reversing markets.
-
False Breakout Risk: During consolidation phases, the strategy may misinterpret small fluctuations as the beginning of trends, resulting in erroneous trades.
-
Parameter Sensitivity: The strategy's effectiveness is highly dependent on parameter settings, which may require frequent adjustments in different market environments.
-
Lack of Stop-Loss Mechanism: The code does not explicitly set stop-loss conditions, which may lead to significant losses in case of misjudgments.
Strategy Optimization Directions
-
Introduce Adaptive Parameters: Consider using adaptive algorithms to dynamically adjust the parameters of stochastic oscillators to adapt to different market environments.
-
Add Filtering Conditions: Incorporate other technical indicators (such as ATR, RSI) as auxiliary filtering conditions to reduce false signals.
-
Improve Risk Management: Add stop-loss and take-profit mechanisms, such as ATR-based dynamic stop-loss, to protect profits and limit potential losses.
-
Optimize Entry Timing: Consider entering trades when indicator lines cross, rather than waiting for all indicator lines to fully align, to improve entry timeliness.
-
Incorporate Volume Analysis: Combine volume indicators to verify trend validity and improve the reliability of trading signals.
-
Implement Time Filtering: Add trading time window restrictions to avoid periods of high volatility or low liquidity.
-
Implement Partial Position Management: Adjust position sizes based on signal strength, increasing positions when stronger signals appear.
Conclusion
The Multi-Stochastic Oscillation and Momentum Analysis System is an innovative quantitative trading method that effectively captures market momentum and trends by integrating multiple stochastic oscillators. This strategy performs excellently in markets with clear trends, capable of early identification and following major trends. However, the strategy also has some potential risks, such as overtrading and parameter sensitivity. By introducing adaptive parameters, adding filtering conditions, improving risk management, and other optimization measures, the stability and profitability of the strategy can be further enhanced. For investors pursuing trend-following and momentum trading, this is a strategy framework worth in-depth study and practice.
[/trans]
Source (PineScript)
/*backtest
start: 2024-06-01 00:00:00
end: 2024-06-30 23:59:59
period: 1h
basePeriod: 15m
exchanges: [{"eid":"Futures_Binance","currency":"BTC_USDT"}]
*/

//@version=5
strategy("Stochaholic Strategy", shorttitle="Stochaholic Strat", overlay=true)

// Indicator parameters
length = input.int(14, "Length")

// Source
src = hlc3

// Calculations for the Stochaholic indicator
k1 = ta.ema(ta.sma(ta.stoch(src, high, low, length), 3), 3)
k2 = ta.ema(ta.sma(ta.stoch(src, high, low, length), 4), 3)
k3 = ta.ema(ta.sma(ta.stoch(src, high, low, length), 5), 3)
k4 = ta.ema(ta.sma(ta.stoch(src, high, low, length), 6), 3)
k5 = ta.ema(ta.sma(ta.stoch(src, high, low, length), 7), 3)
k6 = ta.ema(ta.sma(ta.stoch(src, high, low, length), 8), 3)
k7 = ta.ema(ta.sma(ta.stoch(src, high, low, length), 9), 3)
k8 = ta.ema(ta.sma(ta.stoch(src, high, low, length), 10), 3)

// Plotting the Stochaholic lines
// plot(k1, linewidth=2, color=k1 >= k2 ? color.lime : color.red)
// plot(k2, linewidth=2, color=k2 >= k3 ? color.lime : color.red)
// plot(k3, linewidth=2, color=k3 >= k4 ? color.lime : color.red)
// plot(k4, linewidth=2, color=k4 >= k5 ? color.lime : color.red)
// plot(k5, linewidth=2, color=k5 >= k6 ? color.lime : color.red)
// plot(k6, linewidth=2, color=k6 >= k7 ? color.lime : color.red)
// plot(k7, linewidth=2, color=k7 >= k8 ? color.lime : color.red)
// plot(k8, linewidth=2, color=k8 >= k8[1] ? color.lime : color.red)

// Overbought and Oversold Levels
// hline(80, color=color.red, title="OB Level")
// hline(50, linewidth=1, title="Mid Level")
// hline(20, color=color.green, title="OS Level")

// Strategy logic
longCondition = (k1 >= k2 and k2 >= k3 and k3 >= k4 and k4 >= k5 and k5 >= k6 and k6 >= k7 and k7 >= k8 and k8 >= k8[1])
shortCondition = (k1 < k2 and k2 < k3 and k3 < k4 and k4 < k5 and k5 < k6 and k6 < k7 and k7 < k8 and k8 < k8[1])

if (longCondition)
    strategy.entry("Buy", strategy.long)
if (shortCondition)
    strategy.entry("Short", strategy.short)
Detail
https://www.fmz.com/strategy/458136
Last Modified
2024-07-30 11:04:02