
16 KiB
Name
多重蜡烛形态识别与自动交易策略-Multi-Candlestick-Pattern-Recognition-and-Automated-Trading-Strategy
Author
ianzeng123
Strategy Description
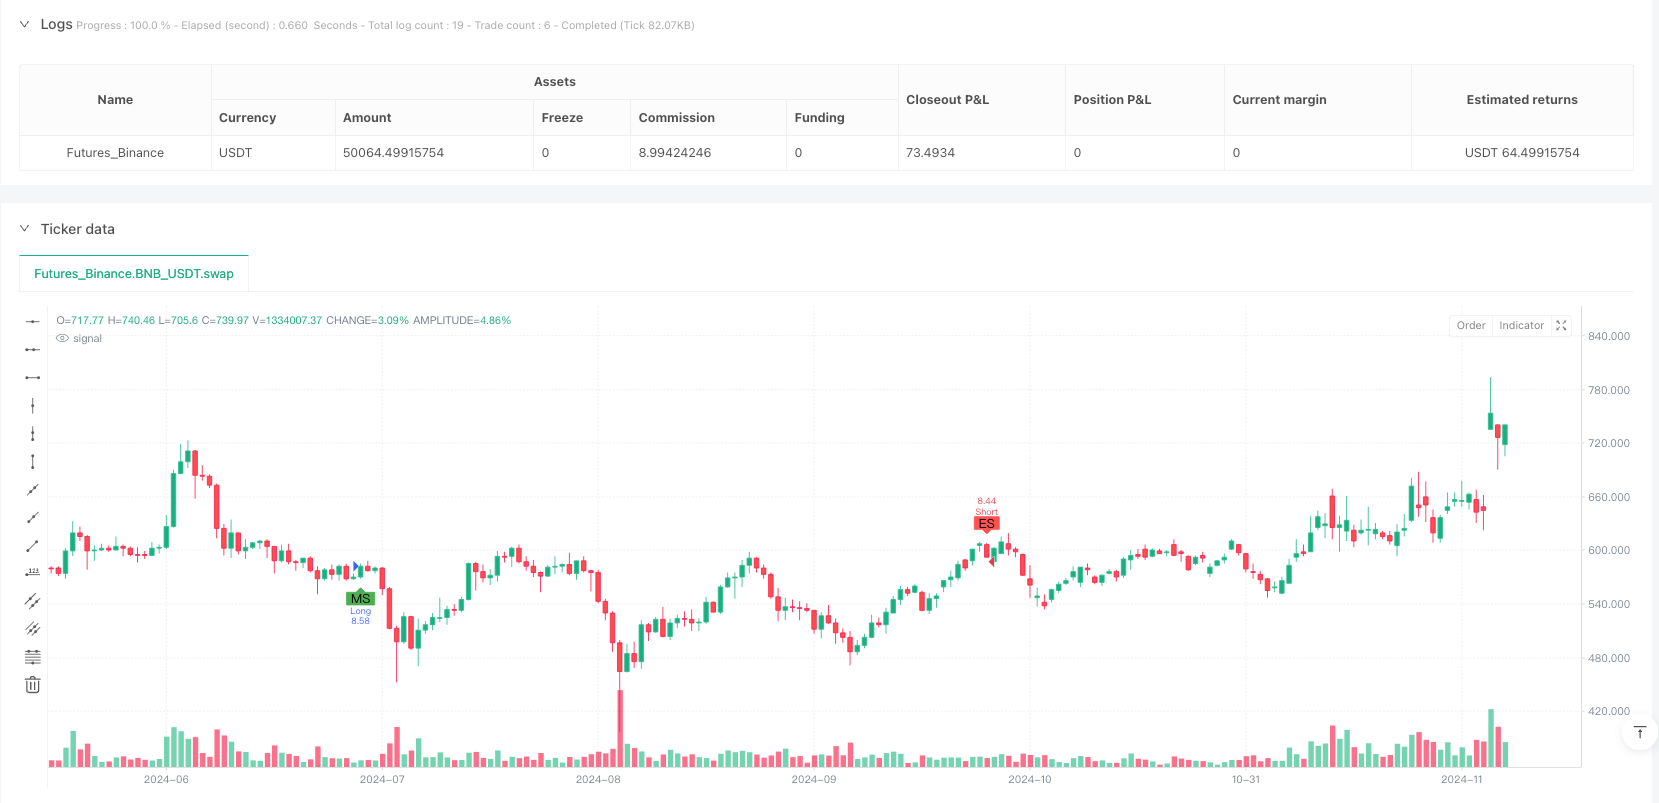
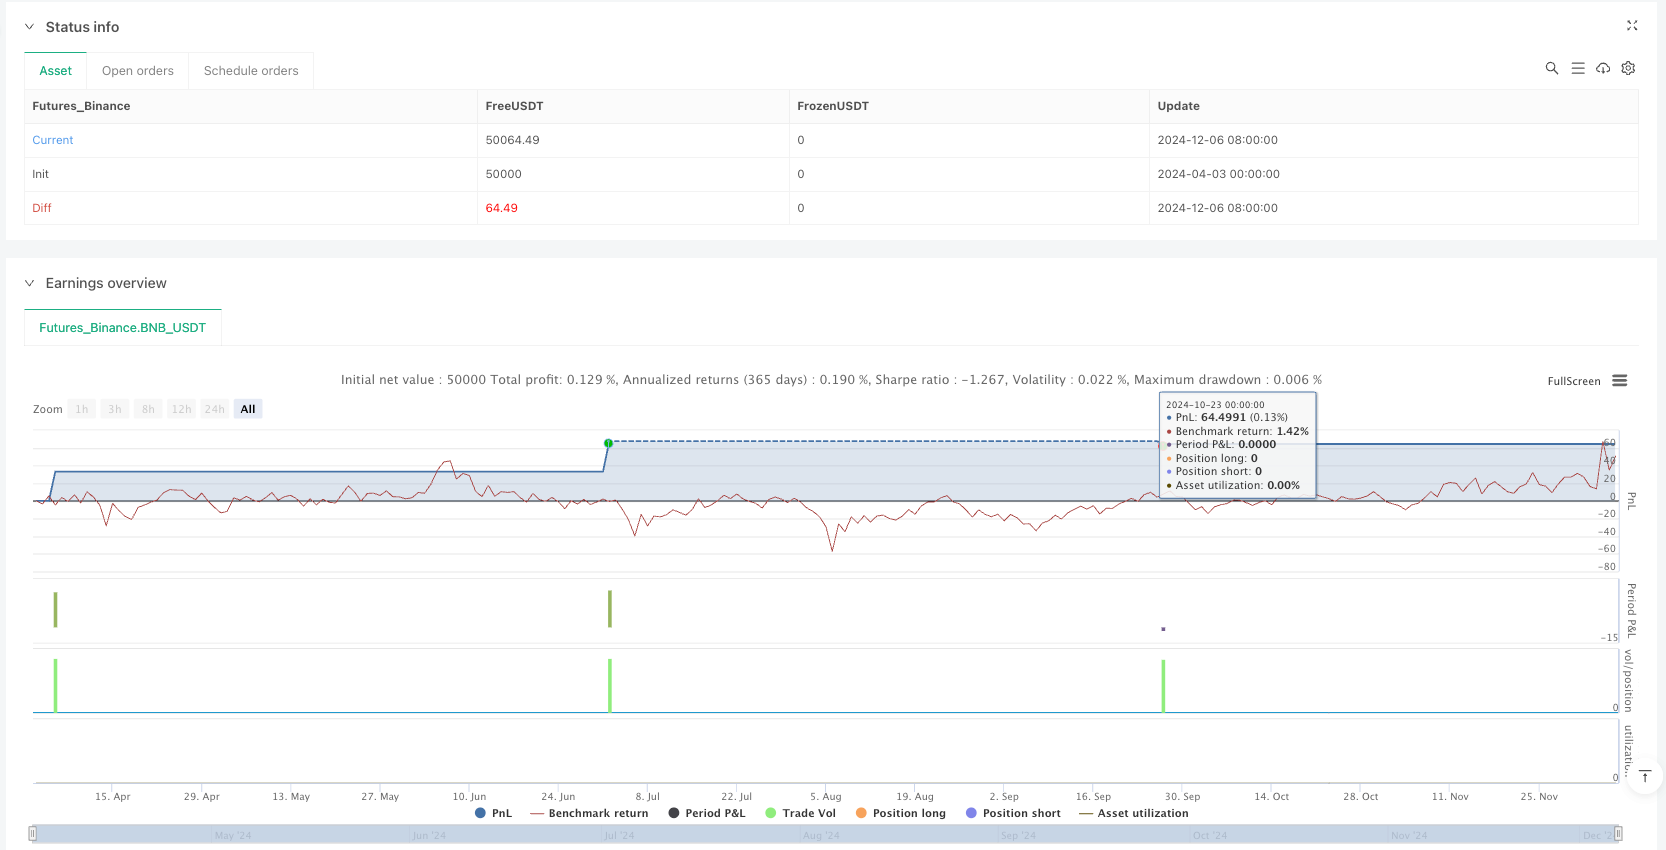
[trans]
概述
多重蜡烛形态识别与自动交易策略是一种基于价格行为分析的量化交易系统,专门识别市场中的"晨星"和"夜星"形态,这两种形态在技术分析中被广泛认为是强有力的反转信号。该策略通过精确定义的数学模型来识别这些模式,并根据形态出现自动执行多头或空头交易。系统采用了1%的获利目标和0.5%的止损点,实现风险与回报的2:1比率,这是专业交易者常用的风险管理原则。该策略不仅能帮助交易者客观地识别市场反转点,还通过自动化执行消除了情绪偏见,使投资决策更加客观和系统化。
策略原理
该策略的核心在于通过精确的数学方法识别"晨星"和"夜星"蜡烛形态。这些形态通常由三根连续蜡烛组成,具有特定的结构特征:
-
晨星形态:
- 第一根蜡烛:下跌趋势中的大实体阴线
- 第二根蜡烛:小实体或十字星,表示市场不确定性
- 第三根蜡烛:大实体阳线,收盘价至少超过第一根蜡烛中点
-
夜星形态:
- 第一根蜡烛:上涨趋势中的大实体阳线
- 第二根蜡烛:小实体或十字星,表示市场不确定性
- 第三根蜡烛:大实体阴线,收盘价至少低于第一根蜡烛中点
策略采用了多个辅助函数来计算关键特征:
bullish/bearish函数确定蜡烛的方向bodySize/candleRange计算蜡烛实体和总范围大小smallBody/strongBody评估蜡烛实体的相对大小isMiddleReversalCandle识别中间的反转蜡烛特征
当系统确认形态后,会自动执行相应的多头或空头交易,并设置1%的获利目标和0.5%的止损水平,形成2:1的风险回报比。这种比率在专业交易中被广泛认为是可持续的风险管理方法。
策略优势
-
客观的入场信号:通过明确的数学定义,该策略消除了主观判断,提供了客观一致的入场信号,避免了人为偏见和情绪化决策。
-
完善的风险管理:内置的2:1风险回报比(1%获利目标,0.5%止损)确保了纪律严明的资金管理,长期来看即使胜率只有40%也能实现盈利。
-
适应多市场和时间框架:该策略基于普遍存在的价格行为模式,可以应用于多种金融市场和时间框架,增强了其灵活性和实用性。
-
精细的模式识别:代码中的
strongBody、smallBody和isMiddleReversalCandle函数通过详细分析蜡烛特征,提高了模式识别的准确性,减少了误报。 -
自动化执行:策略自动识别形态并执行交易,消除了手动交易中的犹豫和延迟,确保按计划执行交易。
-
可视化确认:通过在图表上标记识别出的形态,交易者可以容易地回测和验证策略效果,便于持续改进。
策略风险
-
假突破风险:蜡烛形态在某些市场条件下可能产生假信号,尤其是在低波动性环境或横盘市场中。可以通过增加额外的确认指标(如成交量或动量指标)来减轻这一风险。
-
固定百分比止损局限性:策略使用固定百分比作为止损和获利点,这可能不适合所有市场的波动特性。考虑使用基于ATR(Average True Range)的动态止损可能更为适合。
-
缺乏趋势过滤:当前策略没有考虑更大的市场趋势,可能导致在强趋势逆势交易而频繁止损。加入趋势指标(如移动平均线)过滤信号可以提高成功率。
-
过度优化风险:当前参数(如0.3和0.6的身体比例阈值)可能过度拟合历史数据,而在未来市场中表现不佳。进行稳健的回测和前向测试至关重要。
-
缺乏成交量确认:该策略仅基于价格行为,未考虑成交量,而成交量是确认反转有效性的重要因素。将成交量分析整合到策略中可以提高信号质量。
策略优化方向
-
增加趋势过滤器:实施移动平均线或趋势强度指标,仅在趋势方向上交易反转形态。例如,只在上升趋势中交易晨星形态,只在下降趋势中交易夜星形态,可以显著提高胜率。
-
整合成交量确认:将成交量模式添加为额外确认因素。理想情况下,晨星形态的第三根蜡烛应伴随成交量增加,而夜星形态的第三根蜡烛也应有较高成交量支持。
-
实施动态止损:用基于市场波动性的动态止损替代固定百分比止损,如使用ATR倍数设置止损位,使其更适应当前市场环境。
-
添加多重时间框架分析:结合更高时间框架的市场结构分析,确保交易方向与更大趋势一致,避免在主要趋势中逆势交易。
-
优化参数设置:对各种市场和时间框架进行广泛回测,以找到更稳健的参数值。特别是,
smallBody和strongBody的阈值可以进行调整以提高形态识别的准确性。 -
加入时间过滤器:市场在不同交易时段表现不同,增加时间过滤器可以避开低效交易时段,如市场开盘和收盘时的高波动性时期。
总结
多重蜡烛形态识别与自动交易策略代表了一种结合传统技术分析与现代量化方法的综合解决方案。通过精确识别晨星和夜星形态,策略为交易者提供了客观的市场反转入场点,同时通过自动化交易和严格的风险管理增强了执行纪律。
虽然基础策略已经很完善,但通过增加趋势过滤、成交量确认和动态风险管理等优化,策略性能可以进一步提升。重要的是,交易者应认识到,任何策略都需要在特定市场环境中进行全面回测和验证,以确保其稳健性和可靠性。
最后,这种策略不仅提供了交易信号,还为理解市场结构和价格行为提供了教育价值。通过观察这些经典形态的形成,交易者可以更深入地理解市场心理和潜在的供需不平衡,从而培养更成熟的市场洞察力。 ||
Overview
The Multi-Candlestick Pattern Recognition and Automated Trading Strategy is a quantitative trading system based on price action analysis, specifically designed to identify "Morning Star" and "Evening Star" formations, which are widely regarded as powerful reversal signals in technical analysis. This strategy employs a mathematically defined model to recognize these patterns and automatically executes long or short trades based on their occurrence. The system implements a 1% take profit and 0.5% stop loss, creating a 2:1 reward-to-risk ratio, which aligns with professional trading risk management principles. This strategy not only helps traders objectively identify market reversal points but also eliminates emotional bias through automated execution, making investment decisions more objective and systematic.
Strategy Principles
The core of this strategy lies in identifying Morning Star and Evening Star candlestick patterns through precise mathematical methods. These patterns typically consist of three consecutive candles with specific structural characteristics:
-
Morning Star Pattern:
- First candle: A large bearish body in a downtrend
- Second candle: A small body or doji, indicating market uncertainty
- Third candle: A large bullish body with a close above the midpoint of the first candle
-
Evening Star Pattern:
- First candle: A large bullish body in an uptrend
- Second candle: A small body or doji, indicating market uncertainty
- Third candle: A large bearish body with a close below the midpoint of the first candle
The strategy employs several helper functions to calculate key characteristics:
bullish/bearishfunctions determine candle directionbodySize/candleRangecalculate the size of candle bodies and rangessmallBody/strongBodyevaluate the relative size of candle bodiesisMiddleReversalCandleidentifies middle reversal candle features
When the system confirms a pattern, it automatically executes the corresponding long or short trade with a 1% take profit and 0.5% stop loss level, forming a 2:1 reward-to-risk ratio. This ratio is widely considered a sustainable risk management approach in professional trading.
Strategy Advantages
-
Objective Entry Signals: Through clear mathematical definitions, the strategy eliminates subjective judgment, providing objective and consistent entry signals that avoid human bias and emotional decision-making.
-
Robust Risk Management: The built-in 2:1 reward-to-risk ratio (1% take profit, 0.5% stop loss) ensures disciplined money management, allowing for profitability in the long run even with a win rate as low as 40%.
-
Adaptability Across Markets and Timeframes: The strategy is based on universally present price action patterns, making it applicable across various financial markets and timeframes, enhancing its flexibility and utility.
-
Refined Pattern Recognition: The code's
strongBody,smallBody, andisMiddleReversalCandlefunctions analyze candle characteristics in detail, improving the accuracy of pattern recognition and reducing false positives. -
Automated Execution: The strategy automatically identifies patterns and executes trades, eliminating hesitation and delays associated with manual trading, ensuring trades are executed according to plan.
-
Visual Confirmation: By marking identified patterns on the chart, traders can easily backtest and verify strategy performance, facilitating continuous improvement.
Strategy Risks
-
False Breakout Risk: Candlestick patterns may generate false signals in certain market conditions, particularly in low-volatility environments or ranging markets. This risk can be mitigated by adding additional confirmation indicators such as volume or momentum oscillators.
-
Fixed Percentage Stop Loss Limitations: The strategy uses fixed percentages for stop loss and take profit points, which may not be suitable for the volatility characteristics of all markets. Considering dynamic stops based on ATR (Average True Range) might be more appropriate.
-
Lack of Trend Filtering: The current strategy does not consider the broader market trend, potentially leading to frequent stop-outs when trading against strong trends. Adding trend indicators (such as moving averages) to filter signals could improve success rates.
-
Optimization Risk: Current parameters (such as 0.3 and 0.6 body proportion thresholds) may be overfitted to historical data and perform poorly in future markets. Robust backtesting and forward testing are essential.
-
Lack of Volume Confirmation: The strategy relies solely on price action without considering volume, which is an important factor in confirming the validity of reversals. Integrating volume analysis into the strategy could improve signal quality.
Strategy Optimization Directions
-
Add Trend Filters: Implement moving averages or trend strength indicators to only trade reversal patterns in the direction of the trend. For example, only trading Morning Stars in uptrends and Evening Stars in downtrends could significantly improve win rates.
-
Integrate Volume Confirmation: Add volume patterns as an additional confirmation factor. Ideally, the third candle of a Morning Star should be accompanied by increased volume, and the third candle of an Evening Star should also have substantial volume support.
-
Implement Dynamic Stop Losses: Replace fixed percentage stops with dynamic stops based on market volatility, such as using ATR multiples to set stop loss positions, making them more adaptable to current market conditions.
-
Add Multiple Timeframe Analysis: Incorporate market structure analysis from higher timeframes to ensure trade direction aligns with larger trends, avoiding trading against major trends.
-
Optimize Parameter Settings: Conduct extensive backtesting across various markets and timeframes to find more robust parameter values. In particular, the thresholds for
smallBodyandstrongBodycan be adjusted to improve pattern recognition accuracy. -
Incorporate Time Filters: Markets behave differently during various trading sessions. Adding time filters can avoid inefficient trading periods, such as high volatility periods during market openings and closings.
Summary
The Multi-Candlestick Pattern Recognition and Automated Trading Strategy represents a comprehensive solution that combines traditional technical analysis with modern quantitative methods. By precisely identifying Morning Star and Evening Star patterns, the strategy provides traders with objective market reversal entry points while enhancing execution discipline through automated trading and strict risk management.
While the base strategy is already well-developed, performance can be further enhanced through optimizations such as trend filtering, volume confirmation, and dynamic risk management. It is important for traders to recognize that any strategy requires comprehensive backtesting and validation in specific market environments to ensure its robustness and reliability.
Finally, this strategy not only provides trading signals but also offers educational value for understanding market structure and price action. By observing the formation of these classic patterns, traders can gain deeper insights into market psychology and potential supply-demand imbalances, fostering more mature market intuition.[/trans]
Source (PineScript)
/*backtest
start: 2024-04-03 00:00:00
end: 2024-12-07 00:00:00
period: 1d
basePeriod: 1d
exchanges: [{"eid":"Futures_Binance","currency":"BNB_USDT"}]
*/

//@version=6
strategy("Morning & Evening Star Strategy (1% TP, 0.5% SL)", overlay=true, default_qty_type=strategy.percent_of_equity, default_qty_value=10)

// === Inputs ===
slPercent = 0.5
tpPercent = 1.0

// === Helper Functions ===
bullish(open, close) => close > open
bearish(open, close) => close < open
bodySize(open, close) => math.abs(close - open)
candleRange(high, low) => high - low

smallBody(open, close, high, low) =>
    bodySize(open, close) < (candleRange(high, low) * 0.3)

strongBody(open, close, high, low) =>
    bodySize(open, close) > (candleRange(high, low) * 0.6)

isMiddleReversalCandle(open, close, high, low) =>
    bSize = bodySize(open, close)
    cRange = candleRange(high, low)
    upperWick = high - math.max(open, close)
    lowerWick = math.min(open, close) - low
    smallBody(open, close, high, low) or (bSize < cRange * 0.4 and (upperWick > cRange * 0.3 or lowerWick > cRange * 0.3))

// === Candle Values for Last 3 Bars ===
o3 = open[2]
c3 = close[2]
h3 = high[2]
l3 = low[2]

o2 = open[1]
c2 = close[1]
h2 = high[1]
l2 = low[1]

o1 = open
c1 = close
h1 = high
l1 = low

// === Pattern Conditions ===
isMorningStar = bearish(o3, c3) and strongBody(o3, c3, h3, l3) and
                 isMiddleReversalCandle(o2, c2, h2, l2) and
                 bullish(o1, c1) and strongBody(o1, c1, h1, l1) and
                 c1 > (o3 + c3) / 2

isEveningStar = bullish(o3, c3) and strongBody(o3, c3, h3, l3) and
                 isMiddleReversalCandle(o2, c2, h2, l2) and
                 bearish(o1, c1) and strongBody(o1, c1, h1, l1) and
                 c1 < (o3 + c3) / 2

// === Entry & Exit ===
if isMorningStar
    strategy.entry("Long", strategy.long)
    strategy.exit("TP/SL Long", from_entry="Long", loss=slPercent * close / 100, profit=tpPercent * close / 100)

if isEveningStar
    strategy.entry("Short", strategy.short)
    strategy.exit("TP/SL Short", from_entry="Short", loss=slPercent * close / 100, profit=tpPercent * close / 100)

// === Visual Labels ===
plotshape(isMorningStar, title="Morning Star", location=location.belowbar, color=color.green, style=shape.labelup, text="MS")
plotshape(isEveningStar, title="Evening Star", location=location.abovebar, color=color.red, style=shape.labeldown, text="ES")
Detail
https://www.fmz.com/strategy/489295
Last Modified
2025-04-03 11:10:20