
12 KiB
Name
多重级别ZigZag百分比回撤与随机指标结合交易策略-Multi-Level-ZigZag-Percentage-Retracement-with-Stochastic-Trading-Strategy
Author
ianzeng123
Strategy Description
[trans]
概述
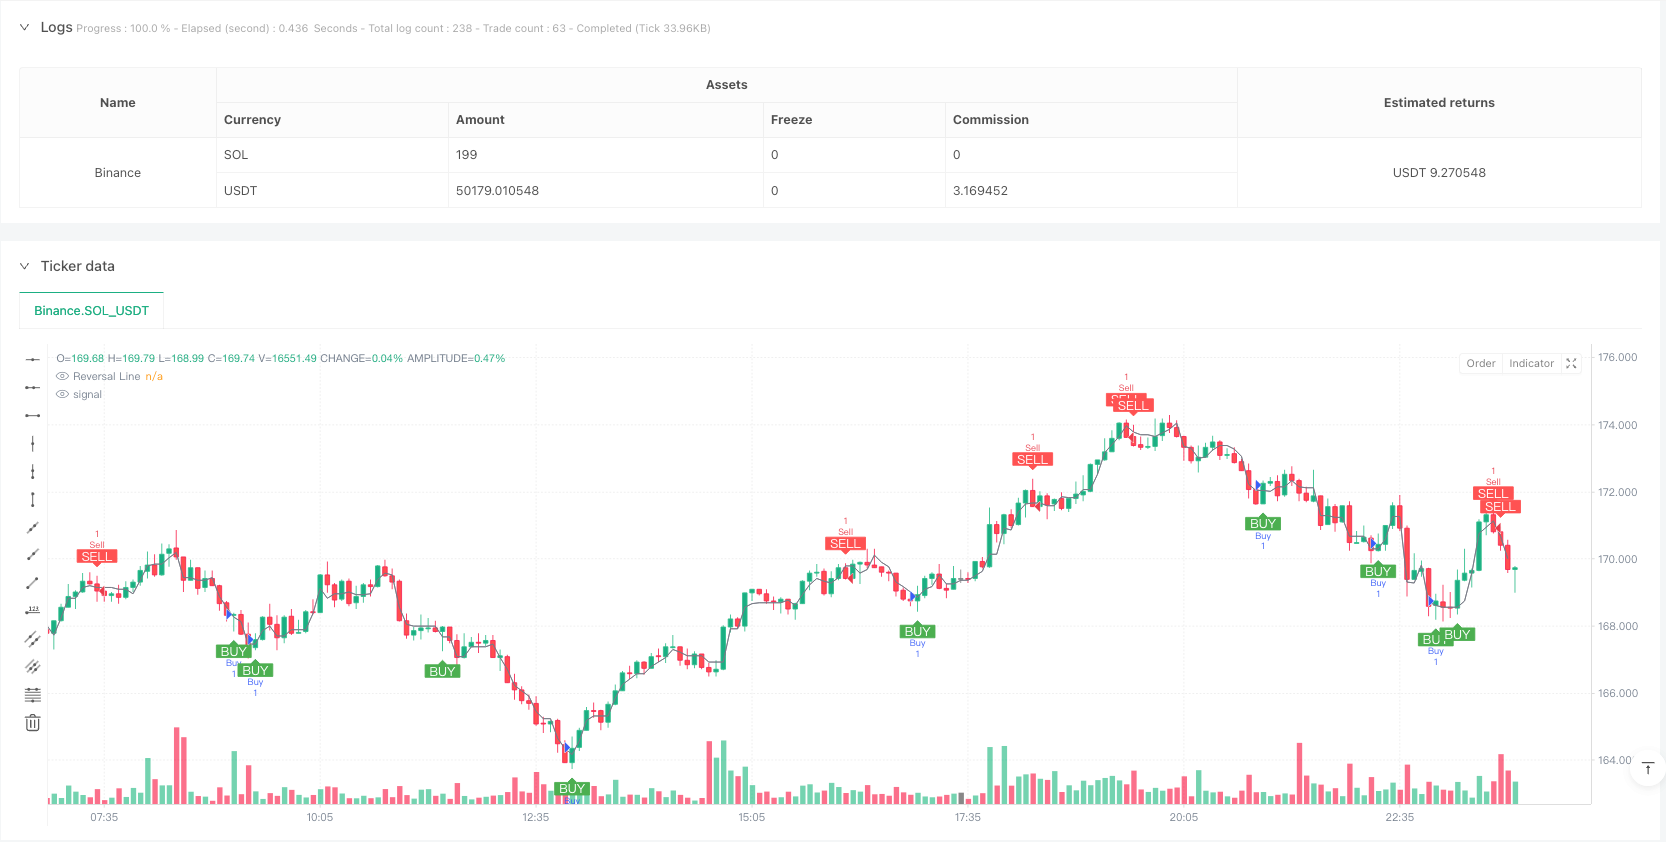
该策略是一个结合了ZigZag百分比回撤和随机指标(Stochastic)的交易系统。策略通过动态调整的ZigZag指标来识别市场趋势的关键转折点,并结合随机指标的超买超卖信号来优化入场时机。系统还整合了止损和止盈机制,以实现风险管理。
策略原理
策略的核心逻辑基于以下几个关键组件:
- 动态ZigZag指标 - 支持手动设置或基于不同周期(5-250)的ATR动态调整回撤百分比
- 随机指标过滤 - 使用9周期K值和3周期平滑的随机指标
- 交易信号生成:
- 买入条件:价格突破反转线且随机指标K值低于20
- 卖出条件:价格跌破反转线且随机指标K值高于80
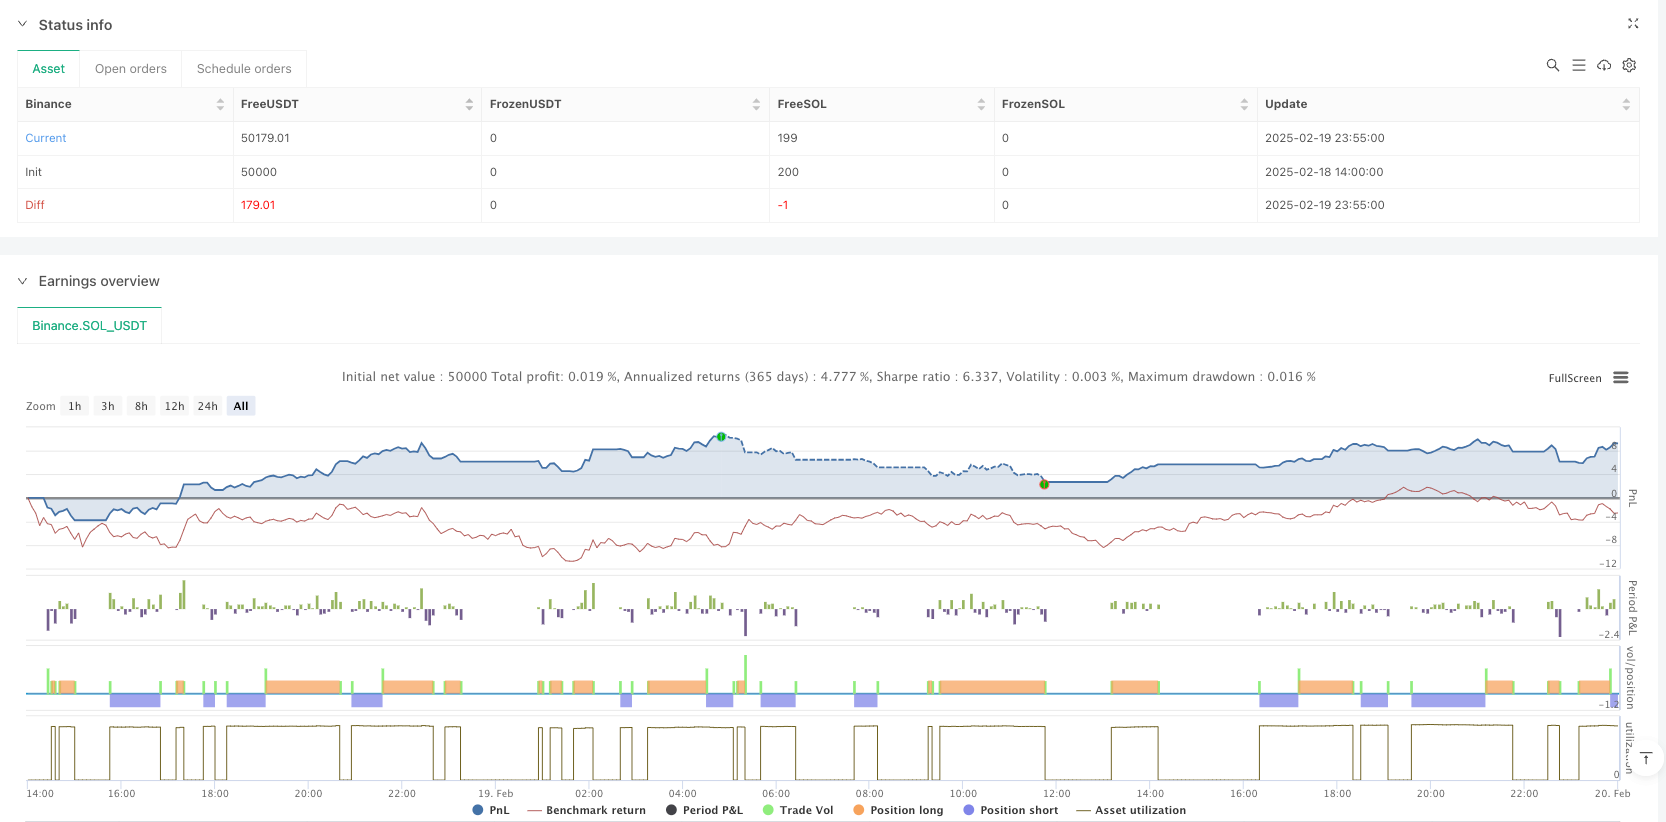
- 风险管理 - 采用固定点数的止损(100点)和止盈(300点)
策略优势
- 适应性强 - 通过ATR动态调整使策略更好地适应不同市场环境
- 多重确认 - 结合趋势和动量指标,降低假信号
- 风险可控 - 具备完善的止损止盈机制
- 信号明确 - 交易信号清晰,易于执行
- 参数灵活 - 支持多种参数自定义,便于优化
策略风险
- 震荡市场风险 - 在区间震荡行情中可能频繁触发止损
- 滑点风险 - 在快速行情中可能面临较大滑点
- 固定止损风险 - 固定点数止损可能不适合所有市场环境
- 假突破风险 - 可能在盘整区间产生虚假突破信号
- 参数敏感性 - 参数选择对策略表现影响较大
策略优化方向
- 动态止损优化 - 考虑使用ATR或波动率动态调整止损位置
- 市场环境过滤 - 添加趋势强度指标,在强趋势时才开仓
- 信号确认增强 - 可考虑添加成交量确认
- 入场时机优化 - 引入价格形态识别,提高入场精度
- 仓位管理完善 - 基于波动率动态调整持仓规模
总结
该策略通过结合ZigZag和随机指标,构建了一个较为完整的交易系统。策略的主要特点是信号明确、风险可控,但仍需要根据实际市场情况进行参数优化。建议在实盘交易前进行充分的回测,并结合市场经验对策略进行持续改进。
||
Overview
This strategy combines ZigZag percentage retracement with the Stochastic indicator to create a comprehensive trading system. It identifies key market turning points using a dynamically adjusted ZigZag indicator while optimizing entry timing using Stochastic overbought/oversold signals. The system also incorporates stop-loss and take-profit mechanisms for risk management.
Strategy Principles
The core logic is based on several key components:
- Dynamic ZigZag indicator - Supports manual setting or ATR-based dynamic adjustment of retracement percentage across different periods (5-250)
- Stochastic filter - Uses 9-period K value with 3-period smoothing
- Trade signal generation:
- Buy signal: Price breaks above reversal line and Stochastic K value below 20
- Sell signal: Price breaks below reversal line and Stochastic K value above 80
- Risk management - Fixed point-based stop-loss (100 points) and take-profit (300 points)
Strategy Advantages
- High adaptability - ATR-based dynamic adjustment for different market conditions
- Multiple confirmations - Combines trend and momentum indicators to reduce false signals
- Controlled risk - Comprehensive stop-loss and take-profit mechanisms
- Clear signals - Trading signals are distinct and easy to execute
- Flexible parameters - Supports multiple customizable parameters for optimization
Strategy Risks
- Choppy market risk - May trigger frequent stop-losses in ranging markets
- Slippage risk - Potential for significant slippage in fast-moving markets
- Fixed stop-loss risk - Fixed point-based stops may not suit all market conditions
- False breakout risk - May generate false signals in consolidation zones
- Parameter sensitivity - Strategy performance heavily depends on parameter selection
Optimization Directions
- Dynamic stop-loss - Consider using ATR or volatility for dynamic stop adjustment
- Market environment filter - Add trend strength indicators for strong trend validation
- Signal confirmation enhancement - Consider adding volume confirmation
- Entry timing optimization - Incorporate price pattern recognition
- Position management improvement - Implement volatility-based position sizing
Summary
The strategy builds a comprehensive trading system by combining ZigZag and Stochastic indicators. Its main features are clear signals and controlled risk, but it requires parameter optimization based on actual market conditions. It's recommended to conduct thorough backtesting and make continuous improvements based on market experience before live trading.[/trans]
Source (PineScript)
/*backtest
start: 2025-02-18 14:00:00
end: 2025-02-20 00:00:00
period: 5m
basePeriod: 5m
exchanges: [{"eid":"Binance","currency":"SOL_USDT"}]
*/

//@version=5
strategy("[RS]ZigZag Percent Reversal with Stochastic Strategy", overlay=true)

//  ||---}---------------------------------------------------------------------||

//  |--------------------------------------------------------------------------||
//  |   ZigZag:                                                                ||
//  |--------------------------------------------------------------------------||
//  |{
string percent_method = input.string(
         defval="MANUAL",
         title="Method to use for the zigzag reversal range:",
         options=[
             "MANUAL",
             "ATR005 * X", "ATR010 * X", "ATR020 * X", "ATR050 * X", "ATR100 * X", "ATR250 * X"
             ]
         )

var float percent = input.float(
         defval=0.25,
         title="Percent of last pivot price for zigzag reversal:",
         minval=0.0, maxval=99.0
         ) / 100

float percent_multiplier = input.float(
         defval=1.0,
         title="Multiplier to apply to ATR if applicable:"
         )
if percent_method == "ATR005 * X"
    percent := ta.atr(5) / open * percent_multiplier
if percent_method == "ATR010 * X"
    percent := ta.atr(10) / open * percent_multiplier
if percent_method == "ATR020 * X"
    percent := ta.atr(20) / open * percent_multiplier
if percent_method == "ATR050 * X"
    percent := ta.atr(50) / open * percent_multiplier
if percent_method == "ATR100 * X"
    percent := ta.atr(100) / open * percent_multiplier
if percent_method == "ATR250 * X"
    percent := ta.atr(250) / open * percent_multiplier

//  ||-------------------------------------------------------------------------||
//  ||  zigzag function:
//  ||-------------------------------------------------------------------------||
//  |{
f_zz(_percent)=>


    //  direction after last pivot
    var bool _is_direction_up = na
    //  track highest price since last lower pivot
    var float _htrack = na
    //  track lowest price since last higher pivot
    var float _ltrack = na
    //  zigzag variable for plotting
    var float _pivot = na
    //  range needed for reaching reversal threshold
    float _reverse_range = 0.0
    //  real pivot time
    var int _real_pivot_time = na
    var int _htime = na
    var int _ltime = na
    //  reverse line
    var float _reverse_line = na

    if bar_index >= 1

        if na(_is_direction_up)
            _is_direction_up := true

        _reverse_range := nz(_pivot[1]) * _percent

        if _is_direction_up
            _ltrack := na
            _ltime := time

            if na(_htrack)
                if high > high[1]
                    _htrack := high
                    _htime := time
                else
                    _htrack := high[1]
                    _htime := time[1]
            else
                if high > _htrack
                    _htrack := high
                    _htime := time

            // Reversal line calculation based on the current candle's closing price
            _reverse_line := _htrack - _reverse_range

            // If close <= reversal line, mark pivot and reverse direction
            if close <= _reverse_line
                _pivot := _htrack
                _real_pivot_time := _htime
                _is_direction_up := false

        if not _is_direction_up
            _htrack := na
            _htime := na

            if na(_ltrack)
                if low < low[1]
                    _ltrack := low
                    _ltime := time
                else
                    _ltrack := low[1]
                    _ltime := time[1]
            else
                if low < _ltrack
                    _ltrack := low
                    _ltime := time

            // Reversal line calculation based on the current candle's closing price
            _reverse_line := _ltrack + _reverse_range

            // If close >= reversal line, mark pivot and reverse direction
            if close >= _reverse_line
                _pivot := _ltrack
                _real_pivot_time := _ltime
                _is_direction_up := true

    [_pivot, _is_direction_up, _reverse_line, _real_pivot_time]

[pivot, direction_up, reverse_line, pivot_time] = f_zz(percent)

// Çizim
// Sabit Reversal Line (fiyat seviyesinde sabit)
var float static_reverse_line = na
if (not na(reverse_line))
    static_reverse_line := reverse_line

plot(series=static_reverse_line, color=color.gray, style=plot.style_line, title="Reversal Line", trackprice=false)

//  ||-------------------------------------------------------------------------||
//  ||  Stochastic:                                                            ||
//  ||-------------------------------------------------------------------------||
//  |{
K_length = 9
K_smoothing = 3

// Stochastic %K hesaplama
stochK = ta.sma(ta.stoch(close, high, low, K_length), K_smoothing)

//  ||-------------------------------------------------------------------------||
//  ||  Custom Buy/Sell Signals:
//  ||-------------------------------------------------------------------------||
//  |{
// Buy sinyali: Fiyat reversal line'ının üstünde ve stochastic K değeri 20'nin altında ise
buy_signal = close > static_reverse_line and stochK < 20

// Sell sinyali: Fiyat reversal line'ının altındaysa ve stochastic K değeri 80'in üstünde ise
sell_signal = close < static_reverse_line and stochK > 80

// Alım ve satım sinyali için strateji girişlerini ekle
long_condition = buy_signal
short_condition = sell_signal

// **Burada Stop Loss ve Take Profit değerleri ayarlandı**
stop_loss_pips = 100  // Stop Loss 10 pip
take_profit_pips = 300  // Take Profit 30 pip

// Stop Loss ve Take Profit seviyeleri hesaplanıyor
long_stop_loss = close - stop_loss_pips * syminfo.mintick
long_take_profit = close + take_profit_pips * syminfo.mintick
short_stop_loss = close + stop_loss_pips * syminfo.mintick
short_take_profit = close - take_profit_pips * syminfo.mintick

// Long stratejisi: Alım sinyali ve stop loss/take profit seviyeleri ile
if long_condition
    strategy.entry("Buy", strategy.long, stop=long_stop_loss, limit=long_take_profit)
    strategy.exit("Take Profit / Stop Loss", from_entry="Buy", stop=long_stop_loss, limit=long_take_profit)
    // Webhook ile alım bildirimi gönder
    alert("Buy Signal Triggered!", alert.freq_once_per_bar)

// Short stratejisi: Satım sinyali ve stop loss/take profit seviyeleri ile
if short_condition
    strategy.entry("Sell", strategy.short, stop=short_stop_loss, limit=short_take_profit)
    strategy.exit("Take Profit / Stop Loss", from_entry="Sell", stop=short_stop_loss, limit=short_take_profit)
    // Webhook ile satım bildirimi gönder
    alert("Sell Signal Triggered!", alert.freq_once_per_bar)

// Alım sinyali gösterimi
plotshape(series=buy_signal, location=location.belowbar, color=color.green, style=shape.labelup, title="Buy Signal", text="BUY", textcolor=color.white)
// Satım sinyali gösterimi
plotshape(series=sell_signal, location=location.abovebar, color=color.red, style=shape.labeldown, title="Sell Signal", text="SELL", textcolor=color.white)
Detail
https://www.fmz.com/strategy/483057
Last Modified
2025-02-21 11:18:39