
10 KiB
Name
多重时间框架趋势跟踪交易系统MTF-ATR-MACD-Multi-Timeframe-Trend-Following-Trading-System-with-ATR-and-MACD-Integration
Author
ChaoZhang
Strategy Description
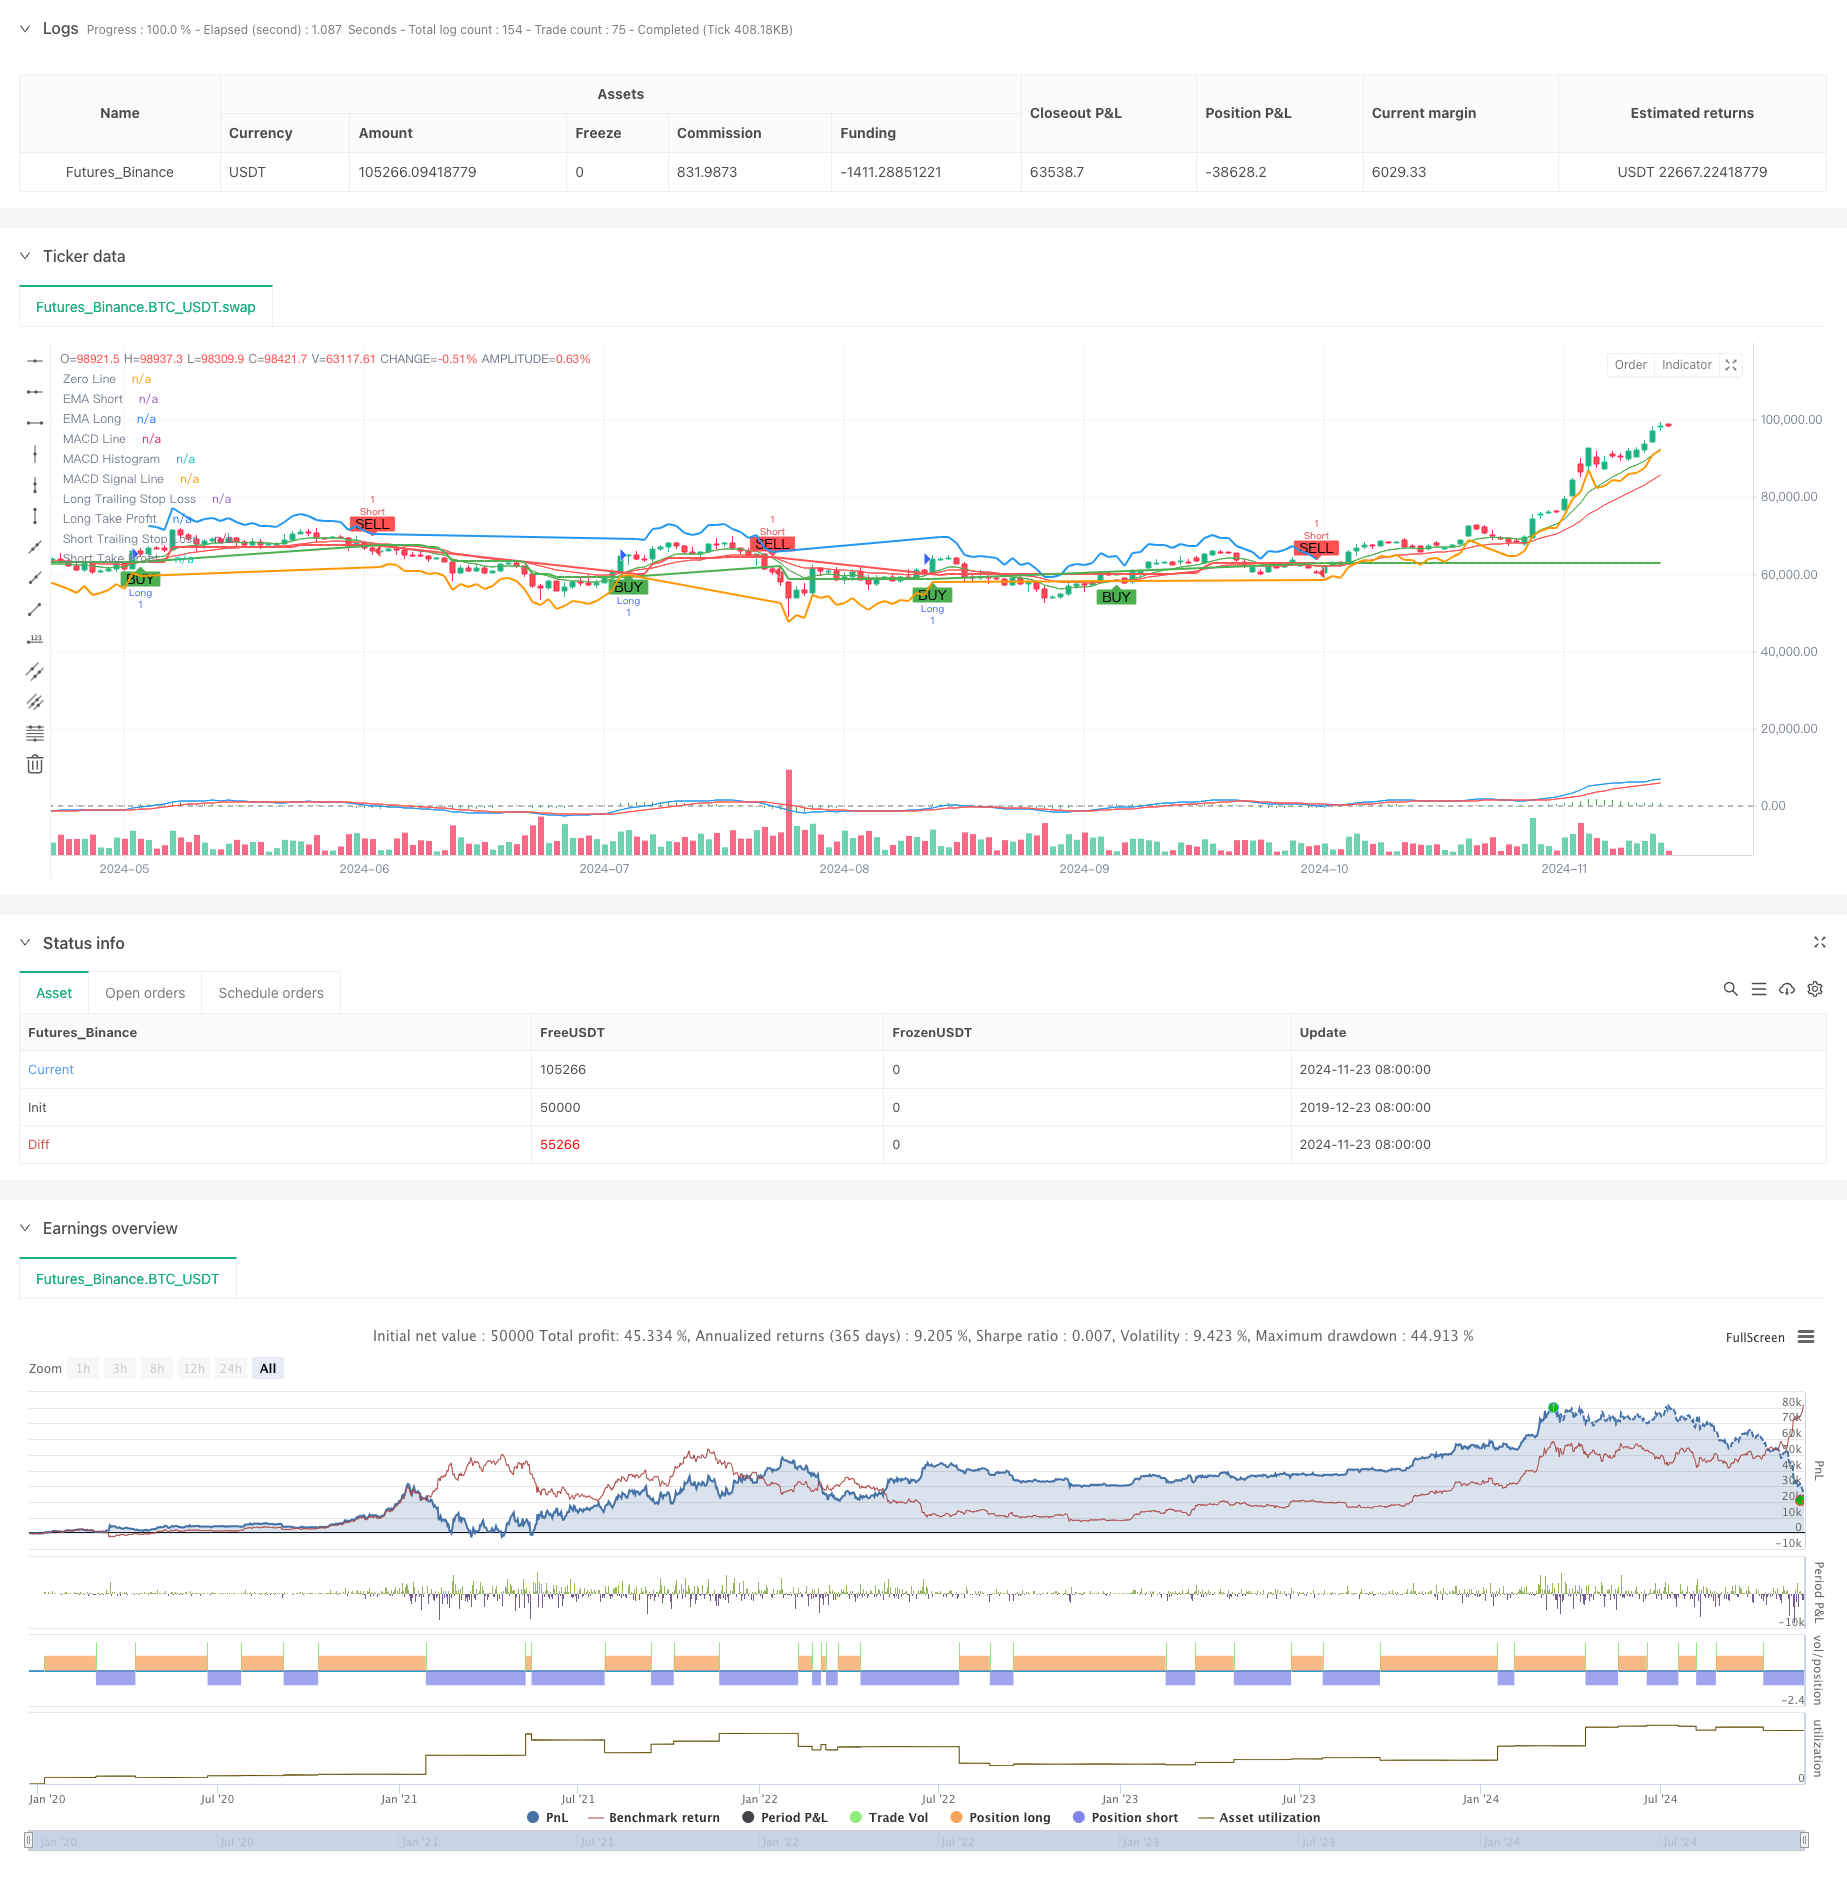
[trans]
概述
该策略是一个综合性的趋势跟踪交易系统,结合了多重时间框架分析、均线系统、动量指标和波动率指标。系统通过短期与长期指数移动平均线(EMA)的交叉来识别趋势方向,使用相对强弱指标(RSI)进行超买超卖判断,结合MACD进行动量确认,并利用更高时间框架EMA作为趋势过滤器。系统采用基于ATR的动态止损和获利方案,可以根据市场波动性自适应调整。
策略原理
策略采用多层验证机制进行交易决策:
- 趋势识别层:使用9期和21期EMA的交叉来捕捉趋势变化
- 动量确认层:通过MACD指标(12,26,9)的交叉和方向验证趋势动量
- 超买超卖过滤:利用RSI(14)指标在70/30水平进行过滤
- 高时间框架确认:可选择性地使用日线级别EMA作为趋势过滤器
- 风险管理层:使用1.5倍ATR作为追踪止损,2倍ATR设置获利目标
系统在满足多重条件后才会开仓:EMA交叉、RSI未到极值、MACD方向正确且高时间框架趋势确认。出场采用追踪止损和固定获利目标相结合的方式。
策略优势
- 多重验证机制显著降低假信号
- 高时间框架趋势过滤提升胜率
- 基于波动率的动态止损适应性强
- 完整的风险管理体系
- 参数可根据不同市场特征灵活调整
- 支持双向交易,可适应不同市场环境
- 指标组合既照顾趋势又关注动量
策略风险
- 多重条件可能导致错过部分交易机会
- 在震荡市场中可能频繁交易
- 参数优化可能导致过度拟合
- 高时间框架确认可能导致入场延迟 解决方案:
- 根据不同市场特征动态调整参数
- 增加交易方向选择的灵活性
- 引入波动率过滤机制
- 优化参数自适应机制
策略优化方向
- 引入波动率过滤机制,在高波动期间调整仓位
- 开发参数自适应机制,根据市场状态动态调整
- 增加成交量指标确认信号有效性
- 优化高时间框架趋势判断逻辑
- 完善止损方案,考虑增加时间止损
- 开发策略性能评估模块
总结
该策略是一个完整的趋势跟踪交易系统,通过多重技术指标的组合和严格的风险管理制度,能够在趋势市场中获得稳定收益。系统的可扩展性强,通过优化可以适应不同的市场环境。建议在实盘交易前进行充分的回测和参数优化。
||
Overview
This strategy is a comprehensive trend following trading system that combines multi-timeframe analysis, moving averages, momentum indicators, and volatility indicators. The system identifies trend direction through crossovers of short-term and long-term exponential moving averages (EMA), uses the Relative Strength Index (RSI) for overbought/oversold conditions, incorporates MACD for momentum confirmation, and utilizes higher timeframe EMA as a trend filter. The system employs ATR-based dynamic stop-loss and take-profit mechanisms that adapt to market volatility.
Strategy Principles
The strategy employs a multi-layer verification mechanism for trading decisions:
- Trend Identification: Uses 9 and 21 period EMA crossovers to capture trend changes
- Momentum Confirmation: Verifies trend momentum through MACD (12,26,9) crossovers and direction
- Overbought/Oversold Filter: Uses RSI(14) indicator at 70/30 levels for filtering
- Higher Timeframe Confirmation: Optional daily EMA as trend filter
- Risk Management: Uses 1.5x ATR for trailing stop-loss and 2x ATR for profit targets
The system only enters trades when multiple conditions are met: EMA crossover, RSI not at extreme levels, correct MACD direction, and higher timeframe trend confirmation. Exits combine trailing stops with fixed profit targets.
Strategy Advantages
- Multiple verification mechanisms significantly reduce false signals
- Higher timeframe trend filtering improves win rate
- Volatility-based dynamic stops provide strong adaptability
- Comprehensive risk management system
- Parameters can be flexibly adjusted for different markets
- Supports bilateral trading, adapting to various market environments
- Indicator combination considers both trend and momentum
Strategy Risks
- Multiple conditions may cause missed trading opportunities
- Frequent trading possible in ranging markets
- Parameter optimization may lead to overfitting
- Higher timeframe confirmation may delay entries Solutions:
- Dynamically adjust parameters based on market characteristics
- Increase flexibility in trading direction selection
- Introduce volatility filtering mechanism
- Optimize parameter adaptation mechanism
Optimization Directions
- Implement volatility filtering to adjust position sizing in high volatility periods
- Develop parameter adaptation mechanism based on market state
- Add volume indicators to confirm signal validity
- Optimize higher timeframe trend judgment logic
- Enhance stop-loss strategy, consider adding time-based exits
- Develop strategy performance evaluation module
Summary
This strategy is a complete trend following trading system that can achieve stable returns in trending markets through the combination of multiple technical indicators and strict risk management protocols. The system is highly extensible and can adapt to different market environments through optimization. Thorough backtesting and parameter optimization are recommended before live trading. [/trans]
Source (PineScript)
/*backtest
start: 2019-12-23 08:00:00
end: 2024-11-24 00:00:00
period: 1d
basePeriod: 1d
exchanges: [{"eid":"Futures_Binance","currency":"BTC_USDT"}]
*/

//@version=5
strategy("Trend Following with ATR, MTF Confirmation, and MACD", overlay=true)

// Parameters
emaShortPeriod = input.int(9, title="Short EMA Period", minval=1)
emaLongPeriod = input.int(21, title="Long EMA Period", minval=1)
rsiPeriod = input.int(14, title="RSI Period", minval=1)
rsiOverbought = input.int(70, title="RSI Overbought", minval=50)
rsiOversold = input.int(30, title="RSI Oversold", minval=1)
atrPeriod = input.int(14, title="ATR Period", minval=1)
atrMultiplier = input.float(1.5, title="ATR Multiplier", minval=0.1)
takeProfitATRMultiplier = input.float(2.0, title="Take Profit ATR Multiplier", minval=0.1)

// Multi-timeframe settings
htfEMAEnabled = input.bool(true, title="Use Higher Timeframe EMA Confirmation?", inline="htf")
htfEMATimeframe = input.timeframe("D", title="Higher Timeframe", inline="htf")

// MACD Parameters
macdShortPeriod = input.int(12, title="MACD Short Period", minval=1)
macdLongPeriod = input.int(26, title="MACD Long Period", minval=1)
macdSignalPeriod = input.int(9, title="MACD Signal Period", minval=1)

// Select trade direction
tradeDirection = input.string("Both", title="Trade Direction", options=["Both", "Long", "Short"])

// Calculating indicators
emaShort = ta.ema(close, emaShortPeriod)
emaLong = ta.ema(close, emaLongPeriod)
rsiValue = ta.rsi(close, rsiPeriod)
atrValue = ta.atr(atrPeriod)

// Calculate MACD
[macdLine, macdSignalLine, _] = ta.macd(close, macdShortPeriod, macdLongPeriod, macdSignalPeriod)

// Higher timeframe EMA confirmation
htfEMALong = request.security(syminfo.tickerid, htfEMATimeframe, ta.ema(close, emaLongPeriod))

// Trading conditions
longCondition = ta.crossover(emaShort, emaLong) and rsiValue < rsiOverbought and (not htfEMAEnabled or close > htfEMALong) and macdLine > macdSignalLine
shortCondition = ta.crossunder(emaShort, emaLong) and rsiValue > rsiOversold and (not htfEMAEnabled or close < htfEMALong) and macdLine < macdSignalLine

// Plotting EMAs
plot(emaShort, title="EMA Short", color=color.green)
plot(emaLong, title="EMA Long", color=color.red)

// Plotting MACD
hline(0, "Zero Line", color=color.gray)
plot(macdLine - macdSignalLine, title="MACD Histogram", color=color.green, style=plot.style_histogram)
plot(macdLine, title="MACD Line", color=color.blue)
plot(macdSignalLine, title="MACD Signal Line", color=color.red)

// Trailing Stop-Loss and Take-Profit levels
var float trailStopLoss = na
var float trailTakeProfit = na

if (strategy.position_size > 0) // Long Position
    trailStopLoss := na(trailStopLoss) ? close - atrValue * atrMultiplier : math.max(trailStopLoss, close - atrValue * atrMultiplier)
    trailTakeProfit := close + atrValue * takeProfitATRMultiplier
    strategy.exit("Exit Long", "Long", stop=trailStopLoss, limit=trailTakeProfit, when=shortCondition)

if (strategy.position_size < 0) // Short Position
    trailStopLoss := na(trailStopLoss) ? close + atrValue * atrMultiplier : math.min(trailStopLoss, close + atrValue * atrMultiplier)
    trailTakeProfit := close - atrValue * takeProfitATRMultiplier
    strategy.exit("Exit Short", "Short", stop=trailStopLoss, limit=trailTakeProfit, when=longCondition)

// Strategy Entry
if (longCondition and (tradeDirection == "Both" or tradeDirection == "Long"))
    strategy.entry("Long", strategy.long)

if (shortCondition and (tradeDirection == "Both" or tradeDirection == "Short"))
    strategy.entry("Short", strategy.short)

// Plotting Buy/Sell signals
plotshape(series=longCondition, title="Buy Signal", location=location.belowbar, color=color.green, style=shape.labelup, text="BUY")
plotshape(series=shortCondition, title="Sell Signal", location=location.abovebar, color=color.red, style=shape.labeldown, text="SELL")

// Plotting Trailing Stop-Loss and Take-Profit levels
plot(strategy.position_size > 0 ? trailStopLoss : na, title="Long Trailing Stop Loss", color=color.red, linewidth=2, style=plot.style_line)
plot(strategy.position_size < 0 ? trailStopLoss : na, title="Short Trailing Stop Loss", color=color.green, linewidth=2, style=plot.style_line)
plot(strategy.position_size > 0 ? trailTakeProfit : na, title="Long Take Profit", color=color.blue, linewidth=2, style=plot.style_line)
plot(strategy.position_size < 0 ? trailTakeProfit : na, title="Short Take Profit", color=color.orange, linewidth=2, style=plot.style_line)
Detail
https://www.fmz.com/strategy/472951
Last Modified
2024-11-25 14:42:33