
9.1 KiB
Name
多重时间周期CPR突破动量交易策略-Multi-Timeframe-CPR-Breakout-Momentum-Trading-Strategy
Author
ianzeng123
Strategy Description
[trans]
概述
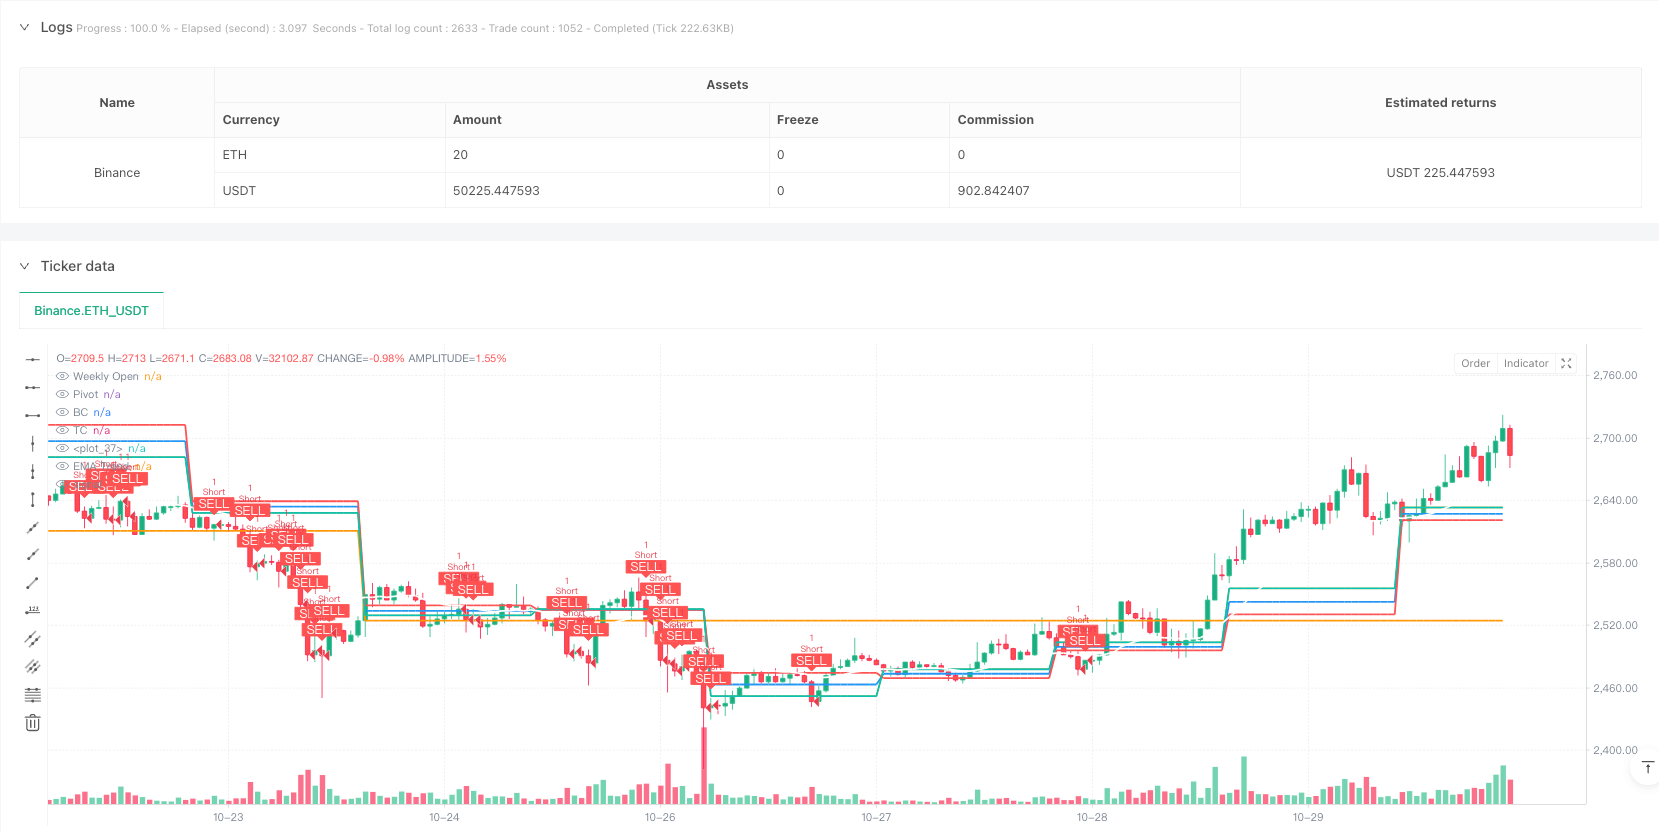
本策略是一个基于多重时间周期分析的交易系统,主要利用中心价格区间(CPR)、指数移动平均线(EMA)和相对强弱指标(RSI)进行交易。该策略通过日线CPR水平、周开盘价和20周期EMA来识别市场趋势和关键支撑阻力位,并结合成交量确认来执行交易。
策略原理
策略的核心是通过分析价格与CPR水平的关系来寻找交易机会。CPR由枢轴点(Pivot)、底部中心线(BC)和顶部中心线(TC)组成。当价格突破TC且市场处于多头阶段时,系统会发出做多信号;当价格跌破BC且市场处于空头阶段时,系统会发出做空信号。系统还使用20周期EMA作为趋势过滤器,并要求成交量高于20周期均线来确认突破的有效性。此外,策略还可选择性地使用RSI背离作为额外的确认指标。
策略优势
- 多重确认机制:结合了价格行为、趋势方向和成交量三重确认,提高了交易信号的可靠性
- 动态风险管理:基于CPR宽度设置动态止损,适应不同市场环境
- 灵活的定制选项:可调整CPR时间周期、EMA长度和开启/关闭RSI背离确认
- 不对称收益比:采用1.5:1的收益风险比,提高了长期盈利能力
- 多时间周期分析:通过整合日线和周线数据,提供更全面的市场视角
策略风险
- 假突破风险:在震荡市场中可能出现假突破信号,建议使用更严格的成交量过滤条件
- 趋势反转风险:在趋势转折点可能出现较大回撤,可以通过缩小止损范围来控制风险
- 参数敏感性:策略表现对EMA长度和成交量阈值等参数较为敏感,需要定期优化
- 市场环境依赖:在低波动率环境下可能难以达到预期的收益风险比
- 执行滑点:在快速行情中可能面临较大滑点,影响实际交易效果
策略优化方向
- 引入波动率自适应机制:根据市场波动率动态调整止损和获利目标
- 增加市场状态分类:细分趋势和盘整市场,采用不同的交易参数
- 优化成交量过滤器:考虑相对成交量变化而不是简单的均线比较
- 完善出场机制:增加移动止损和部分获利了结功能
- 加入时间过滤:避免在特定时间段交易,如市场开盘和收盘前后的高波动期
总结
这是一个结构完整、逻辑清晰的趋势跟踪策略,通过多重技术指标的配合使用,有效地控制了交易风险。策略的主要优势在于其灵活的参数设置和完善的风险管理机制,但同时也需要交易者关注市场环境的变化并及时调整策略参数。通过建议的优化方向,策略的稳定性和盈利能力有望得到进一步提升。 ||
Overview
This strategy is a multi-timeframe trading system that utilizes Central Pivot Range (CPR), Exponential Moving Average (EMA), and Relative Strength Index (RSI) for trading decisions. It identifies market trends and key support/resistance levels using daily CPR levels, weekly open prices, and 20-period EMA, combined with volume confirmation for trade execution.
Strategy Principles
The core principle revolves around analyzing price relationships with CPR levels. CPR consists of Pivot Point, Bottom Central (BC), and Top Central (TC) lines. Long signals are generated when price breaks above TC in bullish market phases, while short signals occur when price breaks below BC in bearish phases. The system employs a 20-period EMA as a trend filter and requires volume above the 20-period average to confirm breakouts. Additionally, RSI divergence can be optionally used for extra confirmation.
Strategy Advantages
- Multiple confirmation mechanisms: Combines price action, trend direction, and volume triple confirmation to enhance signal reliability
- Dynamic risk management: Sets dynamic stop-losses based on CPR width, adapting to different market conditions
- Flexible customization options: Adjustable CPR timeframes, EMA length, and optional RSI divergence confirmation
- Asymmetric reward ratios: Employs 1.5:1 reward-to-risk ratio for improved long-term profitability
- Multi-timeframe analysis: Integrates daily and weekly data for a more comprehensive market perspective
Strategy Risks
- False breakout risk: May generate false signals in ranging markets, suggesting stricter volume filtering
- Trend reversal risk: Potential for larger drawdowns at trend turning points, manageable through tighter stops
- Parameter sensitivity: Strategy performance is sensitive to EMA length and volume threshold parameters
- Market environment dependency: May struggle to achieve target reward ratios in low volatility environments
- Execution slippage: Can face significant slippage in fast-moving markets, affecting actual trading results
Strategy Optimization Directions
- Implement volatility adaptation: Dynamically adjust stops and targets based on market volatility
- Enhanced market state classification: Differentiate between trending and ranging markets with separate parameters
- Refined volume filter: Consider relative volume changes instead of simple moving average comparison
- Improved exit mechanics: Add trailing stops and partial profit-taking functionality
- Time-based filtering: Avoid trading during specific periods like market open/close volatile sessions
Summary
This is a well-structured trend-following strategy with clear logic, effectively controlling trading risks through multiple technical indicators. Its main strengths lie in flexible parameter settings and comprehensive risk management mechanisms, though traders must remain attentive to changing market conditions and adjust parameters accordingly. Through the suggested optimization directions, the strategy's stability and profitability can be further enhanced.[/trans]
Source (PineScript)
//@version=5
strategy("Ahmad Ali Khan CPR Strategy", overlay=true, margin_long=100, margin_short=100)

// ———— Inputs ————
use_daily_cpr = input.bool(true, "Use Daily CPR Levels")
ema_length = input.int(20, "EMA Trend Filter Length")
show_week_open = input.bool(true, "Show Weekly Open Price")
enable_divergence = input.bool(true, "Enable RSI Divergence Check")

// ———— Daily CPR Calculation ————
daily_high = request.security(syminfo.tickerid, "D", high[1], lookahead=barmerge.lookahead_on)
daily_low = request.security(syminfo.tickerid, "D", low[1], lookahead=barmerge.lookahead_on)
daily_close = request.security(syminfo.tickerid, "D", close[1], lookahead=barmerge.lookahead_on)

pivot = (daily_high + daily_low + daily_close) / 3
bc = (daily_high + daily_low) / 2
tc = pivot + (pivot - bc)

// ———— Weekly Open Price ————
weekly_open = request.security(syminfo.tickerid, "W", open, lookahead=barmerge.lookahead_on)

// ———— Trend Analysis ————
ema_trend = ta.ema(close, ema_length)
market_phase = close > ema_trend ? "Bullish" : "Bearish"

// ———— Momentum Confirmation ————
rsi_length = 14
rsi = ta.rsi(close, rsi_length)
bullish_div = ta.valuewhen(ta.crossover(rsi, 30), low, 0) > ta.valuewhen(ta.crossover(rsi, 30), low, 1)
bearish_div = ta.valuewhen(ta.crossunder(rsi, 70), high, 0) < ta.valuewhen(ta.crossunder(rsi, 70), high, 1)

// ———— Plotting ————
// CPR Levels
plot(pivot, "Pivot", color=color.blue, linewidth=2)
plot(bc, "BC", color=color.red, linewidth=2)
plot(tc, "TC", color=color.green, linewidth=2)
fill(plot(bc), plot(tc), color=color.new(color.purple, 90))

// Weekly Open
plot(show_week_open ? weekly_open : na, "Weekly Open", color=color.orange, linewidth=2)

// EMA Trend
plot(ema_trend, "EMA Trend", color=color.white, linewidth=2)

// ———— Strategy Logic ————
long_condition =
  close > tc and
  market_phase == "Bullish" and
  (not enable_divergence or bullish_div) and
  volume > ta.sma(volume, 20)

short_condition =
  close < bc and
  market_phase == "Bearish" and
  (not enable_divergence or bearish_div) and
  volume > ta.sma(volume, 20)

// ———— Risk Management ————
cpr_width = tc - bc
stop_loss_long = bc - (0.5 * cpr_width)
take_profit_long = tc + (1.5 * cpr_width)
stop_loss_short = tc + (0.5 * cpr_width)
take_profit_short = bc - (1.5 * cpr_width)

// ———— Execute Orders ————
if long_condition
    strategy.entry("Long", strategy.long)
    strategy.exit("XL", "Long", stop=stop_loss_long, limit=take_profit_long)

if short_condition
    strategy.entry("Short", strategy.short)
    strategy.exit("XS", "Short", stop=stop_loss_short, limit=take_profit_short)

// ———— Signal Plotting ————
plotshape(long_condition, "Buy", shape.labelup, location.belowbar, color=color.green, text="BUY", textcolor=color.white)
plotshape(short_condition, "Sell", shape.labeldown, location.abovebar, color=color.red, text="SELL", textcolor=color.white)
Detail
https://www.fmz.com/strategy/483075
Last Modified
2025-02-21 11:45:06