
17 KiB
Name
多重摆动指标交易系统基于TSL自动化多方向仓位管理策略-Multi-Directional-Oscillator-Trading-System-TSL-Based-Automated-Position-Management-Strategy
Author
ianzeng123
Strategy Description
[trans]
概述
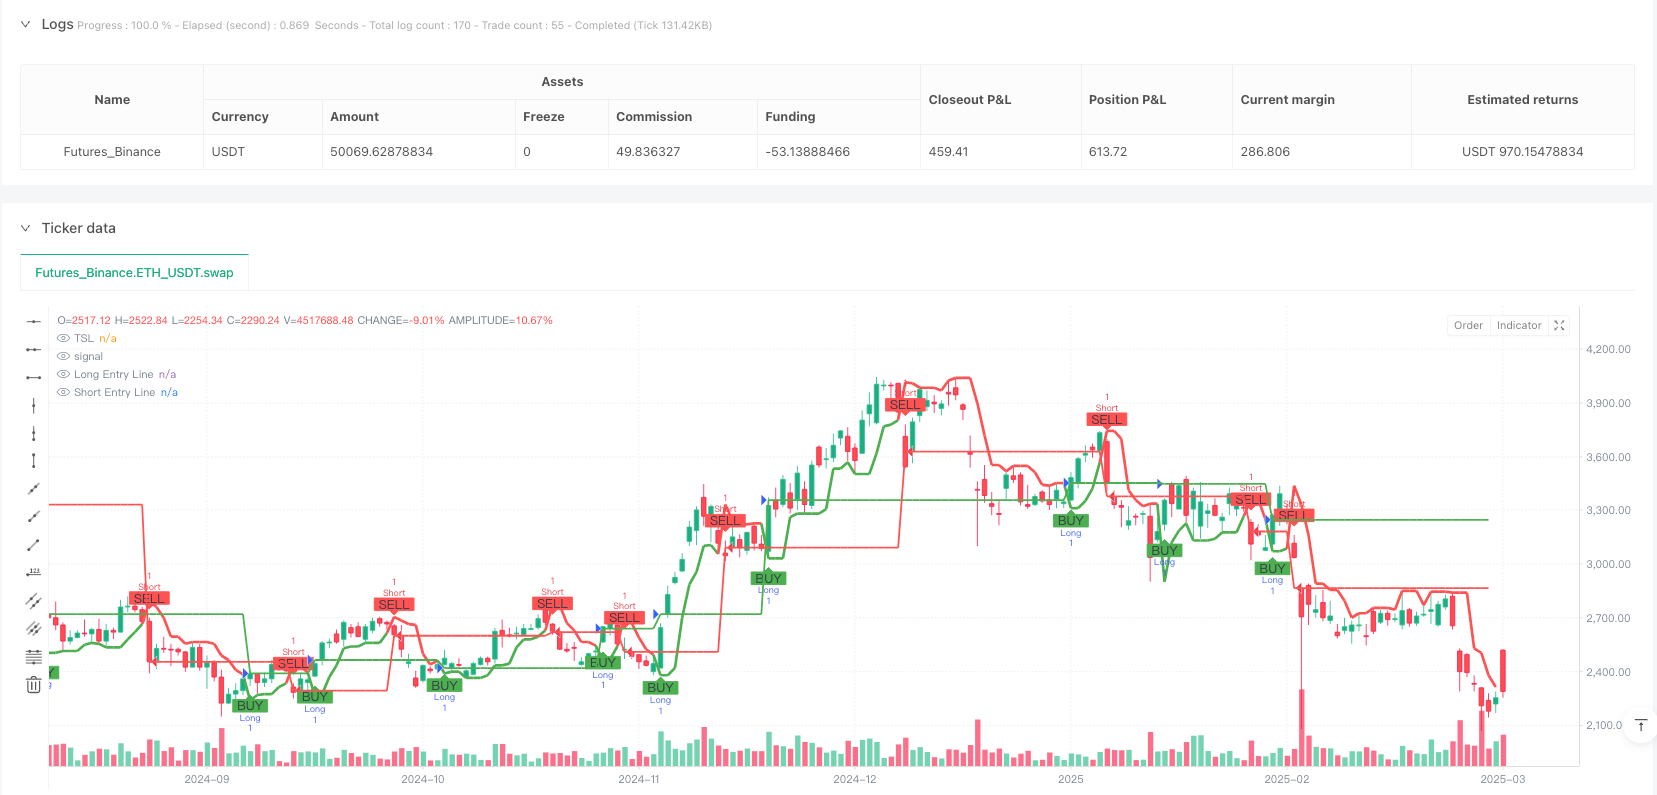
多重摆动指标交易系统是一种基于技术分析的量化交易策略,核心依赖于摆动高点与低点的识别来确定市场趋势变化。该策略通过跟踪过去N个周期内的最高价和最低价,构建了一个动态的跟踪止损水平(TSL),作为多空交易的决策边界。系统会在价格突破TSL水平时自动执行买入信号,在价格跌破TSL水平时自动执行卖出信号,同时自动管理仓位,确保每次只持有一个方向的仓位。该策略特别适合波动性较大的市场环境,能够自动捕捉短期到中期的趋势变化。
策略原理
该策略的核心逻辑围绕跟踪止损水平(TSL)展开,具体实现如下:
-
计算周期内的关键价格水平:
- 通过
ta.highest(high, no)计算过去no个周期的最高价(res) - 通过
ta.lowest(low, no)计算过去no个周期的最低价(sup)
- 通过
-
确定价格相对于前期高低点的位置:
- 当收盘价高于前一周期的最高价时,avd赋值为1(上升趋势)
- 当收盘价低于前一周期的最低价时,avd赋值为-1(下降趋势)
- 其他情况下,avd赋值为0(无明确趋势)
-
构建跟踪止损水平(TSL):
- 当趋势向上时,TSL设为支撑位(sup),作为止损点
- 当趋势向下时,TSL设为阻力位(res),作为反转信号点
-
生成交易信号:
- 买入信号(Buy):当收盘价上穿TSL时
- 卖出信号(Sell):当收盘价下穿TSL时
-
执行交易操作:
- 买入信号触发时,平仓空头仓位并开立多头仓位
- 卖出信号触发时,平仓多头仓位并开立空头仓位
系统还包含可视化组件,如标记买卖点、颜色变化的K线和背景,以及实时显示开仓价格的水平线,提升了交易过程的可视化体验。
策略优势
-
趋势捕捉能力强:通过最高价和最低价的动态计算,能够有效捕捉市场趋势变化,适应不同市场周期的波动。
-
自动化程度高:系统自动执行买卖信号的识别和交易执行,减少人为干预和情绪影响。
-
双向交易机制:同时支持多头和空头交易,能够在上涨和下跌市场中均获取收益机会。
-
内置风险管理:跟踪止损水平(TSL)的设计本质上包含了止损功能,限制单笔交易的最大亏损。
-
可视化交易反馈:通过图形界面明确显示交易信号和开仓价格,便于交易者实时监控和评估策略表现。
-
参数灵活性:通过调整摆动周期参数(no),可以适应不同时间周期的市场特性,从短线到中长线均可应用。
-
清晰的信号提示:系统提供文字和视觉双重信号提示,减少错误操作的可能性。
策略风险
-
震荡市场表现欠佳:在横盘震荡市场中,该策略可能产生频繁的假信号,导致连续止损。
-
滑点和执行延迟风险:在实盘交易中,信号生成与订单执行之间可能存在时间差,导致实际成交价格偏离理想价格。
-
固定仓位管理限制:当前策略使用固定单位(qty=1)进行交易,缺乏根据市场波动性或账户规模调整仓位大小的机制。
-
参数敏感性:策略性能高度依赖于摆动周期参数(no)的设置,不同市场环境可能需要不同的参数值。
-
突发行情应对能力弱:在重大新闻或黑天鹅事件导致的快速价格变动中,止损水平可能来不及调整,导致较大亏损。
减轻这些风险的方法包括:结合其他指标进行信号确认、实施动态仓位管理、设置最大止损限额、根据波动率调整参数,以及定期回测和优化策略参数。
策略优化方向
-
动态仓位管理:基于市场波动率或账户余额比例动态调整仓位大小,而非固定单位交易。可通过添加如下代码实现:
volatility = ta.atr(14) / close * 100 // 计算波动率百分比 position_size = strategy.equity * 0.01 / volatility // 根据波动率调整仓位 -
信号过滤优化:引入额外的技术指标如RSI、MACD或ATR作为信号过滤器,减少假信号。例如:
rsi = ta.rsi(close, 14) valid_buy = Buy and rsi < 70 // 避免在超买区域买入 valid_sell = Sell and rsi > 30 // 避免在超卖区域卖出 -
自适应参数:基于市场波动性动态调整摆动周期参数(no),在低波动环境中使用较小值,在高波动环境中使用较大值。
-
添加利润目标:设置基于ATR或支撑/阻力水平的利润目标,在市场向有利方向移动足够距离时锁定部分利润。
-
时间过滤器:添加交易时间窗口限制,避开流动性较低或波动异常的市场时段。
-
回撤控制机制:实施基于账户权益回撤百分比的暂停交易机制,当连续亏损达到预设阈值时暂停交易。
-
多周期确认:结合更高时间周期的趋势方向,只在与更高周期趋势一致的方向上开仓,提高胜率。
这些优化方向能够显著提升策略的稳健性和适应性,尤其是在不同市场环境转换时提供更好的风险调整回报。
总结
多重摆动指标交易系统是一种基于技术分析的自动化交易策略,通过动态跟踪止损水平(TSL)捕捉市场趋势变化并执行多空双向交易。该策略在趋势明确的市场中表现出色,能够有效跟踪价格走势并自动管理仓位。
策略的核心优势在于其简单而有效的信号生成机制和内置的风险管理功能,尤其适合中短期趋势交易。然而,该策略在震荡市场中可能面临频繁假信号的挑战,需要进一步优化以提高其在各种市场环境中的适应性。
通过实施动态仓位管理、多指标信号确认、自适应参数调整等优化措施,该策略可以进一步提升其风险调整回报和稳定性。对于量化交易者而言,这种基于明确规则的自动化系统提供了一个可靠的框架,能够减少情绪干扰并保持交易纪律。
最终,该策略的成功应用取决于交易者对参数设置的精细调整和对市场特性的理解,建议在实盘应用前进行充分的历史回测和模拟交易验证。 ||
Overview
The Multi-Directional Oscillator Trading System is a quantitative trading strategy based on technical analysis, primarily relying on the identification of swing highs and lows to determine market trend changes. The strategy tracks the highest high and lowest low over N periods to construct a dynamic Trailing Stop Level (TSL), which serves as a decision boundary for both long and short trades. The system automatically executes buy signals when the price breaks above the TSL and sell signals when the price falls below the TSL, while managing positions to ensure only one directional position is held at any time. This strategy is particularly suitable for volatile market environments, capable of automatically capturing short to medium-term trend changes.
Strategy Principles
The core logic of this strategy revolves around the Trailing Stop Level (TSL), implemented as follows:
-
Calculate key price levels within the period:
- Use
ta.highest(high, no)to calculate the highest price (res) over the past no periods - Use
ta.lowest(low, no)to calculate the lowest price (sup) over the past no periods
- Use
-
Determine price position relative to previous highs and lows:
- When the closing price is higher than the previous period's highest price, avd is set to 1 (uptrend)
- When the closing price is lower than the previous period's lowest price, avd is set to -1 (downtrend)
- In other cases, avd is set to 0 (no clear trend)
-
Construct the Trailing Stop Level (TSL):
- During an uptrend, TSL is set to the support level (sup) as a stop-loss point
- During a downtrend, TSL is set to the resistance level (res) as a reversal signal point
-
Generate trading signals:
- Buy signal (Buy): When the closing price crosses above the TSL
- Sell signal (Sell): When the closing price crosses below the TSL
-
Execute trading operations:
- When a buy signal is triggered, close short positions and open long positions
- When a sell signal is triggered, close long positions and open short positions
The system also includes visualization components, such as markers for buy and sell points, color-changing candlesticks and background, and horizontal lines displaying entry prices in real-time, enhancing the visual experience of the trading process.
Strategy Advantages
-
Strong trend capture capability: Through dynamic calculation of the highest and lowest prices, it effectively captures market trend changes and adapts to market fluctuations across different cycles.
-
High degree of automation: The system automatically identifies buy and sell signals and executes trades, reducing human intervention and emotional influence.
-
Bi-directional trading mechanism: Supports both long and short trading, enabling profit opportunities in both rising and falling markets.
-
Built-in risk management: The design of the Trailing Stop Level (TSL) inherently includes a stop-loss function, limiting the maximum loss per trade.
-
Visual trading feedback: The graphical interface clearly displays trading signals and entry prices, allowing traders to monitor and evaluate strategy performance in real-time.
-
Parameter flexibility: By adjusting the swing period parameter (no), the strategy can adapt to market characteristics across different time periods, applicable from short-term to medium-long term trading.
-
Clear signal prompts: The system provides both textual and visual signal prompts, reducing the possibility of operational errors.
Strategy Risks
-
Poor performance in ranging markets: In sideways, choppy markets, the strategy may generate frequent false signals, leading to consecutive stop-losses.
-
Slippage and execution delay risks: In live trading, there may be a time gap between signal generation and order execution, causing actual transaction prices to deviate from ideal prices.
-
Fixed position management limitations: The current strategy uses a fixed unit (qty=1) for trading, lacking a mechanism to adjust position size based on market volatility or account size.
-
Parameter sensitivity: Strategy performance highly depends on the swing period parameter (no) setting, with different market environments potentially requiring different parameter values.
-
Weak response to sudden market conditions: During rapid price movements caused by major news or black swan events, the stop level may not adjust quickly enough, resulting in larger losses.
Methods to mitigate these risks include: combining other indicators for signal confirmation, implementing dynamic position management, setting maximum stop-loss limits, adjusting parameters based on volatility, and regularly backtesting and optimizing strategy parameters.
Strategy Optimization Directions
-
Dynamic position management: Dynamically adjust position size based on market volatility or account balance ratio, rather than fixed unit trading. This can be implemented by adding code such as:
volatility = ta.atr(14) / close * 100 // Calculate volatility percentage position_size = strategy.equity * 0.01 / volatility // Adjust position based on volatility -
Signal filtering optimization: Introduce additional technical indicators such as RSI, MACD, or ATR as signal filters to reduce false signals. For example:
rsi = ta.rsi(close, 14) valid_buy = Buy and rsi < 70 // Avoid buying in overbought areas valid_sell = Sell and rsi > 30 // Avoid selling in oversold areas -
Adaptive parameters: Dynamically adjust the swing period parameter (no) based on market volatility, using smaller values in low volatility environments and larger values in high volatility environments.
-
Add profit targets: Set profit targets based on ATR or support/resistance levels to lock in partial profits when the market moves a sufficient distance in the favorable direction.
-
Time filters: Add trading time window restrictions to avoid market sessions with lower liquidity or abnormal volatility.
-
Drawdown control mechanism: Implement a trading pause mechanism based on account equity drawdown percentage, temporarily stopping trading when consecutive losses reach a preset threshold.
-
Multi-timeframe confirmation: Combine with the trend direction of higher timeframes, only opening positions in the direction consistent with the higher timeframe trend to improve win rate.
These optimization directions can significantly enhance the strategy's robustness and adaptability, especially in providing better risk-adjusted returns during transitions between different market environments.
Summary
The Multi-Directional Oscillator Trading System is an automated trading strategy based on technical analysis, capturing market trend changes and executing bi-directional trades through a dynamic Trailing Stop Level (TSL). The strategy performs excellently in markets with clear trends, effectively tracking price movements and automatically managing positions.
The core advantages of the strategy lie in its simple yet effective signal generation mechanism and built-in risk management functions, particularly suitable for medium to short-term trend trading. However, the strategy may face challenges with frequent false signals in ranging markets, requiring further optimization to improve its adaptability across various market environments.
By implementing dynamic position management, multi-indicator signal confirmation, adaptive parameter adjustment, and other optimization measures, the strategy can further enhance its risk-adjusted returns and stability. For quantitative traders, this rule-based automated system provides a reliable framework that can reduce emotional interference and maintain trading discipline.
Ultimately, the successful application of this strategy depends on the trader's fine-tuning of parameter settings and understanding of market characteristics. It is recommended to conduct thorough historical backtesting and simulated trading verification before applying it to live trading.[/trans]
Source (PineScript)
/*backtest
start: 2024-05-06 00:00:00
end: 2025-03-04 08:00:00
period: 1d
basePeriod: 1d
exchanges: [{"eid":"Futures_Binance","currency":"ETH_USDT"}]
*/

//@version=5
strategy("Accurate Swing Trading System with Auto Entry (Long & Short)", overlay=true)

// Parameters
no = input.int(3, title="Swing")
Barcolor = input.bool(true, title="Barcolor")
Bgcolor = input.bool(false, title="Bgcolor")

// Calculate TSL (Trailing Stop Level)
res = ta.highest(high, no)
sup = ta.lowest(low, no)
avd = close > res[1] ? 1 : close < sup[1] ? -1 : 0
avn = ta.valuewhen(avd != 0, avd, 0)
tsl = avn == 1 ? sup : res

// Define Buy and Sell Conditions
Buy = ta.crossover(close, tsl)
Sell = ta.crossunder(close, tsl)

plotshape(Buy, "BUY", shape.labelup, location.belowbar, color.green, text="BUY", textcolor=color.black)
plotshape(Sell, "SELL", shape.labeldown, location.abovebar, color.red, text="SELL", textcolor=color.black)

// Plot TSL
colr = close >= tsl ? color.green : close <= tsl ? color.red : na
plot(tsl, color=colr, linewidth=3, title="TSL")
barcolor(Barcolor ? colr : na)
bgcolor(Bgcolor ? colr : na)

// Alerts
alertcondition(Buy, title="Buy Signal", message="Buy")
alertcondition(Sell, title="Sell Signal", message="Sell")

// Automatic Entry & Exit with 1 Unit
if (Buy)
    strategy.entry("Long", strategy.long, qty=1)  // Enter long with 1 unit
    strategy.close("Short")  // Close any open short positions
    alert("Buy Signal - Entry Long", alert.freq_once_per_bar_close)
    alert("Buy Entry Sound", alert.freq_once_per_bar_close)

if (Sell)
    strategy.entry("Short", strategy.short, qty=1)  // Enter short with 1 unit
    strategy.close("Long")  // Close any open long positions
    alert("Sell Signal - Entry Short", alert.freq_once_per_bar_close)
    alert("Sell Entry Sound", alert.freq_once_per_bar_close)

// Plotting lines for open trades
var float long_price = na
var float short_price = na

// For Long Position: Plot the entry line at the price of the open position
if (strategy.opentrades > 0)
    if (strategy.opentrades.entry_id(0) == "Long" and not na(strategy.opentrades.entry_price(0)))
        long_price := strategy.opentrades.entry_price(0)
    if (strategy.opentrades.entry_id(0) == "Short" and not na(strategy.opentrades.entry_price(0)))
        short_price := strategy.opentrades.entry_price(0)

plot(long_price, color=color.green, style=plot.style_line, linewidth=2, title="Long Entry Line", offset=-1)
plot(short_price, color=color.red, style=plot.style_line, linewidth=2, title="Short Entry Line", offset=-1)
Detail
https://www.fmz.com/strategy/485123
Last Modified
2025-03-06 10:57:03