
11 KiB
Name
多重指标趋势追踪策略-Multi-Indicator-Trend-Following-Strategy
Author
ChaoZhang
Strategy Description
 [trans]
概述
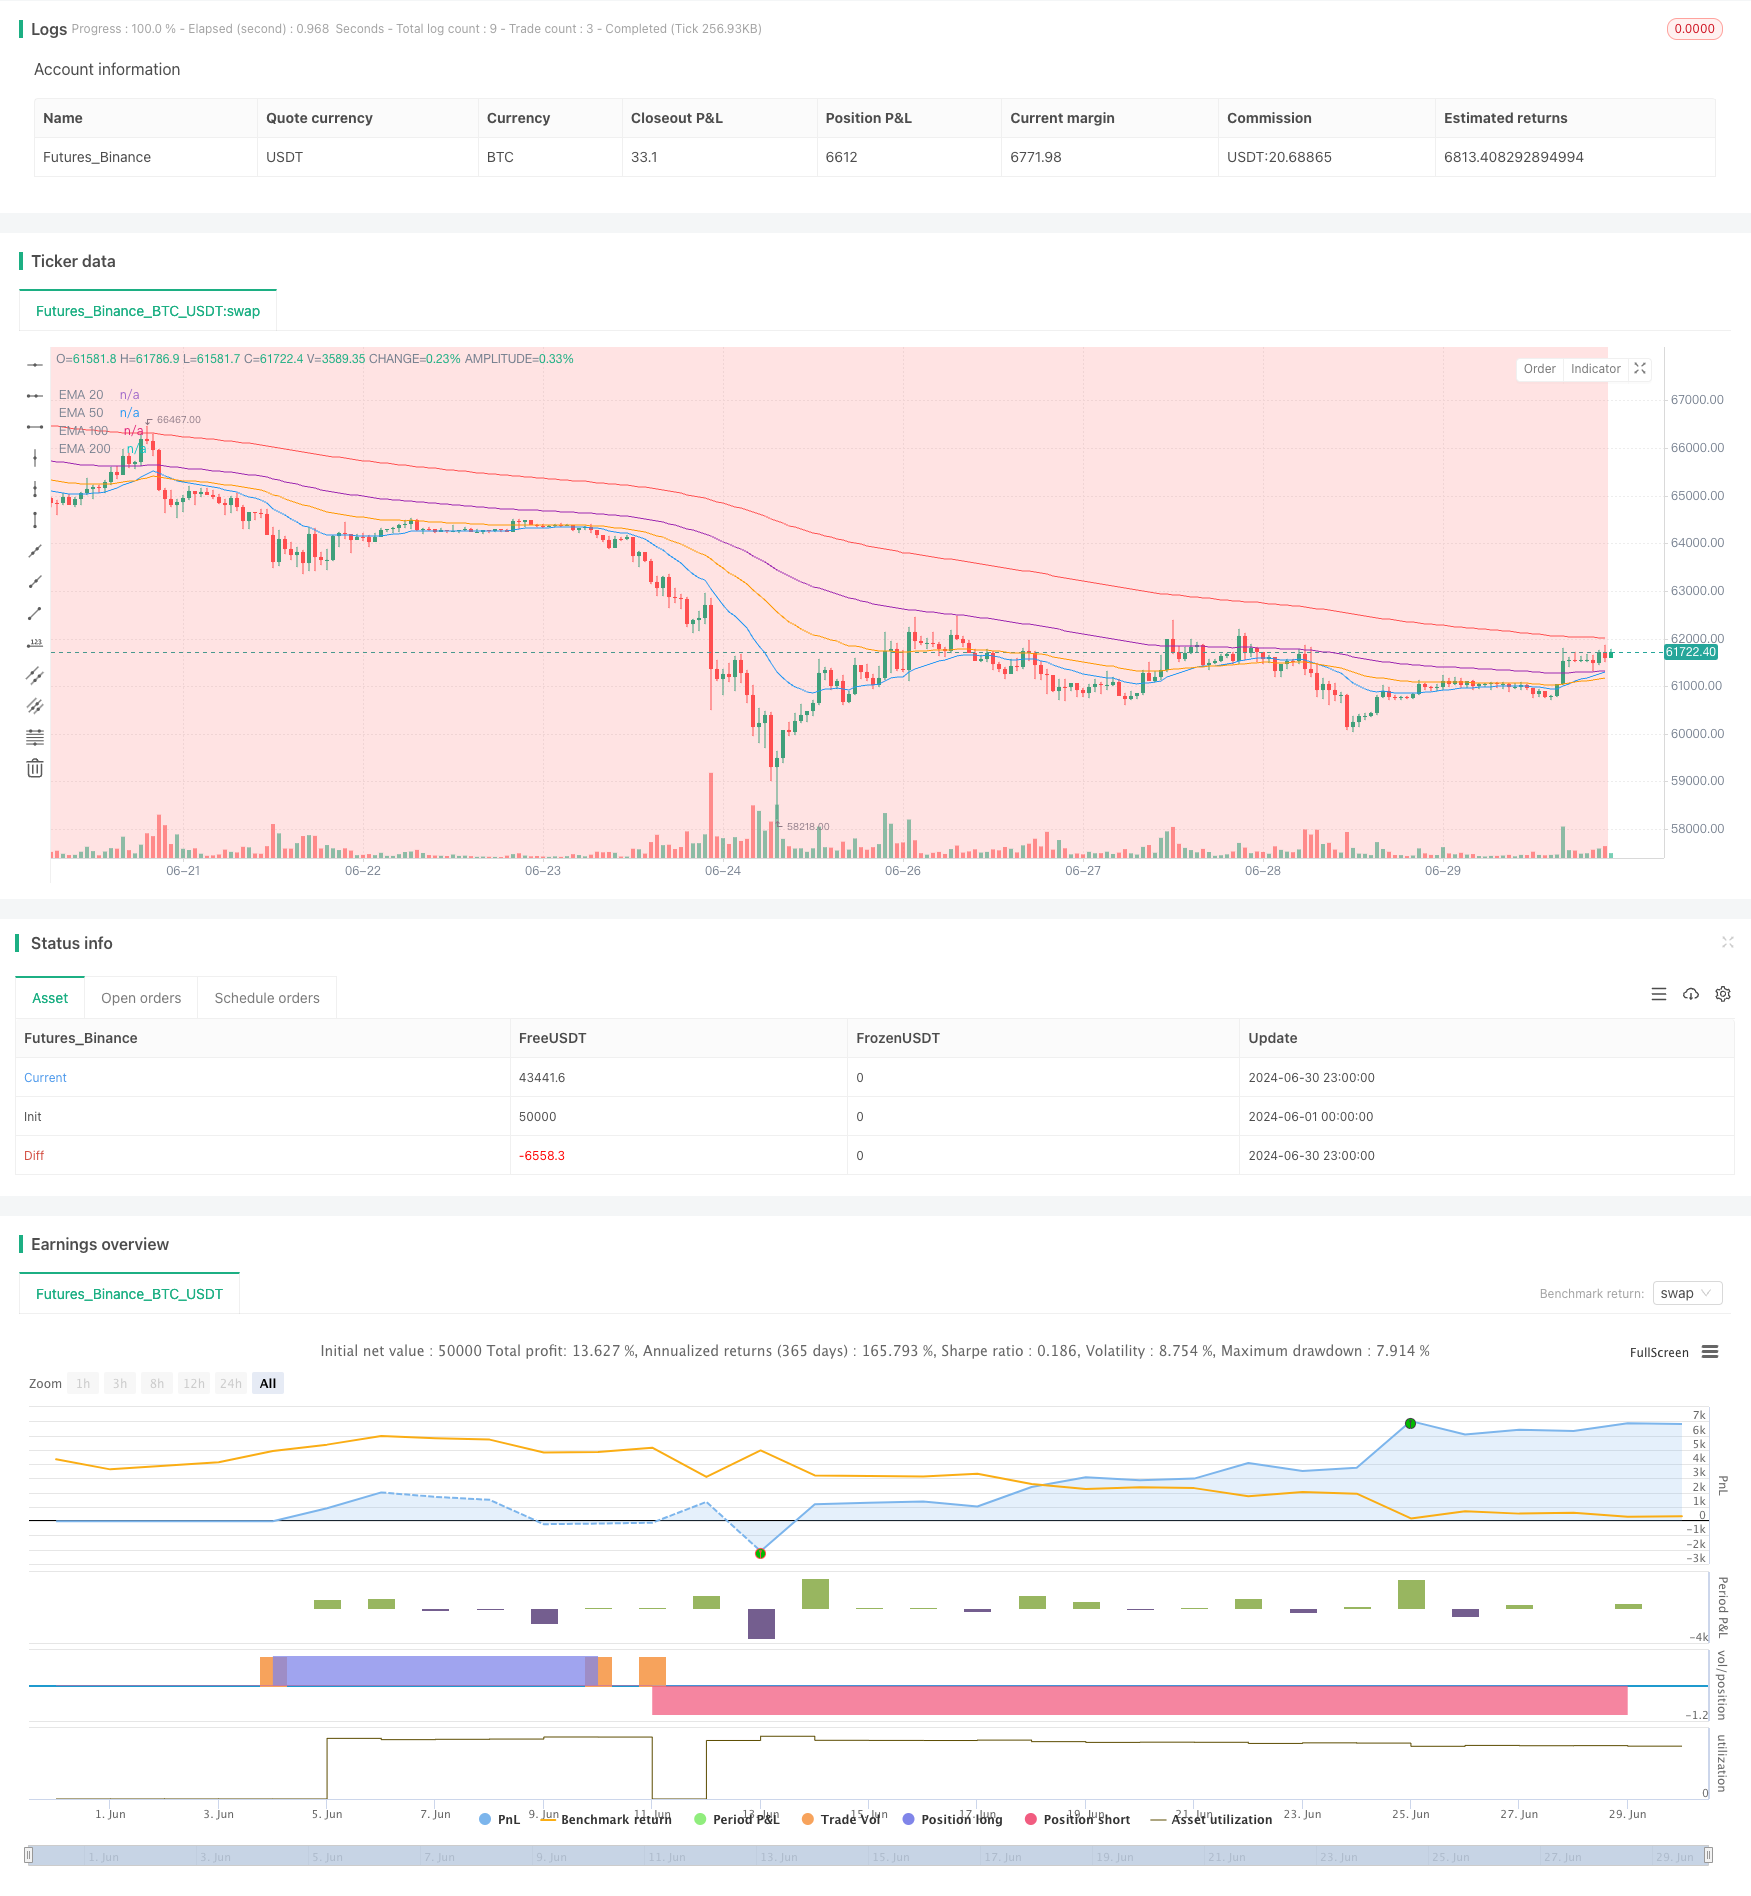
这个名为"多重指标趋势追踪策略"的交易系统是一种复杂而全面的趋势跟踪方法。它结合了相对强弱指标(RSI)和多个周期的指数移动平均线(EMA)来识别市场趋势并生成交易信号。该策略的核心在于同时利用短期动量指标和长期趋势指标,以在不同时间框架下捕捉市场走势。
策略原理
该策略的运作基于以下几个关键原则:
-
RSI信号:使用3周期RSI作为短期动量指标。当RSI超过80时视为超买,低于20时视为超卖。
-
EMA趋势确认:使用20、50、100和200周期的EMA来确认长期趋势。当这些EMA按照20 > 50 > 100 > 200的顺序排列时,被认为是上升趋势;反之则为下降趋势。
-
入场信号:
- 做多信号:当RSI > 80且EMA呈上升趋势排列时触发。
- 做空信号:当RSI < 20且EMA呈下降趋势排列时触发。
-
出场信号:
- 平多信号:当50周期EMA跌破200周期EMA或RSI跌破30时触发。
- 平空信号:当50周期EMA突破200周期EMA或RSI突破70时触发。
-
持续性确认:策略要求信号在至少3个周期内保持一致,以避免虚假信号。
-
可视化:使用背景颜色标记多头和空头区间,并在图表上绘制所有EMA线。
策略优势
-
多维度分析:结合短期动量(RSI)和长期趋势(EMA)指标,提供了更全面的市场视角。
-
趋势确认:使用多重EMA交叉确认趋势,减少假突破的风险。
-
灵活的参数设置:允许用户根据个人偏好和市场条件调整RSI长度和阈值。
-
可视化辅助:通过背景颜色和EMA线条直观展示市场状态,便于快速判断。
-
动态止损:使用EMA交叉和RSI反转作为止损点,适应市场变化。
-
信号持续性要求:通过要求信号持续多个周期来过滤噪音,提高可靠性。
-
双向交易:能够在上涨和下跌市场中都捕捉机会。
策略风险
-
滞后性:EMA和RSI都是滞后指标,可能在快速反转的市场中反应不及时。
-
震荡市表现欠佳:在横盘或者震荡市场中,可能频繁出现假信号。
-
过度依赖技术指标:忽视了基本面和其他市场因素的影响。
-
参数敏感性:不同的RSI和EMA参数设置可能导致截然不同的结果。
-
潜在的频繁交易:在某些市场条件下,可能导致过度交易和增加交易成本。
-
固定阈值的局限性:市场波动性变化时,固定的RSI阈值可能不再适用。
-
缺乏风险管理:策略中没有明确的止损和利润目标设置。
策略优化方向
-
自适应参数:引入自适应机制,根据市场波动性动态调整RSI和EMA参数。
-
增加筛选器:加入成交量、波动率等额外指标,提高信号质量。
-
改进出场机制:设计更精细的利润目标和止损策略,如使用ATR(Average True Range)。
-
时间框架分析:在多个时间框架上验证信号,以提高准确性。
-
加入基本面因素:结合经济日历或新闻事件来过滤潜在的高风险交易。
-
优化执行逻辑:考虑使用限价单而非市价单,以获得更好的成交价格。
-
回测与优化:进行广泛的历史数据回测,找出最优参数组合。
-
引入机器学习:使用机器学习算法优化参数选择和信号生成过程。
总结
"多重指标趋势追踪策略"是一个综合利用RSI和多重EMA的复杂交易系统。它通过结合短期动量和长期趋势指标,试图在不同市场环境下捕捉持续性趋势。该策略的优势在于其多维度分析方法和灵活的参数设置,但也面临着滞后性和过度依赖技术指标的风险。为了进一步提升策略性能,可以考虑引入自适应参数、改进风险管理机制,并整合更多的市场因素。总的来说,这是一个有潜力的策略框架,通过持续优化和细致回测,有望在实际交易中取得良好表现。
||
Overview
The "Multi-Indicator Trend Following Strategy" is a sophisticated and comprehensive trend-following approach to trading. It combines the Relative Strength Index (RSI) with multiple periods of Exponential Moving Averages (EMAs) to identify market trends and generate trading signals. The core of this strategy lies in its simultaneous use of short-term momentum indicators and long-term trend indicators to capture market movements across different timeframes.
Strategy Principles
The strategy operates based on the following key principles:
-
RSI Signals: Utilizes a 3-period RSI as a short-term momentum indicator. RSI above 80 is considered overbought, while below 20 is oversold.
-
EMA Trend Confirmation: Uses 20, 50, 100, and 200-period EMAs to confirm long-term trends. An uptrend is identified when these EMAs are aligned in the order 20 > 50 > 100 > 200; the reverse order indicates a downtrend.
-
Entry Signals:
- Long Signal: Triggered when RSI > 80 and EMAs are in uptrend alignment.
- Short Signal: Triggered when RSI < 20 and EMAs are in downtrend alignment.
-
Exit Signals:
- Long Exit: Triggered when the 50-period EMA crosses below the 200-period EMA or RSI falls below 30.
- Short Exit: Triggered when the 50-period EMA crosses above the 200-period EMA or RSI rises above 70.
-
Persistence Confirmation: The strategy requires signals to remain consistent for at least 3 periods to avoid false signals.
-
Visualization: Uses background colors to mark bullish and bearish periods and plots all EMA lines on the chart.
Strategy Advantages
-
Multi-dimensional Analysis: Combines short-term momentum (RSI) and long-term trend (EMA) indicators for a more comprehensive market perspective.
-
Trend Confirmation: Utilizes multiple EMA crossovers to confirm trends, reducing the risk of false breakouts.
-
Flexible Parameter Settings: Allows users to adjust RSI length and thresholds based on personal preferences and market conditions.
-
Visual Aids: Provides intuitive market state visualization through background colors and EMA lines for quick assessment.
-
Dynamic Stop-Loss: Uses EMA crossovers and RSI reversals as stop-loss points, adapting to market changes.
-
Signal Persistence Requirement: Filters out noise by requiring signals to persist for multiple periods, enhancing reliability.
-
Bi-directional Trading: Capable of capturing opportunities in both bullish and bearish markets.
Strategy Risks
-
Lag: Both EMAs and RSI are lagging indicators, potentially slow to react in rapidly reversing markets.
-
Poor Performance in Ranging Markets: May generate frequent false signals in sideways or choppy markets.
-
Over-reliance on Technical Indicators: Ignores fundamental factors and other market influences.
-
Parameter Sensitivity: Different RSI and EMA parameter settings can lead to vastly different results.
-
Potential for Overtrading: May lead to excessive trading and increased transaction costs under certain market conditions.
-
Fixed Threshold Limitations: Fixed RSI thresholds may become ineffective as market volatility changes.
-
Lack of Risk Management: The strategy lacks explicit stop-loss and profit target settings.
Strategy Optimization Directions
-
Adaptive Parameters: Introduce adaptive mechanisms to dynamically adjust RSI and EMA parameters based on market volatility.
-
Additional Filters: Incorporate volume, volatility, or other supplementary indicators to improve signal quality.
-
Improved Exit Mechanisms: Design more sophisticated profit targets and stop-loss strategies, such as using the Average True Range (ATR).
-
Multiple Timeframe Analysis: Validate signals across multiple timeframes to increase accuracy.
-
Fundamental Factor Integration: Incorporate economic calendar events or news to filter out potentially high-risk trades.
-
Execution Logic Optimization: Consider using limit orders instead of market orders for better entry prices.
-
Backtesting and Optimization: Conduct extensive historical data backtesting to find optimal parameter combinations.
-
Machine Learning Integration: Utilize machine learning algorithms to optimize parameter selection and signal generation processes.
Conclusion
The "Multi-Indicator Trend Following Strategy" is a complex trading system that leverages RSI and multiple EMAs. It aims to capture persistent trends across various market environments by combining short-term momentum and long-term trend indicators. The strategy's strengths lie in its multi-dimensional analysis approach and flexible parameter settings, but it also faces risks of lag and over-reliance on technical indicators. To further enhance strategy performance, considerations should be given to introducing adaptive parameters, improving risk management mechanisms, and integrating more market factors. Overall, this is a promising strategy framework that, with continuous optimization and thorough backtesting, has the potential to perform well in real trading scenarios.
[/trans]
Source (PineScript)
/*backtest
start: 2024-06-01 00:00:00
end: 2024-06-30 23:59:59
period: 1h
basePeriod: 15m
exchanges: [{"eid":"Futures_Binance","currency":"BTC_USDT"}]
*/

// Bu Pine Script™ kodu, Mozilla Public License 2.0 koşullarına tabidir: https://mozilla.org/MPL/2.0/
// © akadal

//@version=5
strategy("Trendy Strategy", overlay=true)

// Ayarlanabilir parametreler
rsiLength = input.int(3, title="RSI Length")
longThreshold = input.int(80, title="Long RSI Threshold")
shortThreshold = input.int(20, title="Short RSI Threshold")

ema20 = ta.ema(close, 20)
ema50 = ta.ema(close, 50)
ema100 = ta.ema(close, 100)
ema200 = ta.ema(close, 200)
rsi = ta.rsi(close, rsiLength)

// Long sinyal koşulu
longSignal = rsi > longThreshold and ema20 > ema50 and ema50 > ema100 and ema100 > ema200

// Short sinyal koşulu
shortSignal = rsi < shortThreshold and ema20 < ema50 and ema50 < ema100 and ema100 < ema200

// Longtayken stop sinyali: EMA 50'nin EMA 200'nin altına düşmesi veya RSI'nin 30'un altına düşmesi
longStopSignal = ta.barssince(ema50 < ema200) <= 2 and rsi < 30

// Shorttayken stop sinyali: EMA 50'nin EMA 200'nin üstüne çıkması veya RSI'nin 70'in üstüne çıkması
shortStopSignal = ta.barssince(ema50 > ema200) <= 2 and rsi > 70

// Sinyallerin art arda ne kadar süredir true olduğunu tutan değişkenler
longConditionMet = ta.barssince(longSignal) <= 2
shortConditionMet = ta.barssince(shortSignal) <= 2

// Trend durumlarını izlemek için değişkenler
var bool inLong = false
var bool inShort = false

if (longConditionMet and not inLong)
    inLong := true
    inShort := false
    strategy.entry("Long", strategy.long)
else if (shortConditionMet and not inShort)
    inShort := true
    inLong := false
    strategy.entry("Short", strategy.short)
else if (inLong and longStopSignal)
    inLong := false
    strategy.close("Long")
else if (inShort and shortStopSignal)
    inShort := false
    strategy.close("Short")

// Grafik üzerinde long ve short dönemlerini işaretleme
bgcolor(inLong ? color.new(color.green, 80) : na)
bgcolor(inShort ? color.new(color.red, 80) : na)

// EMA'ları grafik üzerinde gösterme
plot(ema20, title="EMA 20", color=color.blue)
plot(ema50, title="EMA 50", color=color.orange)
plot(ema100, title="EMA 100", color=color.purple)
plot(ema200, title="EMA 200", color=color.red)
Detail
https://www.fmz.com/strategy/458074
Last Modified
2024-07-29 17:07:02