
7.0 KiB
Name
多重指标趋势跟踪结合RSI超买超卖的量化交易策略-Multi-Indicator-Trend-Following-with-RSI-Overbought-Oversold-Quantitative-Trading-Strategy
Author
ChaoZhang
Strategy Description
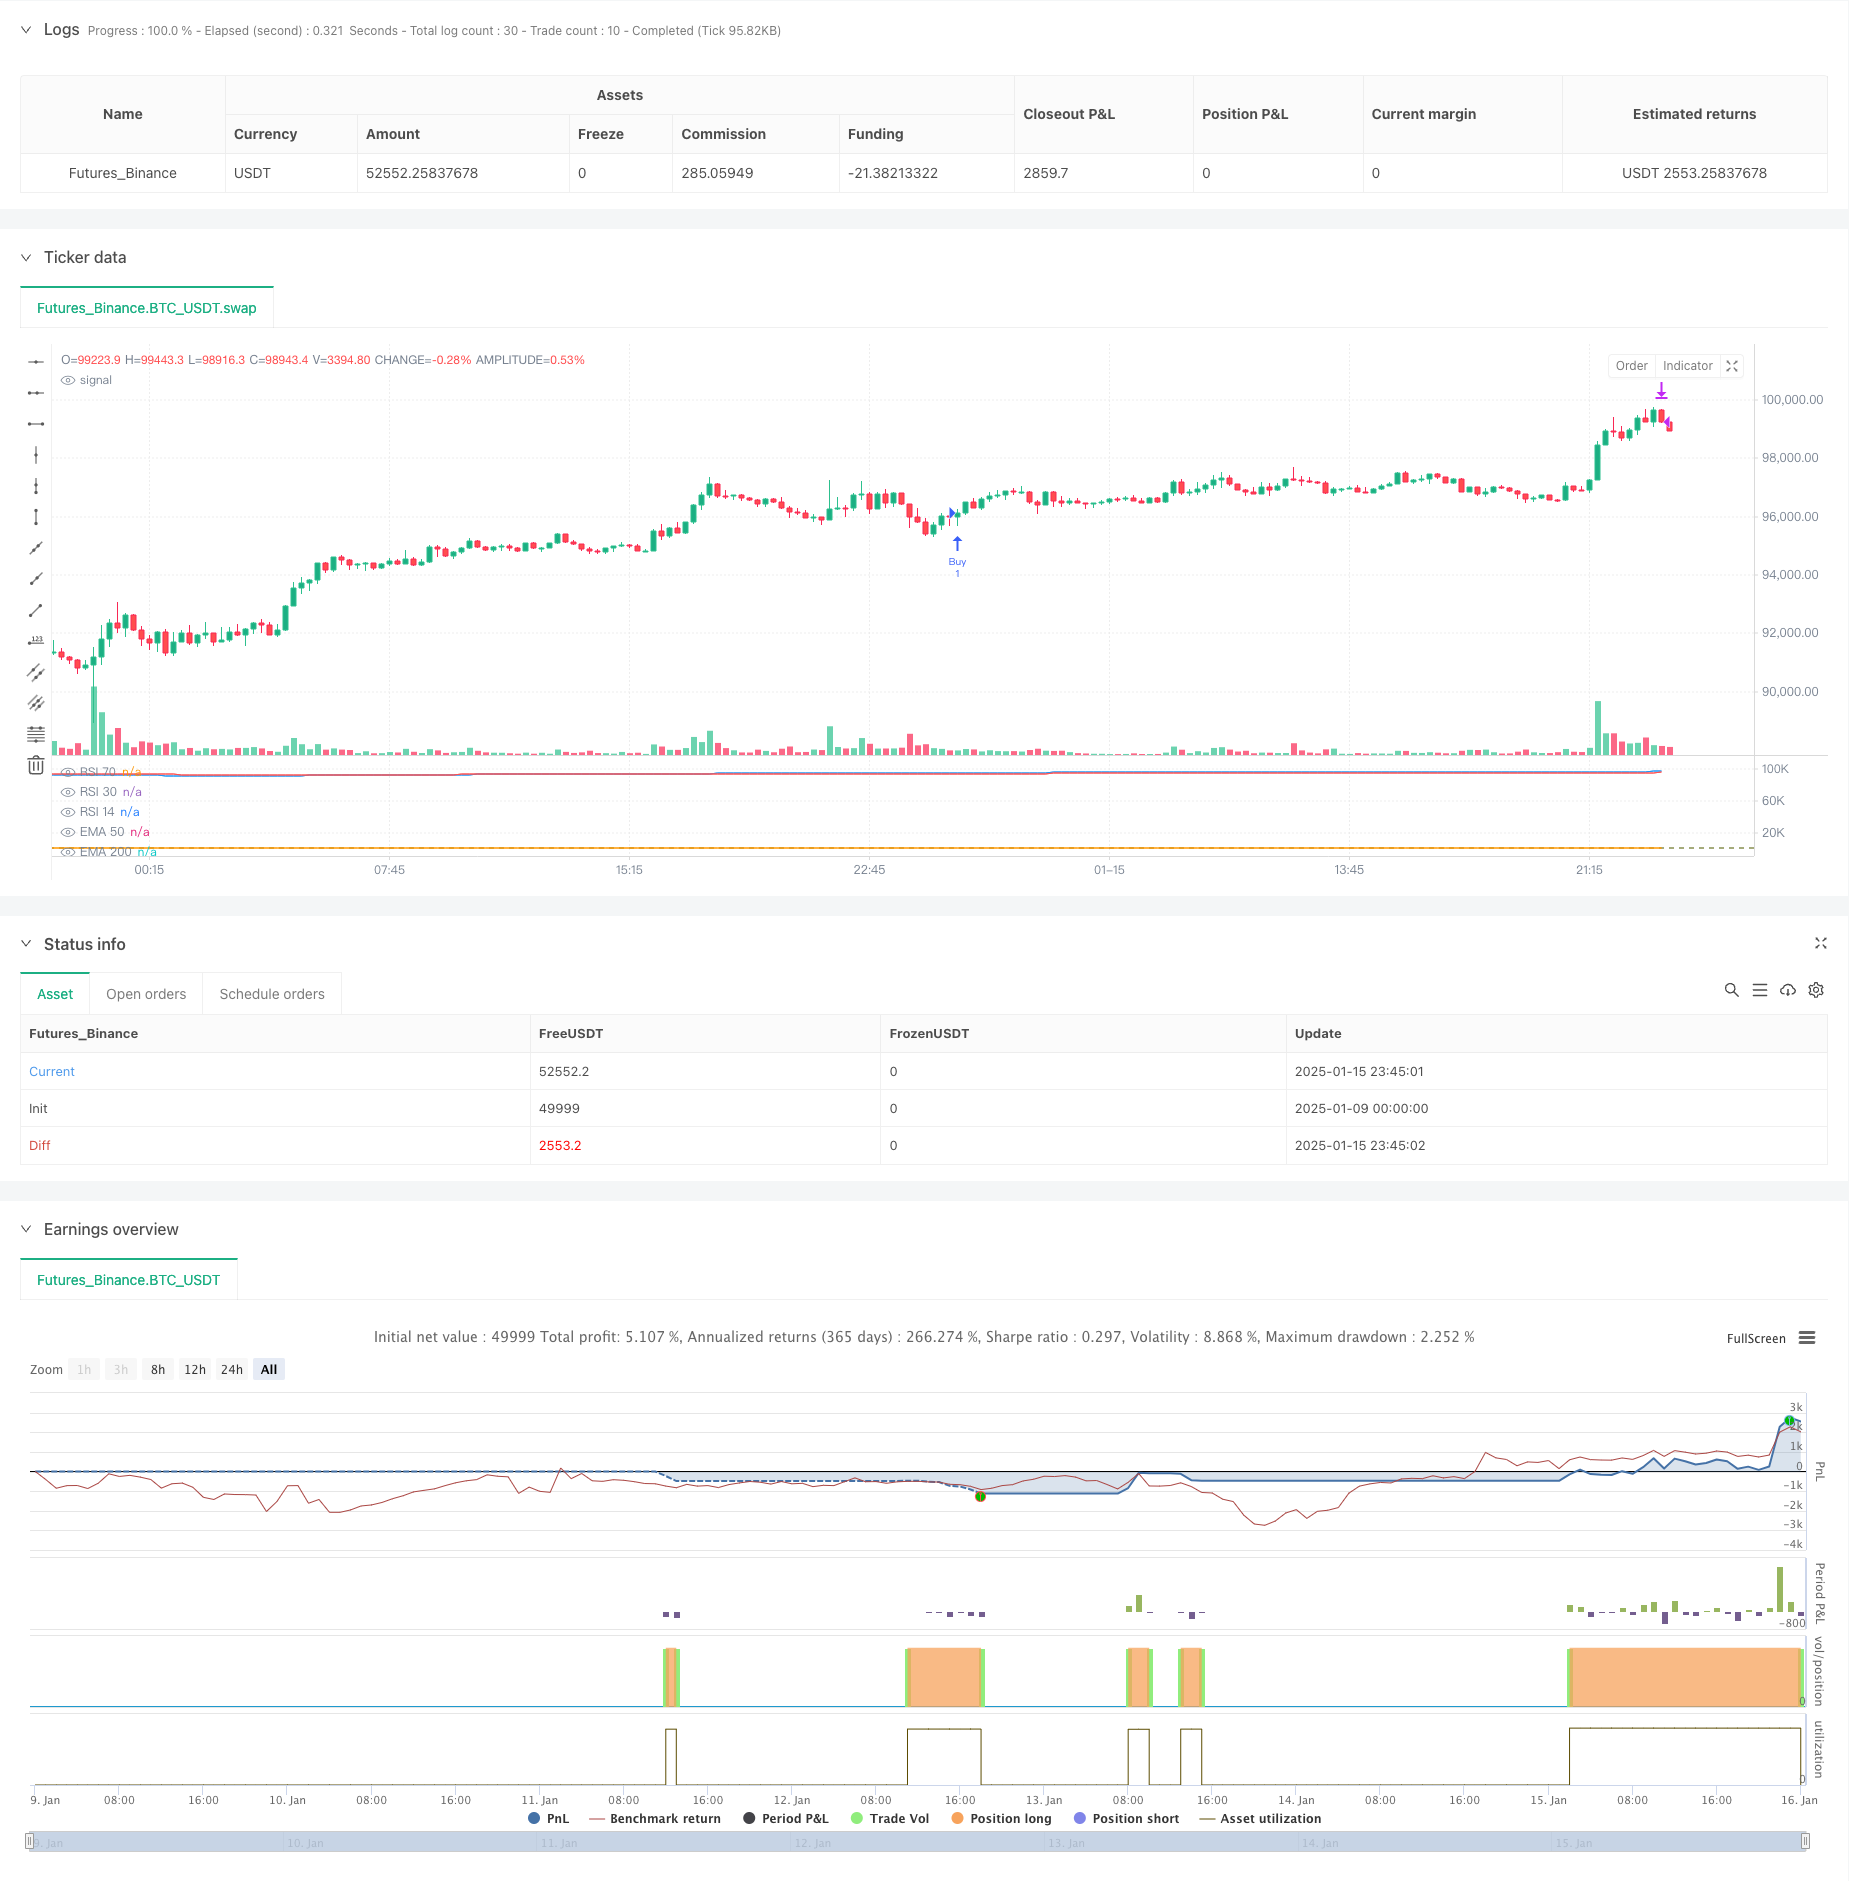
[trans]
概述
该策略是一个结合了多重技术指标的量化交易系统,主要通过EMA均线判断市场趋势,同时结合MACD动量指标捕捉趋势反转时机,并利用RSI指标进行超买超卖判断。这种多重指标的配合使用,能够有效地过滤虚假信号,提高交易成功率。
策略原理
策略的核心逻辑包含以下几个关键部分:
- 趋势判断:使用50周期和200周期的EMA均线,当短期EMA在长期EMA上方时确认上升趋势
- 入场信号:在确认上升趋势的基础上,要求MACD指标位于零轴以下且出现拐头向上的形态,表明可能出现反转机会
- 出场信号:通过RSI指标超买区域(70)的向下突破作为获利了结的时机
- 止损设置:当短期EMA跌破长期EMA时触发止损,及时控制风险
策略优势
- 多重指标互补:结合趋势指标(EMA)、动量指标(MACD)和摆动指标(RSI),能够从多个维度确认交易信号
- 风险控制完善:设置了明确的止损条件,可以有效控制下行风险
- 趋势跟踪特性:策略设计倾向于捕捉强势上涨趋势,有利于获取较大的趋势性收益
- 信号可靠性高:入场需满足多重条件,可以有效降低虚假信号
策略风险
- 滞后性风险:均线系统具有一定滞后性,可能导致入场或出场时机略有延迟
- 震荡市风险:在横盘震荡市场中,可能产生频繁的虚假信号
- 参数敏感性:策略效果对参数设置较为敏感,不同市场环境可能需要调整参数
- 趋势依赖性:策略在非趋势市场的表现可能不够理想
策略优化方向
- 参数自适应:可以考虑根据市场波动率自动调整EMA和RSI的周期参数
- 信号确认机制:可以添加成交量等辅助指标来进一步确认信号的可靠性
- 仓位管理:引入动态仓位管理机制,根据信号强度和市场波动调整持仓比例
- 市场环境识别:增加市场环境判断模块,在不同市场条件下采用不同的参数设置
总结
该策略通过多重技术指标的协同配合,构建了一个较为完善的交易系统。策略的优势在于信号可靠性高、风险控制完善,但也存在一定的滞后性和参数敏感性问题。通过建议的优化方向,特别是引入自适应参数和动态仓位管理,可以进一步提高策略的稳定性和收益能力。策略适合在趋势明确的市场环境中使用,投资者需要根据具体市场特点调整参数设置。
||
Overview
This strategy is a quantitative trading system that combines multiple technical indicators, primarily using EMA for trend identification, MACD for momentum detection, and RSI for overbought/oversold conditions. This multi-indicator approach effectively filters out false signals and improves trading accuracy.
Strategy Principles
The core logic includes several key components:
- Trend Identification: Uses 50-period and 200-period EMAs, confirming uptrend when short-term EMA is above long-term EMA
- Entry Signals: Under confirmed uptrend conditions, requires MACD below zero with upward reversal pattern
- Exit Signals: Uses RSI overbought zone (70) downward breakout for profit-taking
- Stop Loss: Triggers when short-term EMA crosses below long-term EMA for risk control
Strategy Advantages
- Complementary Indicators: Combines trend (EMA), momentum (MACD), and oscillator (RSI) indicators for multi-dimensional signal confirmation
- Robust Risk Control: Implements clear stop-loss conditions for effective downside risk management
- Trend Following Characteristics: Designed to capture strong upward trends for significant trend-based returns
- High Signal Reliability: Multiple conditions required for entry reduce false signals
Strategy Risks
- Lag Risk: Moving average systems have inherent lag, potentially causing delayed entry or exit
- Consolidation Market Risk: May generate frequent false signals in range-bound markets
- Parameter Sensitivity: Strategy performance is sensitive to parameter settings, requiring adjustment for different market conditions
- Trend Dependency: May underperform in non-trending markets
Optimization Directions
- Parameter Adaptation: Consider implementing automatic parameter adjustment based on market volatility
- Signal Confirmation: Add volume analysis for additional signal validation
- Position Management: Introduce dynamic position sizing based on signal strength and market volatility
- Market Environment Recognition: Develop market condition identification module for parameter optimization
Summary
This strategy creates a comprehensive trading system through the synergy of multiple technical indicators. Its strengths lie in high signal reliability and robust risk control, though it faces challenges with lag and parameter sensitivity. Through suggested optimizations, particularly adaptive parameters and dynamic position management, the strategy's stability and profitability can be enhanced. It is best suited for trending markets, and investors should adjust parameters according to specific market characteristics.[/trans]
Source (PineScript)
/*backtest
start: 2025-01-09 00:00:00
end: 2025-01-16 00:00:00
period: 15m
basePeriod: 15m
exchanges: [{"eid":"Futures_Binance","currency":"BTC_USDT","balance":49999}]
*/

//@version=5
strategy("RSI ve EMA Tabanlı Alım-Satım Stratejisi", overlay=false)

// EMA Hesaplamaları
ema_short = ta.ema(close, 50)  // EMA 50
ema_long = ta.ema(close, 200) // EMA 200

// MACD Hesaplamaları
[macd, signal, _] = ta.macd(close, 12, 26, 9)

// RSI Hesaplamaları
rsi = ta.rsi(close, 14)

// Alım Sinyali Koşulları
macd_condition = (macd < 0) and (macd > nz(macd[1])) and (nz(macd[1]) < nz(macd[2]))
buy_signal = (ema_short > ema_long) and macd_condition

// Satım Sinyali Koşulları
sell_signal = (rsi[1] > 70) and (rsi <= 70)  // RSI 70'i yukarıdan aşağıya kırdı

// Stop Loss Koşulu
stop_loss = ema_short < ema_long

// İşlem ve Etiketler
if buy_signal
    strategy.entry("Buy", strategy.long)
    label.new(bar_index, high, "AL", style=label.style_label_up, color=color.green, textcolor=color.white)

if sell_signal
    strategy.close("Buy", comment="SAT")
    label.new(bar_index, high, "SAT", style=label.style_label_down, color=color.red, textcolor=color.white)

if stop_loss
    strategy.close("Buy", comment="STOP LOSS")
    label.new(bar_index, low, "STOP LOSS", style=label.style_label_down, color=color.orange, textcolor=color.white)

// Grafik Üzerine Çizgiler ve Göstergeler
plot(ema_short, color=color.blue, title="EMA 50")
plot(ema_long, color=color.red, title="EMA 200")
plot(rsi, color=color.orange, title="RSI 14")
hline(70, "RSI 70", color=color.red)
hline(30, "RSI 30", color=color.green)
Detail
https://www.fmz.com/strategy/478701
Last Modified
2025-01-17 14:52:29