
8.8 KiB
Name
多重指标趋势识别与动量验证交易策略-Multi-Indicator-Trend-Recognition-and-Momentum-Validation-Trading-Strategy
Author
ianzeng123
Strategy Description
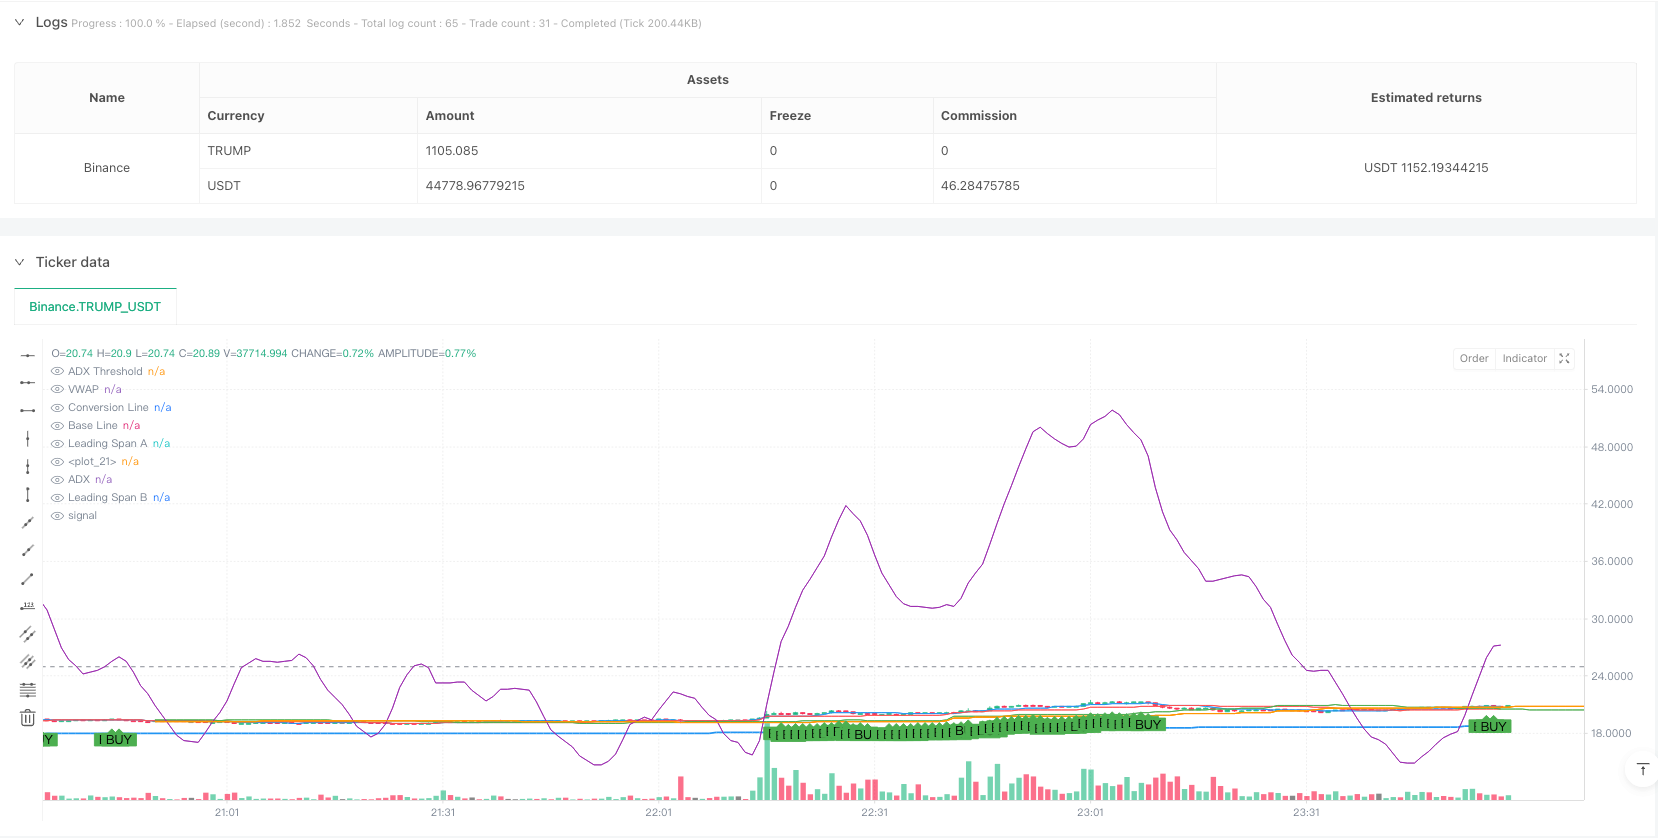
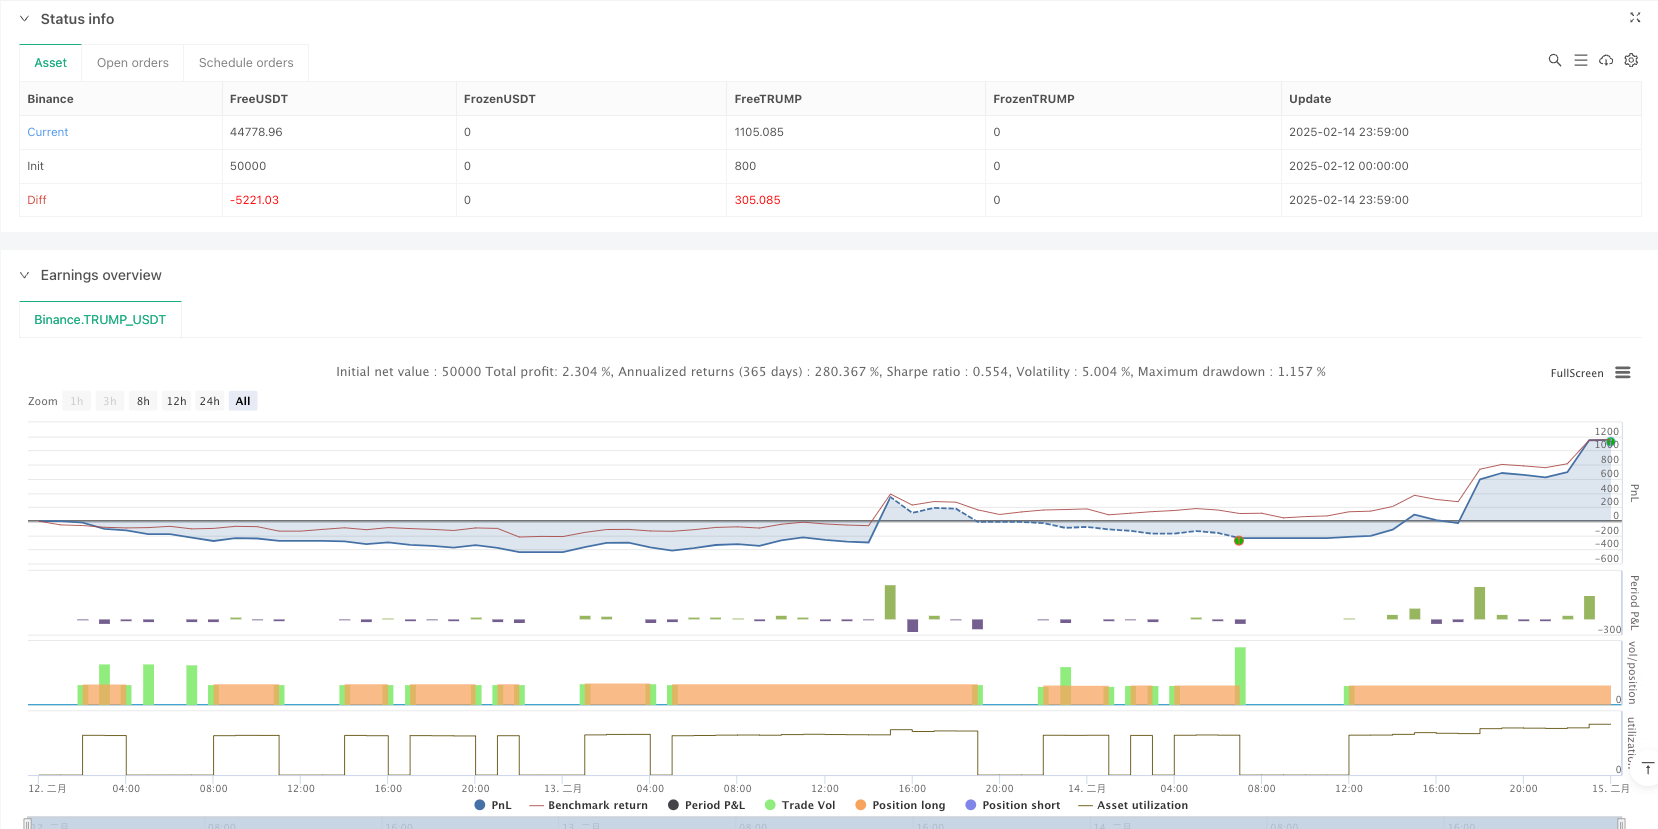
[trans]
概述
该策略是一个结合了一系列技术指标的复杂交易系统,主要利用市云(Ichimoku Cloud)、平均趋向指数(ADX)和成交量加权平均价格(VWAP)三个核心指标来识别市场趋势、验证动量强度并确认价格位置。该策略通过多维度分析来提高交易的准确性和可靠性,特别适合中长期趋势交易。
策略原理
策略采用三层验证机制:
- 使用市云系统(含转换线、基准线、先行带A、先行带B)来确定市场趋势方向,通过价格与云层的位置关系判断多空势态。
- 运用ADX指标(设定14周期)来评估趋势强度,当ADX数值超过25时表明趋势充分发展。
- 利用VWAP作为动态支撑/阻力位,用于确认价格位置的合理性。
交易信号产生条件: 买入信号:价格位于先行带A和B之上 + ADX>25 + 价格在VWAP之上 卖出信号:价格位于先行带A和B之下 + ADX>25 + 价格在VWAP之下
策略优势
- 多维度验证机制显著提高了交易的可靠性,避免了单一指标可能带来的虚假信号。
- 结合了趋势跟踪和动量分析,既能把握大趋势,又能在适当时机进行交易。
- 通过VWAP的验证增加了价格合理性的判断,提高了交易的成功率。
- 策略设计具有良好的防护机制,能有效规避震荡市场的干扰。
策略风险
-
在震荡市场中可能产生频繁的交易信号,增加交易成本。 解决方案:可以增加持仓时间的最小限制,或者加入振荡指标进行过滤。
-
市场快速转向时可能出现较大回撤。 解决方案:设置适当的止损位置,可以考虑使用ATR指标动态调整止损。
-
多重条件的设置可能导致错过一些潜在的交易机会。 解决方案:可以根据不同市场条件动态调整参数,或者设置不同的参数组合。
策略优化方向
- 参数优化:可以通过历史数据回测,为不同市场环境优化各指标的参数设置。
- 增加市场环境识别:加入波动率指标(如ATR),在不同波动环境下采用不同的参数组合。
- 完善风险控制:引入动态止损机制,根据市场波动情况自动调整止损距离。
- 优化持仓管理:加入分批建仓和分批平仓机制,提高资金利用效率。
总结
该策略通过结合多个成熟可靠的技术指标,构建了一个完整的交易系统。系统不仅包含了趋势识别、动量确认和价格验证等核心功能,还提供了清晰的交易规则和风险控制机制。虽然存在一定的优化空间,但整体而言是一个逻辑严密、实用性强的交易策略。 ||
Overview
This strategy is a sophisticated trading system that combines multiple technical indicators, primarily utilizing the Ichimoku Cloud, Average Directional Index (ADX), and Volume Weighted Average Price (VWAP) to identify market trends, validate momentum strength, and confirm price positioning. The strategy employs multi-dimensional analysis to enhance trading accuracy and reliability, particularly suitable for medium to long-term trend trading.
Strategy Principles
The strategy employs a three-layer verification mechanism:
- Uses the Ichimoku Cloud system (including Conversion Line, Base Line, Leading Span A, and B) to determine market trend direction through price-cloud relationships.
- Employs the ADX indicator (14-period setting) to evaluate trend strength, with readings above 25 indicating strong trend development.
- Utilizes VWAP as dynamic support/resistance levels to confirm price positioning validity.
Trade Signal Generation: Buy Signal: Price above both Leading Spans A and B + ADX>25 + Price above VWAP Sell Signal: Price below both Leading Spans A and B + ADX>25 + Price below VWAP
Strategy Advantages
- Multi-dimensional verification significantly improves trading reliability, avoiding false signals from single indicators.
- Combines trend following and momentum analysis, capturing major trends while timing entries effectively.
- VWAP verification adds price rationality judgment, improving success rates.
- Strategy design includes robust protection mechanisms against market noise.
Strategy Risks
-
May generate frequent signals in ranging markets, increasing transaction costs. Solution: Implement minimum holding period restrictions or add oscillator filters.
-
Potential significant drawdowns during rapid market reversals. Solution: Set appropriate stop-loss levels, consider using ATR for dynamic stop adjustment.
-
Multiple conditions may cause missed trading opportunities. Solution: Dynamically adjust parameters for different market conditions or use parameter combinations.
Strategy Optimization Directions
- Parameter Optimization: Backtest historical data to optimize indicator parameters for different market environments.
- Market Environment Recognition: Add volatility indicators (like ATR) to employ different parameter sets in varying volatility conditions.
- Risk Control Enhancement: Implement dynamic stop-loss mechanisms that adjust based on market volatility.
- Position Management Improvement: Include scaled entry and exit mechanisms to improve capital efficiency.
Summary
This strategy creates a comprehensive trading system by combining multiple proven technical indicators. The system incorporates core functionalities including trend identification, momentum confirmation, and price verification, while providing clear trading rules and risk control mechanisms. While there is room for optimization, it represents a logically sound and practical trading strategy.[/trans]
Source (PineScript)
/*backtest
start: 2025-02-12 00:00:00
end: 2025-02-15 00:00:00
period: 1m
basePeriod: 1m
exchanges: [{"eid":"Binance","currency":"TRUMP_USDT"}]
*/

//@version=5
strategy("Ichimoku + ADX + VWAP Strategy", overlay=true, default_qty_type=strategy.percent_of_equity, default_qty_value=10)

// --- Ichimoku Cloud Parameters ---
conversionPeriods = 9
basePeriods = 26
laggingSpan2Periods = 52
displacement = 26

// --- Ichimoku Cloud Calculation ---
conversionLine = (ta.highest(high, conversionPeriods) + ta.lowest(low, conversionPeriods)) / 2
baseLine = (ta.highest(high, basePeriods) + ta.lowest(low, basePeriods)) / 2
leadingSpanA = (conversionLine + baseLine) / 2
leadingSpanB = (ta.highest(high, laggingSpan2Periods) + ta.lowest(low, laggingSpan2Periods)) / 2

// Plot Ichimoku Cloud
plot(conversionLine, color=color.blue, title="Conversion Line")
plot(baseLine, color=color.red, title="Base Line")
plot(leadingSpanA, color=color.green, title="Leading Span A", offset=displacement)
plot(leadingSpanB, color=color.orange, title="Leading Span B", offset=displacement)
fill(plot(leadingSpanA, offset=displacement), plot(leadingSpanB, offset=displacement),
     color=leadingSpanA > leadingSpanB ? color.new(color.green, 90) : color.new(color.red, 90),
     title="Ichimoku Cloud")

// --- ADX Calculation ---
adx_length = 14
upMove = high - high[1]
downMove = low[1] - low
plusDM = upMove > downMove and upMove > 0 ? upMove : 0
minusDM = downMove > upMove and downMove > 0 ? downMove : 0
tr = ta.tr(true)
smoothedPlusDM = ta.rma(plusDM, adx_length)
smoothedMinusDM = ta.rma(minusDM, adx_length)
smoothedTR = ta.rma(tr, adx_length)
plusDI = (smoothedPlusDM / smoothedTR) * 100
minusDI = (smoothedMinusDM / smoothedTR) * 100
dx = math.abs(plusDI - minusDI) / (plusDI + minusDI) * 100
adx = ta.rma(dx, adx_length)

// Plot ADX
adx_threshold = 25
hline(adx_threshold, "ADX Threshold", color=color.gray)
plot(adx, color=color.purple, title="ADX")

// --- VWAP Calculation ---
vwap_val = ta.vwap(close)
plot(vwap_val, color=color.blue, title="VWAP", linewidth=2)

// --- Buy and Sell Conditions ---
// Buy Condition:
// - Cena je nad oboma Leading Span A a B
// - ADX je nad prahovou hodnotou
// - Cena je nad VWAP
buyCondition = close > leadingSpanA and close > leadingSpanB and adx > adx_threshold and close > vwap_val

// Sell Condition:
// - Cena je pod oboma Leading Span A a B
// - ADX je nad prahovou hodnotou
// - Cena je pod VWAP
sellCondition = close < leadingSpanA and close < leadingSpanB and adx > adx_threshold and close < vwap_val

// Plot Buy/Sell Signals
plotshape(series=buyCondition, title="Buy Signal", location=location.belowbar, color=color.green, style=shape.labelup, text="BUY")
plotshape(series=sellCondition, title="Sell Signal", location=location.abovebar, color=color.red, style=shape.labeldown, text="SELL")

// --- Execute Trades ---
if (buyCondition)
    strategy.entry("Long", strategy.long)

if (sellCondition)
    strategy.close("Long")
Detail
https://www.fmz.com/strategy/482782
Last Modified
2025-02-20 10:48:51