
8.0 KiB
Name
多重指标趋势突破量化交易策略-Multi-Indicator-Trend-Breakout-Quantitative-Trading-Strategy
Author
ChaoZhang
Strategy Description
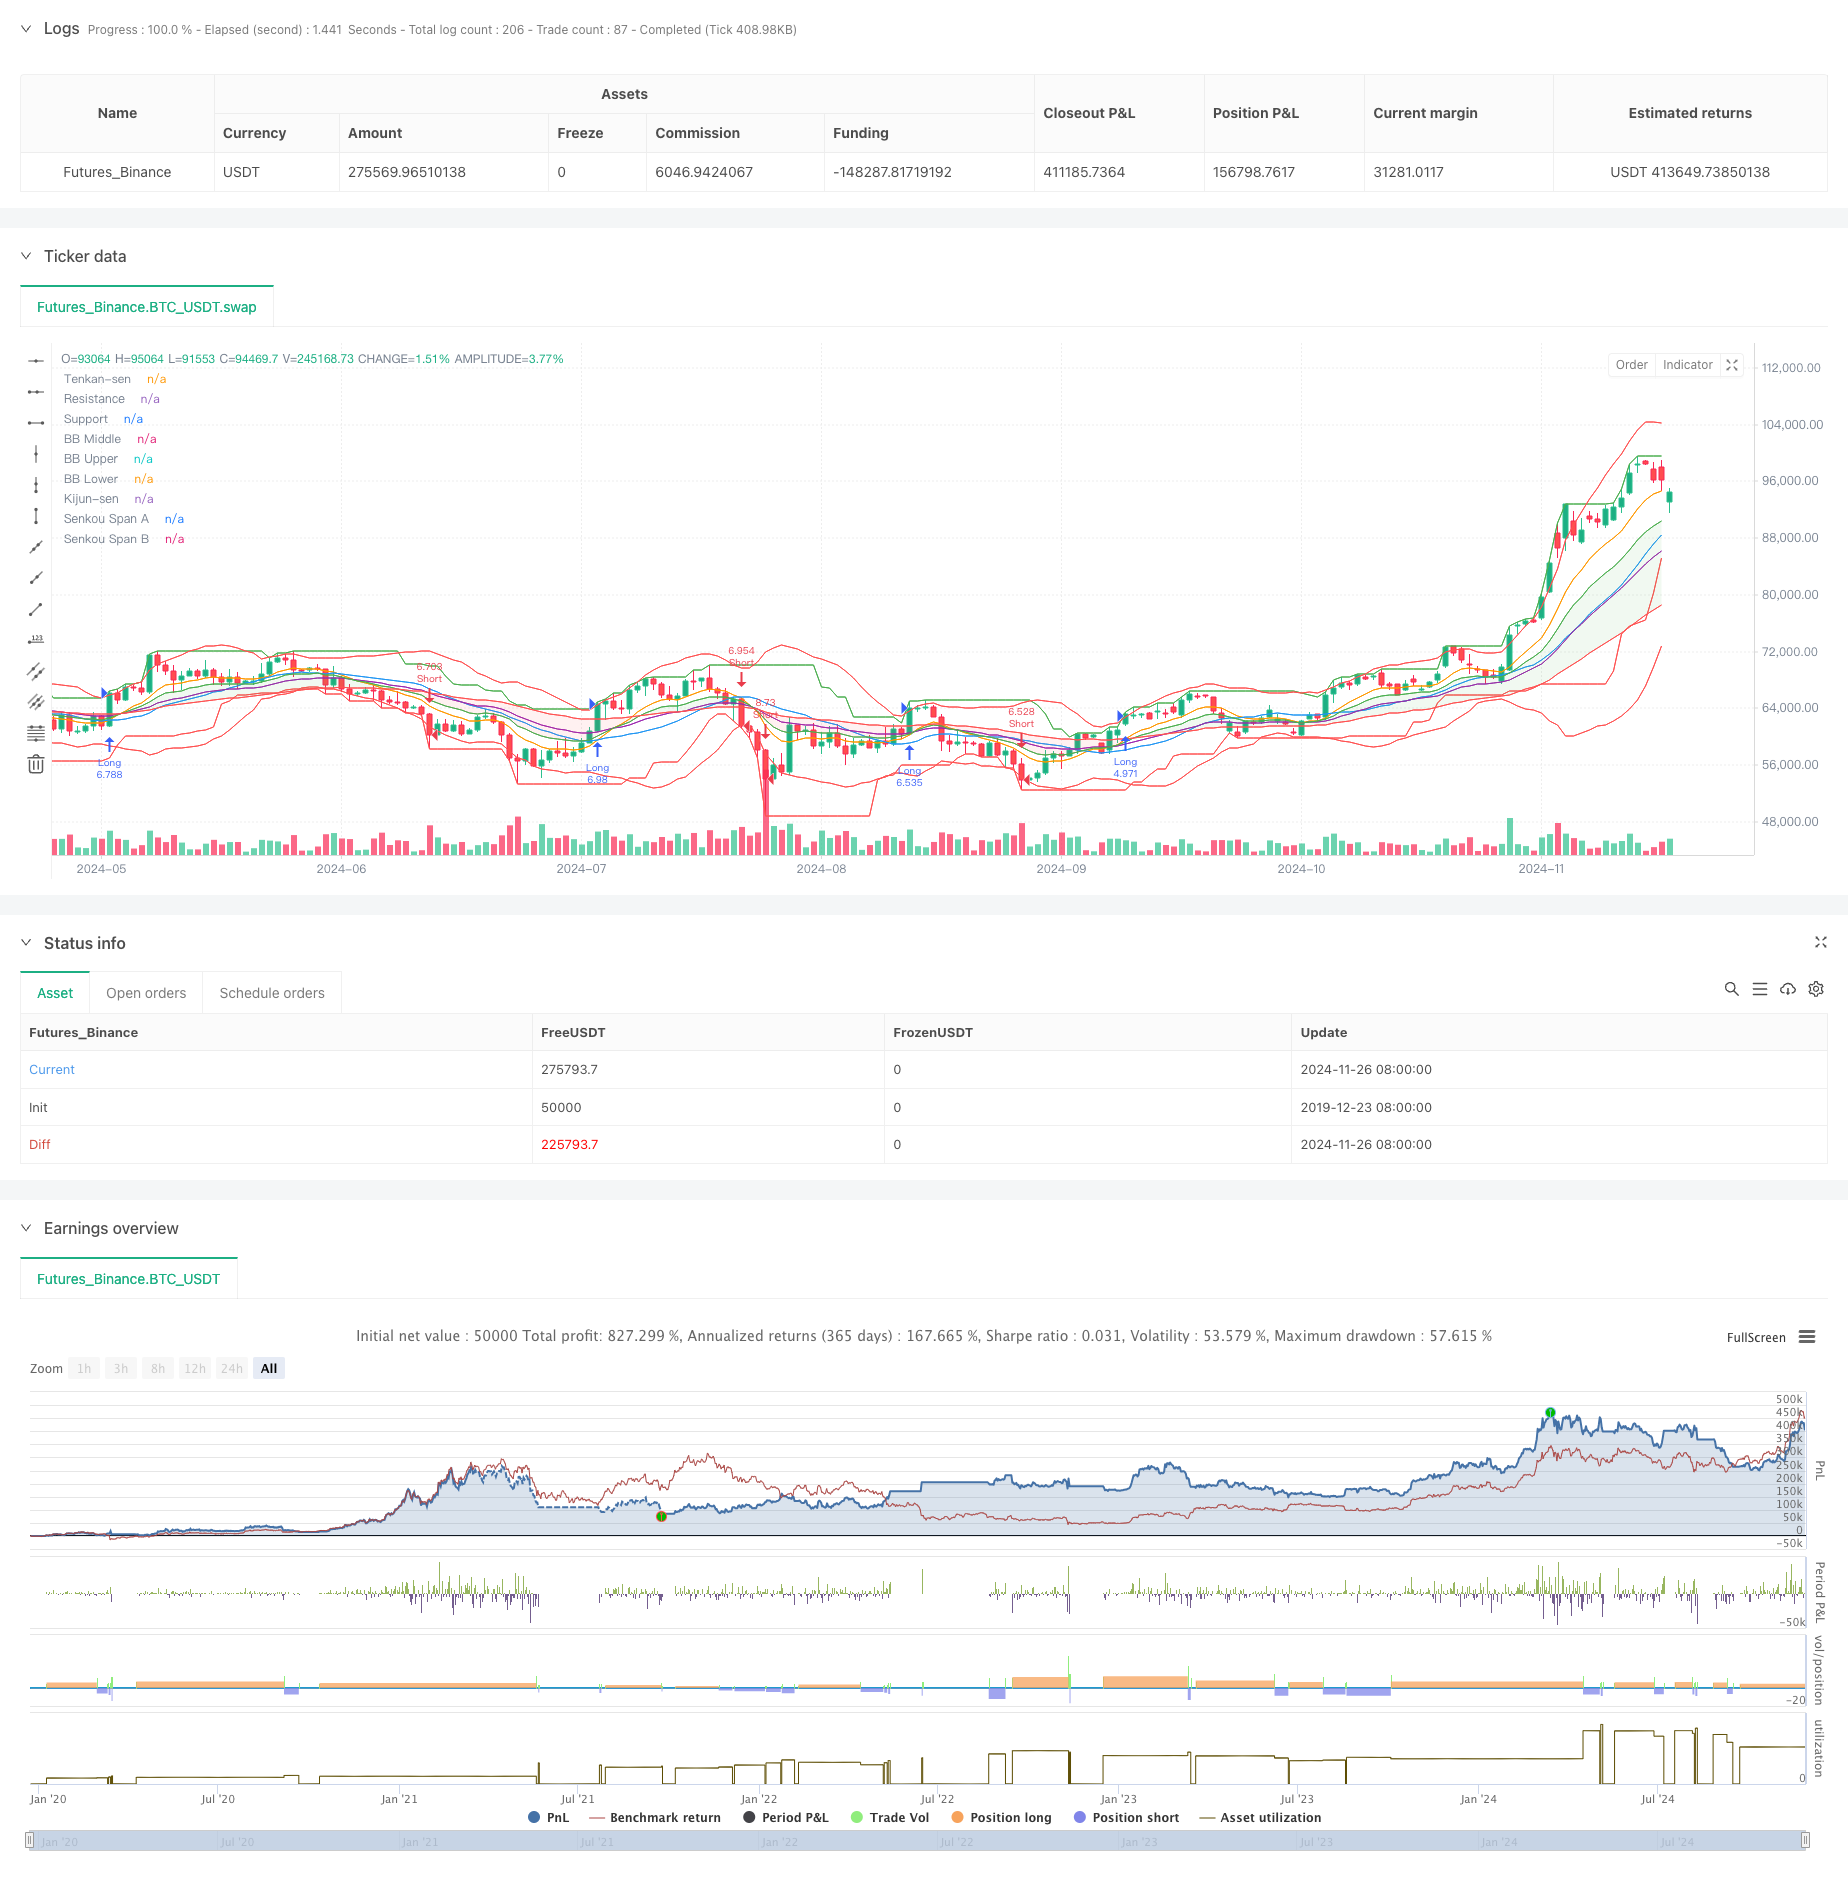
[trans]
概述
这是一个结合了布林带、一目均衡图和支撑阻力位的多重指标量化交易策略。策略通过分析市场波动性、趋势强度和关键价格水平来识别潜在的交易机会。策略采用了精确的入场条件和风险管理方法,以实现稳健的交易表现。该策略的核心在于通过多个技术指标的交叉验证来提高交易信号的可靠性。
策略原理
策略运用了三个主要技术指标组件:布林带用于衡量市场波动性和超买超卖状态;一目均衡图用于评估趋势方向和强度;支撑阻力位用于识别关键价格水平。多重指标的组合使用提供了更全面的市场视角。
交易信号的生成基于以下条件:当价格突破布林带上轨、位于一目云之上且突破前期高点时,触发做多信号;当价格跌破布林带下轨、位于一目云之下且跌破前期低点时,触发做空信号。策略还包含了基于百分比的止盈止损设置,以控制风险。
策略优势
- 多重指标交叉验证提高了交易信号的可靠性
- 结合了趋势跟踪和突破交易的优点
- 具有清晰的风险管理机制
- 参数可根据不同市场情况灵活调整
- 通过技术指标组合降低了假信号的影响
- 完整的可视化支持有助于交易决策
策略风险
- 在震荡市场中可能产生频繁的假突破信号
- 多重指标可能导致信号滞后
- 参数优化可能导致过度拟合
- 市场急剧波动时止损可能失效
- 交易成本可能影响策略收益 建议通过以下方式管理风险:调整止损位置、优化参数设置、增加过滤条件等。
策略优化方向
- 增加交易量分析指标,提高信号可靠性
- 引入自适应参数调整机制
- 添加市场波动率过滤器
- 优化止盈止损机制,如引入移动止损
- 增加时间过滤功能,避免特定时段交易
- 添加回撤控制机制
总结
这是一个综合运用多个技术指标的量化交易策略,通过趋势突破和多重信号确认来把握交易机会。策略的优势在于信号可靠性高、风险管理完善,但需要注意假突破和参数优化等问题。通过持续优化和风险管理,该策略有望在各类市场环境中保持稳定表现。
||
Overview
This is a multi-indicator quantitative trading strategy that combines Bollinger Bands, Ichimoku Cloud, and Support/Resistance levels. The strategy identifies potential trading opportunities by analyzing market volatility, trend strength, and key price levels. It employs precise entry conditions and risk management methods to achieve robust trading performance. The core strength lies in cross-validation through multiple technical indicators to enhance signal reliability.
Strategy Principles
The strategy utilizes three main technical indicator components: Bollinger Bands for measuring market volatility and overbought/oversold conditions; Ichimoku Cloud for evaluating trend direction and strength; Support/Resistance levels for identifying key price levels. The combination of multiple indicators provides a more comprehensive market perspective.
Trade signals are generated based on the following conditions: Long signals are triggered when price breaks above the upper Bollinger Band, positions above the Ichimoku Cloud, and breaks above the previous high; Short signals are triggered when price breaks below the lower Bollinger Band, positions below the Ichimoku Cloud, and breaks below the previous low. The strategy includes percentage-based profit targets and stop losses for risk control.
Strategy Advantages
- Multiple indicator cross-validation improves signal reliability
- Combines benefits of trend following and breakout trading
- Clear risk management mechanism
- Parameters can be flexibly adjusted for different market conditions
- Technical indicator combination reduces false signals
- Complete visualization support aids trading decisions
Strategy Risks
- May generate frequent false breakout signals in ranging markets
- Multiple indicators might lead to lagging signals
- Parameter optimization may result in overfitting
- Stop losses might fail during sharp market movements
- Trading costs may impact strategy returns Risk management recommendations include: adjusting stop loss positions, optimizing parameters, adding filtering conditions, etc.
Optimization Directions
- Add volume analysis indicators to improve signal reliability
- Introduce adaptive parameter adjustment mechanism
- Add market volatility filters
- Optimize profit-taking and stop-loss mechanisms, such as trailing stops
- Add time filtering to avoid trading during specific periods
- Implement drawdown control mechanisms
Conclusion
This is a quantitative trading strategy that comprehensively utilizes multiple technical indicators, capturing trading opportunities through trend breakouts and multiple signal confirmations. The strategy's strengths lie in high signal reliability and robust risk management, but attention must be paid to false breakouts and parameter optimization issues. Through continuous optimization and risk management, the strategy has the potential to maintain stable performance across various market conditions. [/trans]
Source (PineScript)
/*backtest
start: 2019-12-23 08:00:00
end: 2024-11-27 08:00:00
period: 1d
basePeriod: 1d
exchanges: [{"eid":"Futures_Binance","currency":"BTC_USDT"}]
*/

//@version=5
strategy("BB Ichimoku S/R Strategy", overlay=true, initial_capital=10000, default_qty_type=strategy.percent_of_equity, default_qty_value=100)

// Input parameters
bb_length = input.int(20, "Bollinger Bands Length")
bb_mult = input.float(2.0, "Bollinger Bands Multiplier")
ichimoku_tenkan = input.int(9, "Ichimoku Tenkan-sen")
ichimoku_kijun = input.int(26, "Ichimoku Kijun-sen")
ichimoku_senkou = input.int(52, "Ichimoku Senkou Span B")
sr_lookback = input.int(14, "S/R Lookback Period")
profit_target = input.float(1.5, "Profit Target (%)", minval=0.1, step=0.1)
stop_loss = input.float(1.0, "Stop Loss (%)", minval=0.1, step=0.1)

// Bollinger Bands
[bb_middle, bb_upper, bb_lower] = ta.bb(close, bb_length, bb_mult)

// Ichimoku Cloud
tenkan = ta.ema(hl2, ichimoku_tenkan)
kijun = ta.ema(hl2, ichimoku_kijun)
spanA = (tenkan + kijun) / 2
spanB = ta.ema(hl2, ichimoku_senkou)

// Support and Resistance
highest_high = ta.highest(high, sr_lookback)
lowest_low = ta.lowest(low, sr_lookback)

// Entry conditions
long_condition = close > bb_upper and close > spanA and close > spanB and close > highest_high[1]
short_condition = close < bb_lower and close < spanA and close < spanB and close < lowest_low[1]

// Execute trades
if (long_condition)
    strategy.entry("Long", strategy.long)

if (short_condition)
    strategy.entry("Short", strategy.short)

// Set profit target and stop loss
strategy.exit("TP/SL", "Long", profit=strategy.position_avg_price * (1 + profit_target / 100), loss=strategy.position_avg_price * (1 - stop_loss / 100))
strategy.exit("TP/SL", "Short", profit=strategy.position_avg_price * (1 - profit_target / 100), loss=strategy.position_avg_price * (1 + stop_loss / 100))

// Plot indicators
plot(bb_middle, color=color.blue, title="BB Middle")
plot(bb_upper, color=color.red, title="BB Upper")
plot(bb_lower, color=color.red, title="BB Lower")
plot(tenkan, color=color.orange, title="Tenkan-sen")
plot(kijun, color=color.purple, title="Kijun-sen")
spanA_plot = plot(spanA, color=color.green, title="Senkou Span A")
spanB_plot = plot(spanB, color=color.red, title="Senkou Span B")
plot(highest_high, color=color.green, title="Resistance")
plot(lowest_low, color=color.red, title="Support")

// Fill Ichimoku Cloud
fill(spanA_plot, spanB_plot, color=spanA > spanB ? color.rgb(76, 175, 80, 90) : color.rgb(255, 82, 82, 90))
Detail
https://www.fmz.com/strategy/473377
Last Modified
2024-11-29 15:42:29