
10 KiB
Name
多重指标趋势交易系统结合动量分析策略-Multi-Indicator-Trend-Trading-System-with-Momentum-Analysis-Strategy
Author
ChaoZhang
Strategy Description
[trans]
概述
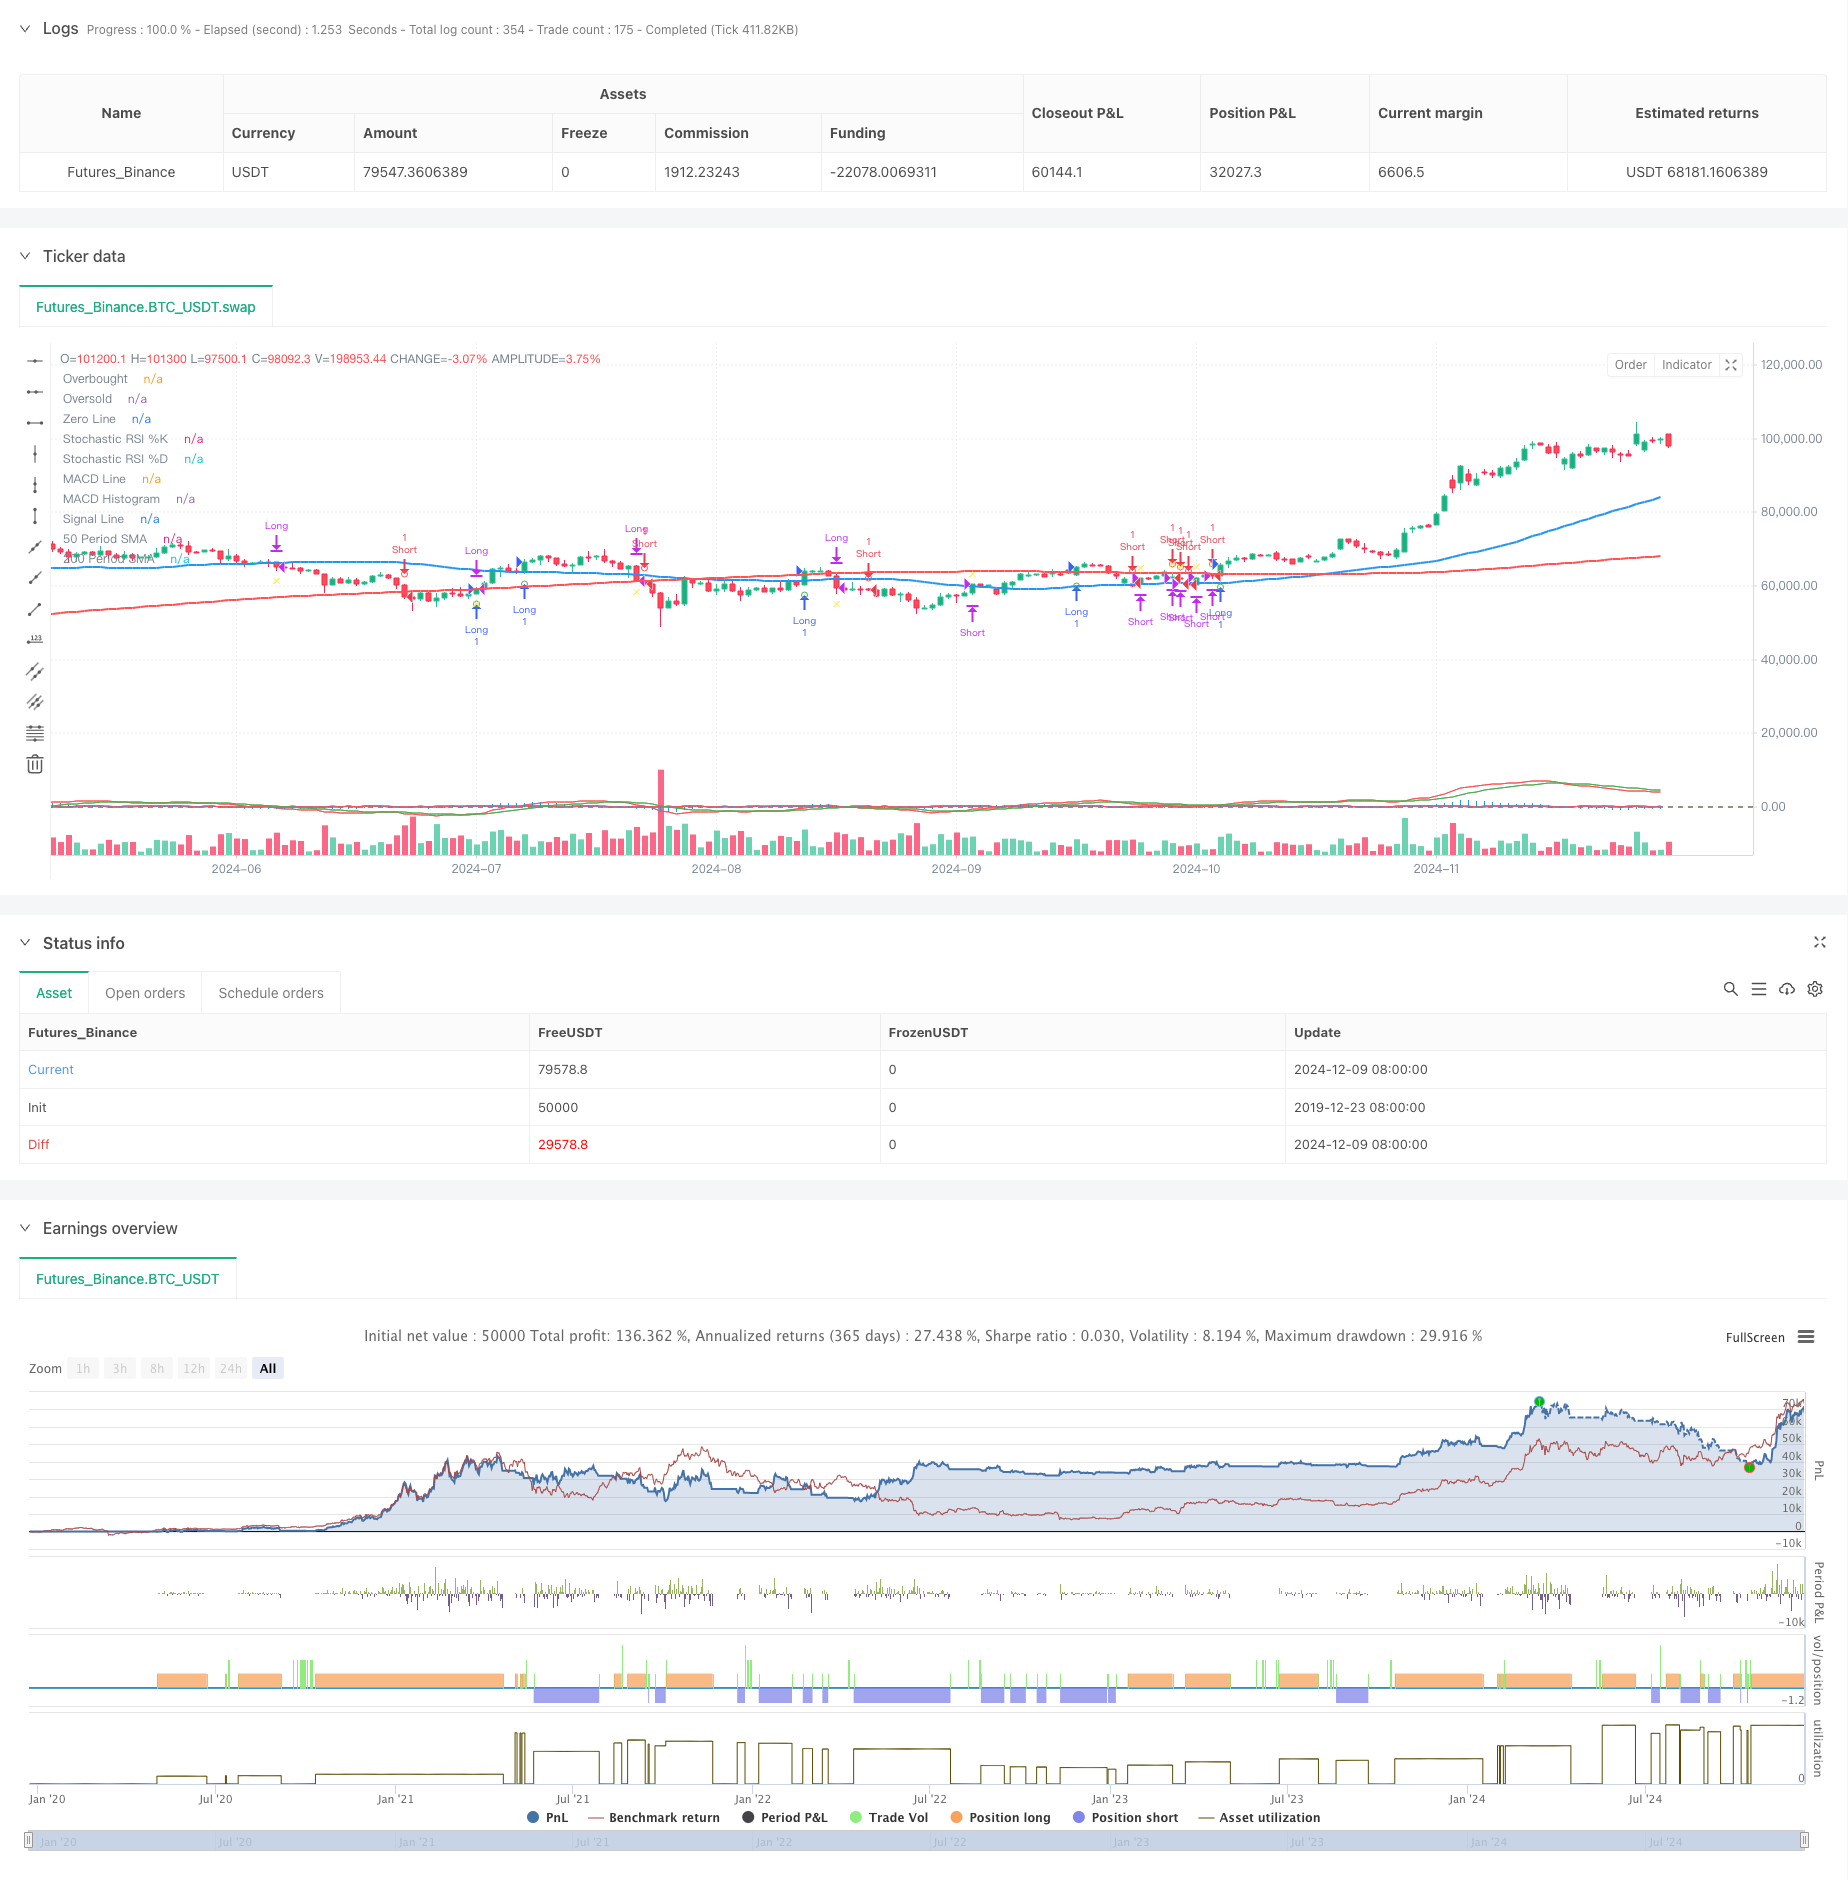
该策略是一个复杂的多重指标交易系统,结合了RSI、MACD、移动平均线(SMA)等多个技术指标,通过分析价格趋势和动量来识别交易机会。策略采用200日均线判断长期趋势,50日均线作为中期趋势参考,并利用随机RSI和MACD的交叉信号来确认交易时机。
策略原理
策略的核心逻辑建立在三个主要支柱上:
- 趋势判断:使用200日均线判断主趋势方向,价格在均线之上为上升趋势,之下为下降趋势。
- 动量确认:利用随机RSI指标(SRSI)的%K线和%D线交叉来确认价格动量,当%K线上穿%D线时表示上升动量增强。
- 趋势确认:使用MACD指标作为趋势确认工具,MACD线在信号线上方时确认上升趋势。
买入条件需同时满足:
- 价格位于200日均线之上
- 随机RSI的%K线上穿%D线
- MACD线位于信号线之上
卖出条件需同时满足:
- 价格位于200日均线之下
- 随机RSI的%K线下穿%D线
- MACD线位于信号线之下
策略优势
- 多重验证:通过多个技术指标的配合使用,降低了假信号的风险。
- 趋势跟踪:结合长期均线和中期均线,有效把握主要趋势。
- 动量识别:使用随机RSI能够更早地发现潜在的趋势转折点。
- 风险控制:使用50日均线作为止损参考,提供了明确的退出机制。
- 系统化运作:策略逻辑清晰,便于程序化实现和回测验证。
策略风险
- 滞后性风险:移动平均线本质上是滞后指标,可能导致入场和出场时机延迟。
- 震荡市风险:在横盘震荡市场中,多重指标可能产生混乱信号。
- 假突破风险:价格短期突破均线后可能快速回落,造成假信号。
- 参数敏感性:多个指标的参数设置需要针对不同市场环境进行优化。
- 信号冲突:不同指标可能产生相互矛盾的信号,增加决策难度。
策略优化方向
-
指标参数优化:
- 可以通过历史数据回测,寻找最优的移动平均线周期
- 优化随机RSI的参数,以适应不同市场波动率
-
信号过滤:
- 添加成交量确认机制
- 引入波动率指标,在高波动率期间调整交易策略
-
风险管理改进:
- 实现动态止损机制
- 根据市场波动率动态调整仓位大小
-
市场适应性:
- 添加市场环境识别机制
- 在不同市场条件下使用不同的参数设置
总结
这是一个系统化的趋势跟踪策略,通过多重技术指标的配合使用,在保证交易可靠性的同时,也提供了清晰的风险控制机制。策略的主要优势在于其多层验证机制,但同时也需要注意控制多重指标可能带来的滞后性风险。通过持续优化和改进,该策略有望在不同市场环境下保持稳定的表现。 ||
Overview
This strategy is a sophisticated multi-indicator trading system that combines multiple technical indicators including RSI, MACD, and Moving Averages (SMA) to identify trading opportunities through price trend and momentum analysis. The strategy uses the 200-day moving average to determine long-term trends, the 50-day moving average as a medium-term reference, and utilizes Stochastic RSI and MACD crossover signals to confirm trading opportunities.
Strategy Principles
The core logic is built on three main pillars:
- Trend Determination: Uses 200-day moving average to judge the main trend direction, with prices above the line indicating an uptrend and below indicating a downtrend.
- Momentum Confirmation: Uses Stochastic RSI (SRSI) %K and %D line crossovers to confirm price momentum, with %K crossing above %D indicating strengthening upward momentum.
- Trend Confirmation: Uses MACD indicator as a trend confirmation tool, with MACD line above signal line confirming uptrend.
Buy conditions must simultaneously satisfy:
- Price above 200-day moving average
- Stochastic RSI %K line crosses above %D line
- MACD line is above signal line
Sell conditions must simultaneously satisfy:
- Price below 200-day moving average
- Stochastic RSI %K line crosses below %D line
- MACD line is below signal line
Strategy Advantages
- Multiple Verification: Reduces false signal risk through the combined use of multiple technical indicators.
- Trend Following: Effectively captures major trends by combining long-term and medium-term moving averages.
- Momentum Identification: Uses Stochastic RSI to identify potential trend turning points earlier.
- Risk Control: Uses 50-day moving average as a stop-loss reference, providing clear exit mechanisms.
- Systematic Operation: Clear strategy logic, suitable for programmatic implementation and backtesting.
Strategy Risks
- Lag Risk: Moving averages are inherently lagging indicators, potentially causing delayed entry and exit timing.
- Oscillation Risk: Multiple indicators may produce confusing signals in sideways markets.
- False Breakout Risk: Price may quickly retreat after short-term breakouts above moving averages.
- Parameter Sensitivity: Multiple indicator parameters need optimization for different market environments.
- Signal Conflict: Different indicators may produce contradictory signals, increasing decision-making difficulty.
Strategy Optimization Directions
-
Indicator Parameter Optimization:
- Find optimal moving average periods through historical data backtesting
- Optimize Stochastic RSI parameters to adapt to different market volatilities
-
Signal Filtering:
- Add volume confirmation mechanism
- Introduce volatility indicators to adjust trading strategy during high volatility periods
-
Risk Management Improvements:
- Implement dynamic stop-loss mechanisms
- Adjust position sizes dynamically based on market volatility
-
Market Adaptability:
- Add market environment identification mechanisms
- Use different parameter settings under different market conditions
Summary
This is a systematic trend-following strategy that ensures trading reliability while providing clear risk control mechanisms through the combined use of multiple technical indicators. The strategy's main advantage lies in its multi-layer verification mechanism, but attention must be paid to controlling the lag risks that multiple indicators may bring. Through continuous optimization and improvement, this strategy has the potential to maintain stable performance across different market environments.[/trans]
Source (PineScript)
/*backtest
start: 2019-12-23 08:00:00
end: 2024-12-10 08:00:00
period: 1d
basePeriod: 1d
exchanges: [{"eid":"Futures_Binance","currency":"BTC_USDT"}]
*/

//@version=5
strategy("RSI and MACD by Karthik", overlay=true)

// Define periods for SMAs
sma50Period = 50
sma200Period = 200

// Calculate SMAs
sma50 = ta.sma(close, sma50Period)
sma200 = ta.sma(close, sma200Period)

// Plot SMAs on the main chart
plot(sma50, color=color.blue, title="50 Period SMA", linewidth=2)
plot(sma200, color=color.red, title="200 Period SMA", linewidth=2)

// Define and calculate parameters for Stochastic RSI
stochRSIPeriod = 14
rsi = ta.rsi(close, stochRSIPeriod)
stochRSIK = ta.stoch(rsi, rsi, stochRSIPeriod, 3)
stochRSID = ta.sma(stochRSIK, 3)

// Define and calculate parameters for MACD
macdShort = 12
macdLong = 26
macdSignal = 9
[macdLine, signalLine, macdHist] = ta.macd(close, macdShort, macdLong, macdSignal)

// Plot Stochastic RSI in a separate pane
hline(80, "Overbought", color=color.red, linewidth=1)
hline(20, "Oversold", color=color.green, linewidth=1)
plot(stochRSIK, color=color.blue, title="Stochastic RSI %K")
plot(stochRSID, color=color.red, title="Stochastic RSI %D")

// Plot MACD in a separate pane
hline(0, "Zero Line", color=color.gray, linewidth=1)
plot(macdHist, color=color.blue, title="MACD Histogram", style=plot.style_histogram)
plot(macdLine, color=color.red, title="MACD Line")
plot(signalLine, color=color.green, title="Signal Line")

// Conditions for buy and sell signals
isAbove200SMA = close > sma200
isStochRSIKAbove = stochRSIK > stochRSID
macdLineAbove = macdLine > signalLine
buySignal = isAbove200SMA and isStochRSIKAbove and macdLineAbove

isBelow200SMA = close < sma200
isStochRSIKBelow = stochRSIK < stochRSID
macdLineBelow = macdLine < signalLine
sellSignal = isBelow200SMA and isStochRSIKBelow and macdLineBelow

// Track the last signal with explicit type declaration
var string lastSignal = na

// Create series for plotting conditions
var bool plotBuySignal = na
var bool plotSellSignal = na
var bool plotExitBuySignal = na
var bool plotExitSellSignal = na

// Update plotting conditions based on signal and last signal
if buySignal and (lastSignal != "buy")
    plotBuySignal := true
    lastSignal := "buy"
else
    plotBuySignal := na

if sellSignal and (lastSignal != "sell")
    plotSellSignal := true
    lastSignal := "sell"
else
    plotSellSignal := na

// Update exit conditions based on SMA50
if lastSignal == "buy" and close < sma50
    plotExitBuySignal := true
    lastSignal := na // Clear lastSignal after exit
else
    plotExitBuySignal := na

if lastSignal == "sell" and close > sma50
    plotExitSellSignal := true
    lastSignal := na // Clear lastSignal after exit
else
    plotExitSellSignal := na

// Plot buy and sell signals on the main chart
plotshape(series=plotBuySignal, location=location.belowbar, color=color.green, style=shape.circle, size=size.small, title="Buy Signal")
plotshape(series=plotSellSignal, location=location.abovebar, color=color.red, style=shape.circle, size=size.small, title="Sell Signal")

// Plot exit signals for buy and sell
plotshape(series=plotExitBuySignal, location=location.belowbar, color=color.yellow, style=shape.xcross, size=size.small, title="Exit Buy Signal")
plotshape(series=plotExitSellSignal, location=location.abovebar, color=color.yellow, style=shape.xcross, size=size.small, title="Exit Sell Signal")


// Strategy to Backtest

long = buySignal
short = sellSignal

// Exit Conditions
exitBuy = close < sma50
exitSell = close > sma50


if (buySignal)
    strategy.entry("Long", strategy.long, 1.0)
if (sellSignal)
    strategy.entry("Short", strategy.short, 1.0)

strategy.close("Long", when=exitBuy)
strategy.close("Short", when=exitSell)
Detail
https://www.fmz.com/strategy/474860
Last Modified
2024-12-12 15:53:21