
12 KiB
Name
多重指标综合动量交易策略-Multi-Indicator-Comprehensive-Momentum-Trading-Strategy
Author
ChaoZhang
Strategy Description
[trans]
概述
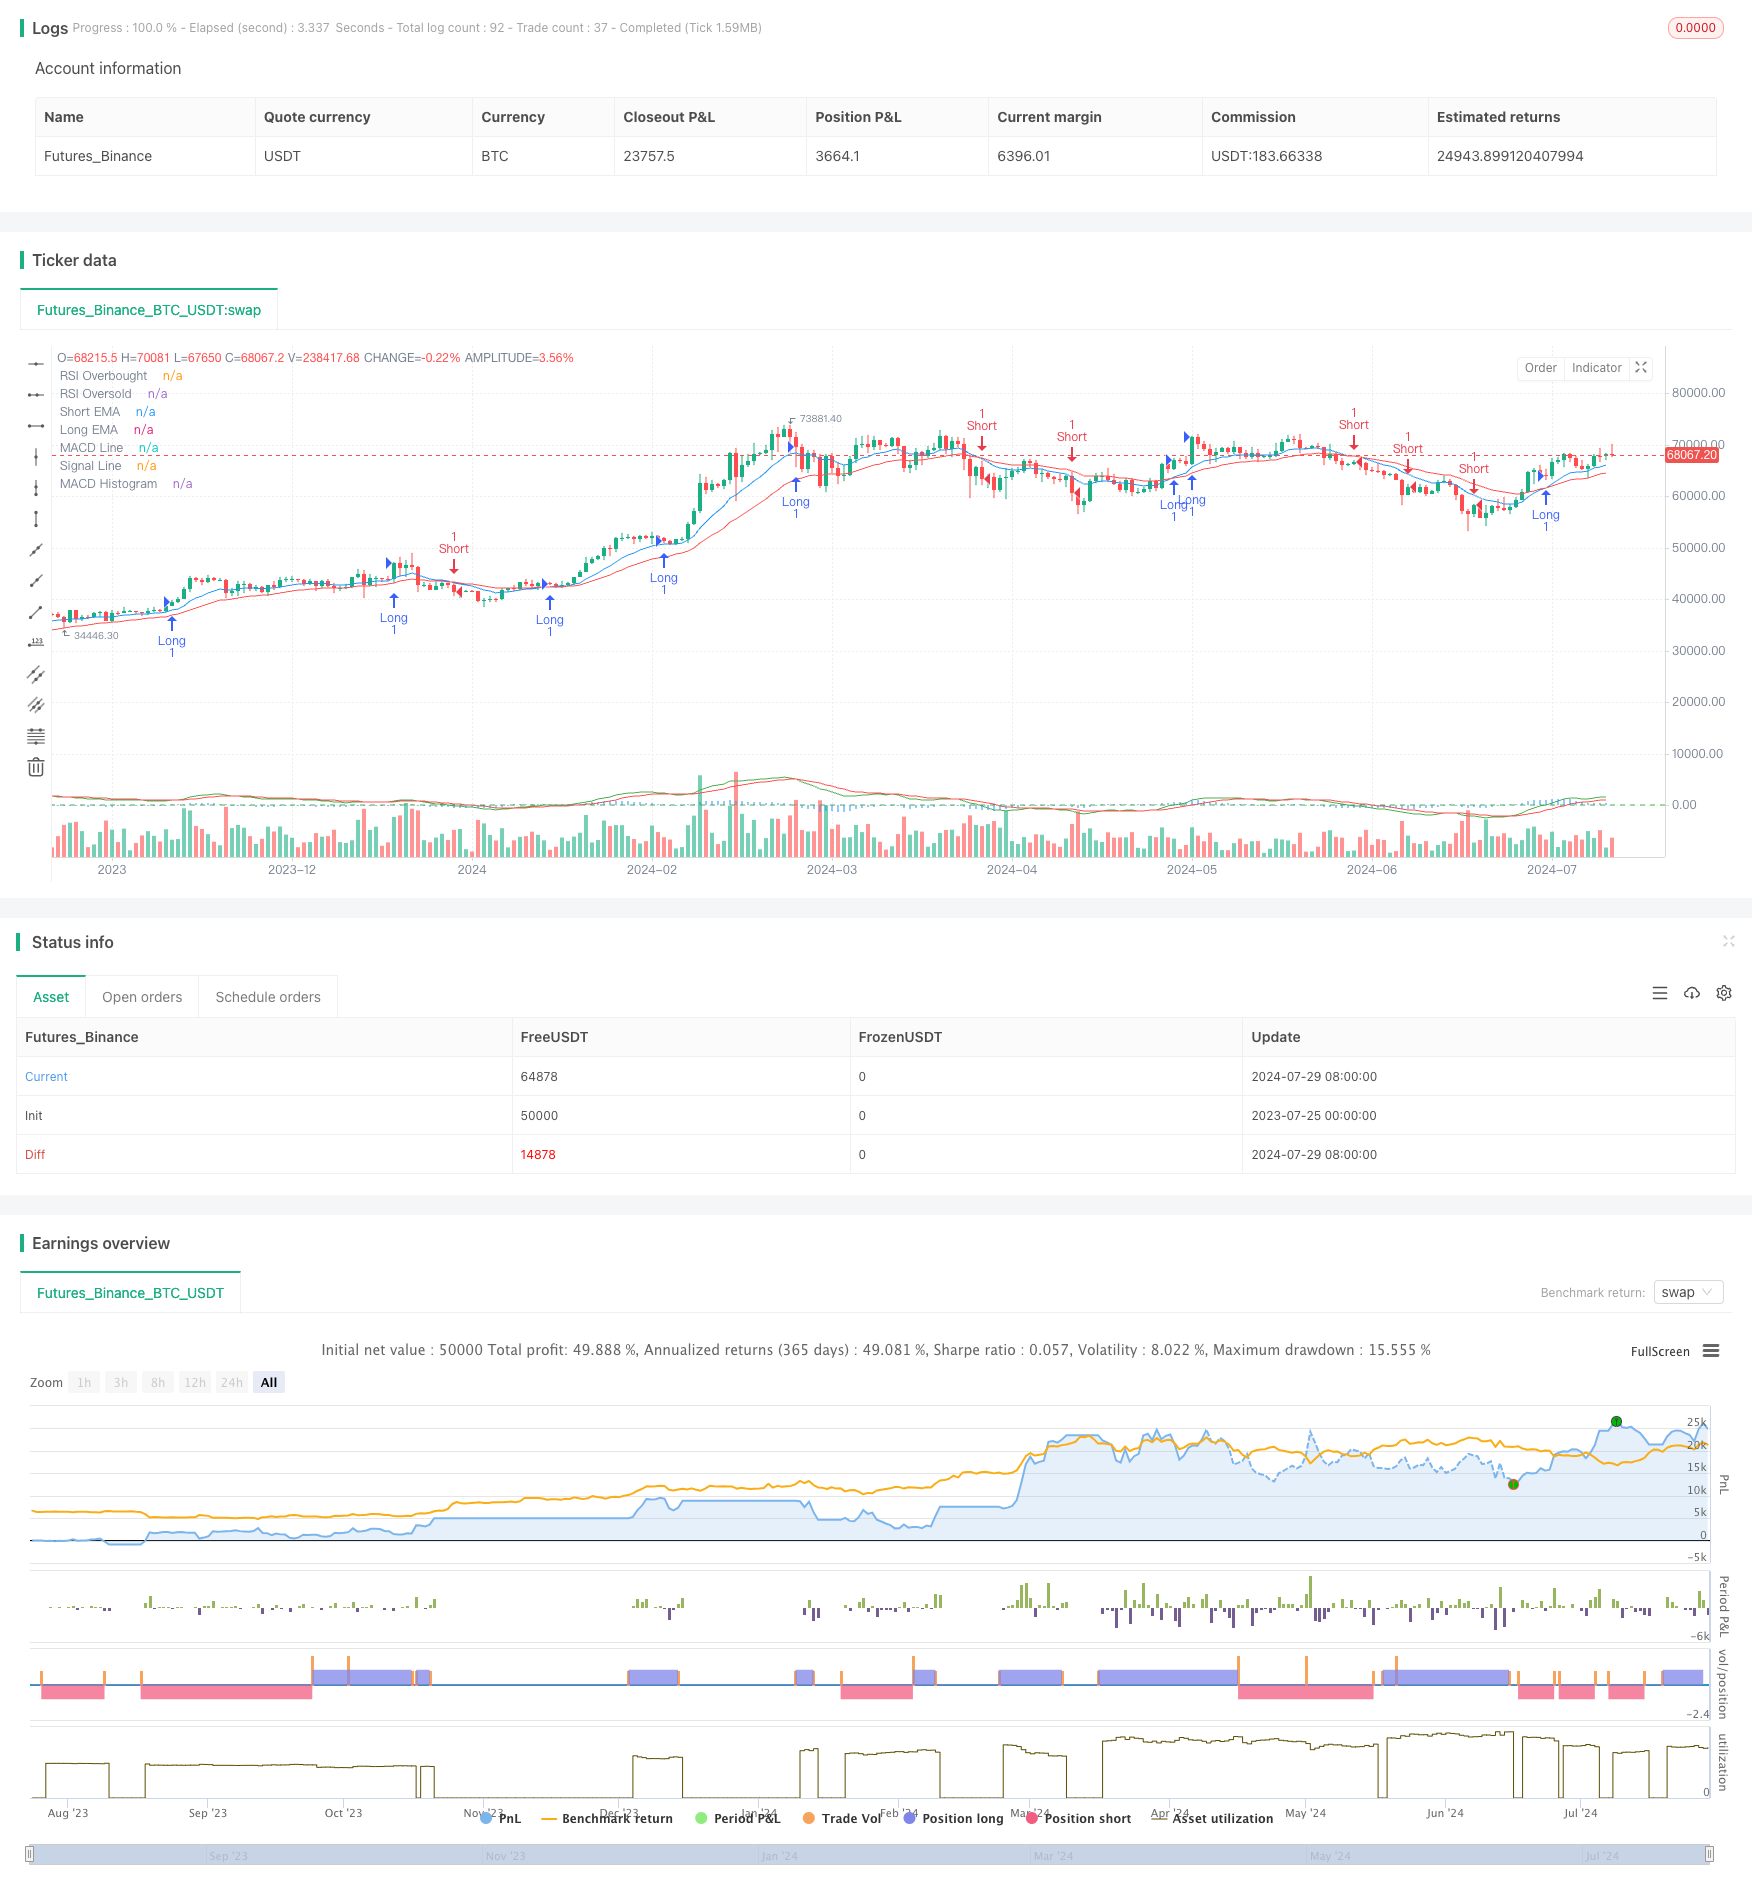
这个综合性的交易策略结合了多个技术指标,旨在捕捉市场趋势和动量。该策略利用指数移动平均线(EMA)来确定总体趋势方向,同时使用移动平均趋同散度指标(MACD)来识别动量变化和潜在的趋势反转。相对强弱指数(RSI)用于检测市场的超买和超卖状态,而平均真实波幅(ATR)则用于设置止损和获利目标。这种多层面的方法旨在提供一个全面的市场分析框架,以做出更加明智的交易决策。
策略原理
-
趋势确认:策略使用两条EMA(短期12周期和长期26周期)来确定市场趋势。当短期EMA高于长期EMA时,被视为上升趋势;反之则被视为下降趋势。
-
动量识别:MACD指标用于评估价格动量。当MACD线上穿信号线时,表示上升动量;当MACD线下穿信号线时,表示下降动量。
-
过度状态检测:RSI用于识别市场的超买(RSI>70)和超卖(RSI<30)状态,有助于判断可能的价格反转点。
-
风险管理:ATR用于动态设置止损和获利目标。策略使用1.5倍的ATR值来确定这些水平,以适应市场波动性。
-
交易信号生成:
- 做多条件:短期EMA>长期EMA,MACD线>信号线,RSI<70
- 做空条件:短期EMA<长期EMA,MACD线<信号线,RSI>30
-
头寸管理:策略使用初始资金的10%进行每次交易,并设置基于ATR的止损和获利目标。
策略优势
-
多指标综合分析:通过结合多个技术指标,策略能够从不同角度分析市场,提高交易决策的准确性。
-
趋势跟踪与动量结合:EMA和MACD的组合既能捕捉长期趋势,又能识别短期动量变化,有利于及时进出市场。
-
过滤虚假信号:RSI的使用有助于避免在极端市场条件下进行交易,减少假突破带来的损失。
-
动态风险管理:基于ATR的止损和获利目标设置,能够根据市场波动性自动调整,提高风险管理的灵活性。
-
资金管理:使用资金百分比进行交易,而非固定合约数量,有助于更好地控制风险敞口。
-
可视化支持:策略在图表上绘制了主要指标,方便交易者直观地分析市场状况。
策略风险
-
过度依赖技术指标:多个指标的使用可能导致信号冲突或过度分析,有时会错过重要的交易机会。
-
滞后性:EMA和MACD等指标本质上是滞后的,可能在快速变化的市场中反应不够及时。
-
频繁交易:多重条件可能导致频繁的交易信号,增加交易成本并可能降低整体收益。
-
市场噪音:在横盘或低波动性市场中,策略可能产生大量虚假信号。
-
固定参数风险:使用固定的指标参数可能不适用于所有市场条件,需要定期优化。
-
忽视基本面因素:纯技术分析方法可能忽视重要的基本面和宏观经济因素。
策略优化方向
-
参数优化:可以使用历史数据回测不同的EMA、MACD、RSI和ATR参数组合,找出最优设置。
-
增加过滤条件:考虑加入成交量指标或波动率指标,以进一步确认交易信号的有效性。
-
自适应参数:实现指标参数的动态调整,以适应不同的市场环境和波动状况。
-
加入基本面分析:结合市场情绪指标或经济数据发布日历,优化入场和出场时机。
-
优化头寸管理:实现基于账户规模和市场波动性的动态头寸sizing策略。
-
增加时间过滤:考虑加入交易时间窗口限制,避免在波动性较大或流动性较低的时段交易。
-
机器学习整合:利用机器学习算法优化指标组合和权重,提高策略的适应性。
总结
这个多重指标综合动量交易策略通过结合EMA、MACD、RSI和ATR,提供了一个全面的市场分析框架。它旨在捕捉趋势、识别动量变化、避免过度交易并管理风险。策略的优势在于其多维度分析和动态风险管理,但也面临过度依赖技术指标和潜在滞后性等风险。未来的优化方向可以集中在参数调优、增加过滤条件、引入自适应机制以及整合更多元的分析方法上。总的来说,这是一个结构良好的量化交易策略基础,通过持续改进和优化,有潜力成为一个强大的交易系统。
||
Overview
This comprehensive trading strategy combines multiple technical indicators to capture market trends and momentum. The strategy utilizes Exponential Moving Averages (EMA) to determine overall trend direction, while employing the Moving Average Convergence Divergence (MACD) indicator to identify momentum changes and potential trend reversals. The Relative Strength Index (RSI) is used to detect overbought and oversold market conditions, while the Average True Range (ATR) is utilized for setting stop-loss and take-profit levels. This multi-faceted approach aims to provide a comprehensive framework for market analysis to make more informed trading decisions.
Strategy Principles
-
Trend Confirmation: The strategy uses two EMAs (short-term 12-period and long-term 26-period) to determine market trend. A bullish trend is identified when the short-term EMA is above the long-term EMA, and vice versa for a bearish trend.
-
Momentum Identification: The MACD indicator is used to assess price momentum. An upward momentum is signaled when the MACD line crosses above the signal line, while a downward momentum is indicated by the opposite.
-
Extreme Condition Detection: RSI is used to identify overbought (RSI>70) and oversold (RSI<30) market conditions, helping to gauge potential price reversal points.
-
Risk Management: ATR is used to dynamically set stop-loss and take-profit levels. The strategy uses 1.5 times the ATR value to determine these levels, adapting to market volatility.
-
Trade Signal Generation:
- Long Condition: Short-term EMA > Long-term EMA, MACD line > Signal line, RSI < 70
- Short Condition: Short-term EMA < Long-term EMA, MACD line < Signal line, RSI > 30
-
Position Management: The strategy uses 10% of the initial capital for each trade and sets ATR-based stop-loss and take-profit targets.
Strategy Advantages
-
Multi-Indicator Comprehensive Analysis: By combining multiple technical indicators, the strategy can analyze the market from different angles, improving the accuracy of trading decisions.
-
Trend Following and Momentum Combination: The combination of EMA and MACD allows for capturing long-term trends while identifying short-term momentum changes, facilitating timely market entry and exit.
-
False Signal Filtering: The use of RSI helps avoid trading in extreme market conditions, reducing losses from false breakouts.
-
Dynamic Risk Management: ATR-based stop-loss and take-profit target setting automatically adjusts to market volatility, enhancing risk management flexibility.
-
Capital Management: Using a percentage of funds for trading, rather than a fixed number of contracts, helps better control risk exposure.
-
Visual Support: The strategy plots major indicators on the chart, allowing traders to intuitively analyze market conditions.
Strategy Risks
-
Over-reliance on Technical Indicators: The use of multiple indicators may lead to conflicting signals or over-analysis, sometimes missing important trading opportunities.
-
Lagging Nature: Indicators like EMA and MACD are inherently lagging, potentially not reacting quickly enough in rapidly changing markets.
-
Frequent Trading: Multiple conditions may lead to frequent trading signals, increasing transaction costs and potentially reducing overall returns.
-
Market Noise: In ranging or low-volatility markets, the strategy may generate numerous false signals.
-
Fixed Parameter Risk: Using fixed indicator parameters may not be suitable for all market conditions, requiring periodic optimization.
-
Neglecting Fundamental Factors: A purely technical analysis approach may overlook important fundamental and macroeconomic factors.
Strategy Optimization Directions
-
Parameter Optimization: Historical data backtesting can be used to find optimal settings for EMA, MACD, RSI, and ATR parameter combinations.
-
Additional Filtering Conditions: Consider adding volume or volatility indicators to further confirm the validity of trading signals.
-
Adaptive Parameters: Implement dynamic adjustment of indicator parameters to adapt to different market environments and volatility conditions.
-
Incorporation of Fundamental Analysis: Combine market sentiment indicators or economic data release calendars to optimize entry and exit timing.
-
Position Management Optimization: Implement a dynamic position sizing strategy based on account size and market volatility.
-
Time Filtering: Consider adding trading time window restrictions to avoid trading during highly volatile or low liquidity periods.
-
Machine Learning Integration: Utilize machine learning algorithms to optimize indicator combinations and weights, improving strategy adaptability.
Summary
This multi-indicator comprehensive momentum trading strategy provides a comprehensive market analysis framework by combining EMA, MACD, RSI, and ATR. It aims to capture trends, identify momentum changes, avoid overtrading, and manage risks. The strategy's strengths lie in its multidimensional analysis and dynamic risk management, but it also faces risks such as over-reliance on technical indicators and potential lag. Future optimization directions can focus on parameter tuning, adding filtering conditions, introducing adaptive mechanisms, and integrating more diverse analytical methods. Overall, this is a well-structured quantitative trading strategy foundation that has the potential to become a powerful trading system through continuous improvement and optimization.
[/trans]
Source (PineScript)
/*backtest
start: 2023-07-25 00:00:00
end: 2024-07-30 00:00:00
period: 1d
basePeriod: 1h
exchanges: [{"eid":"Futures_Binance","currency":"BTC_USDT"}]
*/

//@version=5
strategy("Bank Nifty Comprehensive Strategy", overlay=true)

// Inputs
emaShortLength = input.int(12, minval=1, title="Short EMA Length")
emaLongLength = input.int(26, minval=1, title="Long EMA Length")
macdFastLength = input.int(12, minval=1, title="MACD Fast Length")
macdSlowLength = input.int(26, minval=1, title="MACD Slow Length")
macdSignalSmoothing = input.int(9, minval=1, title="MACD Signal Smoothing")
rsiLength = input.int(14, title="RSI Length")
rsiOverbought = input.int(70, title="RSI Overbought Level")
rsiOversold = input.int(30, title="RSI Oversold Level")
atrLength = input.int(14, title="ATR Length")
atrMultiplier = input.float(1.5, title="ATR Multiplier")

// EMA Calculation
emaShort = ta.ema(close, emaShortLength)
emaLong = ta.ema(close, emaLongLength)

// MACD Calculation
[macdLine, signalLine, _] = ta.macd(close, macdFastLength, macdSlowLength, macdSignalSmoothing)
macdHist = macdLine - signalLine

// RSI Calculation
rsi = ta.rsi(close, rsiLength)

// ATR Calculation
atr = ta.atr(atrLength)

// Trading Conditions
longCondition = emaShort > emaLong and macdLine > signalLine and rsi < rsiOverbought
shortCondition = emaShort < emaLong and macdLine < signalLine and rsi > rsiOversold

// Trade Execution with Risk Management
if (longCondition)
    strategy.entry("Long", strategy.long)
    strategy.exit("Take Profit/Stop Loss", from_entry="Long", limit=close + atr * atrMultiplier, stop=close - atr * atrMultiplier)

if (shortCondition)
    strategy.entry("Short", strategy.short)
    strategy.exit("Take Profit/Stop Loss", from_entry="Short", limit=close - atr * atrMultiplier, stop=close + atr * atrMultiplier)

// Plot Indicators
plot(emaShort, title="Short EMA", color=color.blue)
plot(emaLong, title="Long EMA", color=color.red)
hline(rsiOverbought, "RSI Overbought", color=color.red)
hline(rsiOversold, "RSI Oversold", color=color.green)
plot(macdLine, title="MACD Line", color=color.green)
plot(signalLine, title="Signal Line", color=color.red)
plot(macdHist, title="MACD Histogram", color=color.blue, style=plot.style_histogram)
Detail
https://www.fmz.com/strategy/458255
Last Modified
2024-07-31 12:01:10