
8.0 KiB
Name
多重指标动态追踪止损交易策略-Multi-Indicator-Dynamic-Trailing-Stop-Trading-Strategy
Author
ChaoZhang
Strategy Description
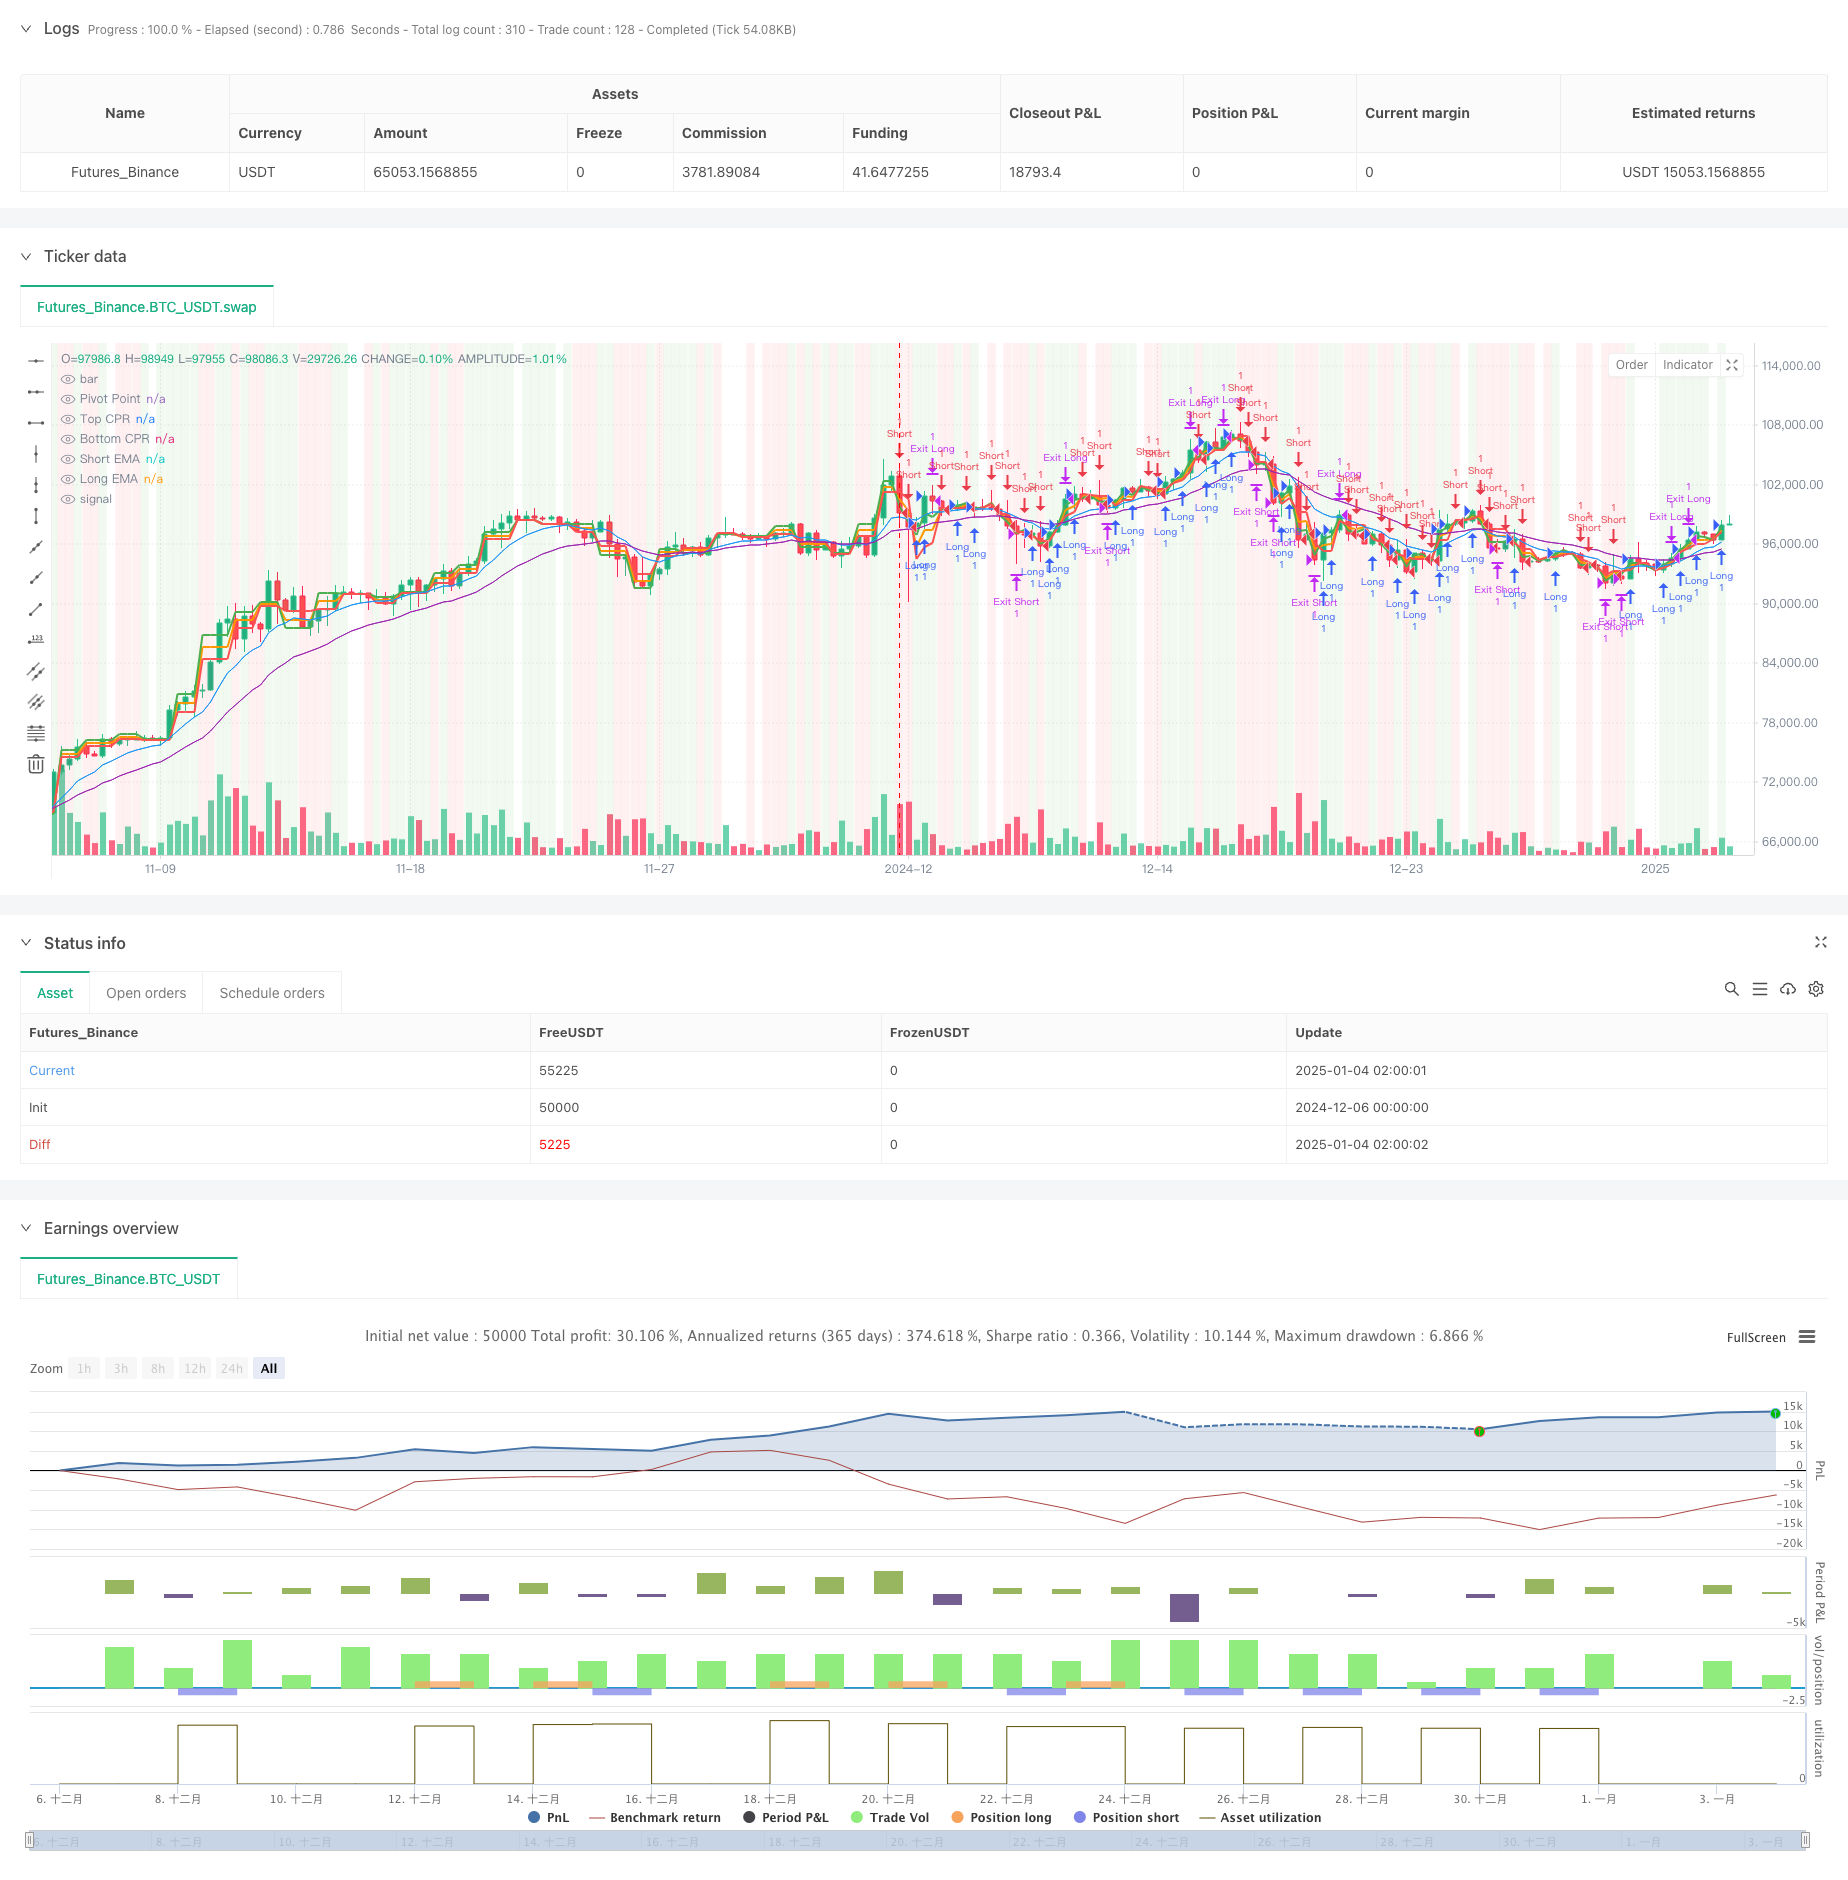
[trans]
概述
该策略是一个结合了中枢点参考(CPR)、指数移动平均线(EMA)、相对强弱指标(RSI)和突破逻辑的综合交易系统。策略采用ATR动态追踪止损机制,通过多重技术指标的协同配合来识别市场趋势和交易机会,并实现风险的动态管理。该策略适用于日内和中短期交易,具有较强的适应性和风险控制能力。
策略原理
策略主要基于以下几个核心组件:
- CPR指标用于确定关键支撑阻力位,计算日度周期的枢轴点、上轨和下轨。
- 双EMA系统(9日和21日)用于判断趋势方向,通过金叉死叉产生交易信号。
- RSI指标(14日)用于确认市场超买超卖状态,并作为交易过滤器。
- 突破逻辑结合价格对枢轴点的突破来确认交易信号。
- ATR指标用于设置动态追踪止损,根据市场波动性自适应调整止损距离。
策略优势
- 多重技术指标的综合运用提高了信号的可靠性。
- 动态追踪止损机制能够有效锁定利润并控制风险。
- CPR指标提供了重要的价格参考位,有助于准确定位市场结构。
- 策略具有良好的适应性,可以根据不同市场条件调整参数。
- RSI过滤器和突破确认增强了交易信号的质量。
策略风险
- 多重指标可能在震荡市场产生滞后和假信号。
- 追踪止损可能在高波动期间被过早触发。
- 参数优化需要考虑市场特征,不当的参数设置可能影响策略表现。
- 信号冲突时可能影响决策的准确性。
策略优化方向
- 引入成交量指标来确认价格突破的有效性。
- 增加趋势强度过滤器,提高趋势跟踪的准确性。
- 优化止损参数的动态调整机制,提高防护效果。
- 添加市场波动率自适应机制,动态调整交易参数。
- 考虑加入情绪指标,提升市场时机判断。
总结
该策略通过多重技术指标的协同作用,构建了一个较为完整的交易系统。动态止损机制和多维度的信号确认提供了较好的风险收益特征。策略的优化空间主要在于信号质量的提升和风险管理的完善。通过持续优化和调整,该策略有望在不同市场环境下保持稳定的表现。
||
Overview
This strategy is a comprehensive trading system that combines Central Pivot Range (CPR), Exponential Moving Average (EMA), Relative Strength Index (RSI), and breakout logic. The strategy employs an ATR-based dynamic trailing stop-loss mechanism, utilizing multiple technical indicators to identify market trends and trading opportunities while implementing dynamic risk management. It is suitable for intraday and medium-term trading, offering strong adaptability and risk control capabilities.
Strategy Principles
The strategy is based on several core components:
- CPR indicator for determining key support and resistance levels, calculating daily pivot points, top and bottom levels.
- Dual EMA system (9-day and 21-day) for trend direction identification through crossovers.
- RSI indicator (14-day) for confirming overbought/oversold conditions and signal filtering.
- Breakout logic incorporating price breaks of pivot points for signal confirmation.
- ATR indicator for dynamic trailing stop-loss, adaptively adjusting stop distances based on market volatility.
Strategy Advantages
- Integration of multiple technical indicators enhances signal reliability.
- Dynamic trailing stop-loss mechanism effectively locks in profits and controls risk.
- CPR indicator provides important price reference points for accurate market structure positioning.
- Strategy demonstrates good adaptability with adjustable parameters for different market conditions.
- RSI filter and breakout confirmation strengthen trading signal quality.
Strategy Risks
- Multiple indicators may generate lagging and false signals in choppy markets.
- Trailing stops might be triggered prematurely during high volatility periods.
- Parameter optimization requires consideration of market characteristics; improper settings may affect strategy performance.
- Signal conflicts may impact decision accuracy.
Strategy Optimization Directions
- Incorporate volume indicators to confirm price breakout validity.
- Add trend strength filters to improve trend following accuracy.
- Optimize dynamic adjustment mechanism for stop-loss parameters to enhance protection.
- Implement market volatility adaptation mechanism for dynamic parameter adjustment.
- Consider adding sentiment indicators to improve market timing.
Summary
The strategy constructs a comprehensive trading system through the synergistic effect of multiple technical indicators. The dynamic stop-loss mechanism and multi-dimensional signal confirmation provide favorable risk-reward characteristics. Strategy optimization potential mainly lies in improving signal quality and refining risk management. Through continuous optimization and adjustment, the strategy shows promise in maintaining stable performance across various market conditions. [/trans]
Source (PineScript)
/*backtest
start: 2024-12-06 00:00:00
end: 2025-01-04 08:00:00
period: 7h
basePeriod: 7h
exchanges: [{"eid":"Futures_Binance","currency":"BTC_USDT"}]
*/

//@version=6
strategy("Enhanced CPR + EMA + RSI + Breakout Strategy", overlay=true)

// Inputs
ema_short = input(9, title="Short EMA Period")
ema_long = input(21, title="Long EMA Period")
cpr_lookback = input.timeframe("D", title="CPR Timeframe")
atr_multiplier = input.float(1.5, title="ATR Multiplier")
rsi_period = input(14, title="RSI Period")
rsi_overbought = input(70, title="RSI Overbought Level")
rsi_oversold = input(30, title="RSI Oversold Level")
breakout_buffer = input.float(0.001, title="Breakout Buffer (in %)")

// Calculate EMAs
short_ema = ta.ema(close, ema_short)
long_ema = ta.ema(close, ema_long)

// Request Daily Data for CPR Calculation
high_cpr = request.security(syminfo.tickerid, cpr_lookback, high)
low_cpr = request.security(syminfo.tickerid, cpr_lookback, low)
close_cpr = request.security(syminfo.tickerid, cpr_lookback, close)

// CPR Levels
pivot = (high_cpr + low_cpr + close_cpr) / 3
bc = (high_cpr + low_cpr) / 2
tc = pivot + (pivot - bc)

// ATR for Stop-Loss and Take-Profit
atr = ta.atr(14)

// RSI Calculation
rsi = ta.rsi(close, rsi_period)

// Entry Conditions with RSI Filter and Breakout Logic
long_condition = ((close > tc) and (ta.crossover(short_ema, long_ema)) and (rsi > 50 and rsi < rsi_overbought)) or (rsi > 80) or (close > (pivot + pivot * breakout_buffer))
short_condition = ((close < bc) and (ta.crossunder(short_ema, long_ema)) and (rsi < 50 and rsi > rsi_oversold)) or (rsi < 20) or (close < (pivot - pivot * breakout_buffer))

// Dynamic Exit Logic
long_exit = short_condition
short_exit = long_condition

// Trailing Stop-Loss Implementation
if long_condition
    strategy.entry("Long", strategy.long)
    strategy.exit("Exit Long", from_entry="Long",
                  trail_points=atr * atr_multiplier,
                  trail_offset=atr * atr_multiplier / 2)

if short_condition
    strategy.entry("Short", strategy.short)
    strategy.exit("Exit Short", from_entry="Short",
                  trail_points=atr * atr_multiplier,
                  trail_offset=atr * atr_multiplier / 2)

// Plot CPR Levels and EMAs
plot(pivot, title="Pivot Point", color=color.orange, linewidth=2)
plot(tc, title="Top CPR", color=color.green, linewidth=2)
plot(bc, title="Bottom CPR", color=color.red, linewidth=2)
plot(short_ema, title="Short EMA", color=color.blue, linewidth=1)
plot(long_ema, title="Long EMA", color=color.purple, linewidth=1)

// Highlight Buy and Sell Signals
bgcolor(long_condition ? color.new(color.green, 90) : na, title="Buy Signal Highlight")
bgcolor(short_condition ? color.new(color.red, 90) : na, title="Sell Signal Highlight")
Detail
https://www.fmz.com/strategy/477534
Last Modified
2025-01-06 11:51:53