
7.7 KiB
Name
多重指标交叉动态策略系统基于EMARVI和交易信号的量化交易模型-Multi-Indicator-Crossover-Dynamic-Strategy-System-A-Quantitative-Trading-Model-Based-on-EMA-RVI-and-Trading-Signals
Author
ChaoZhang
Strategy Description
[trans]
概述
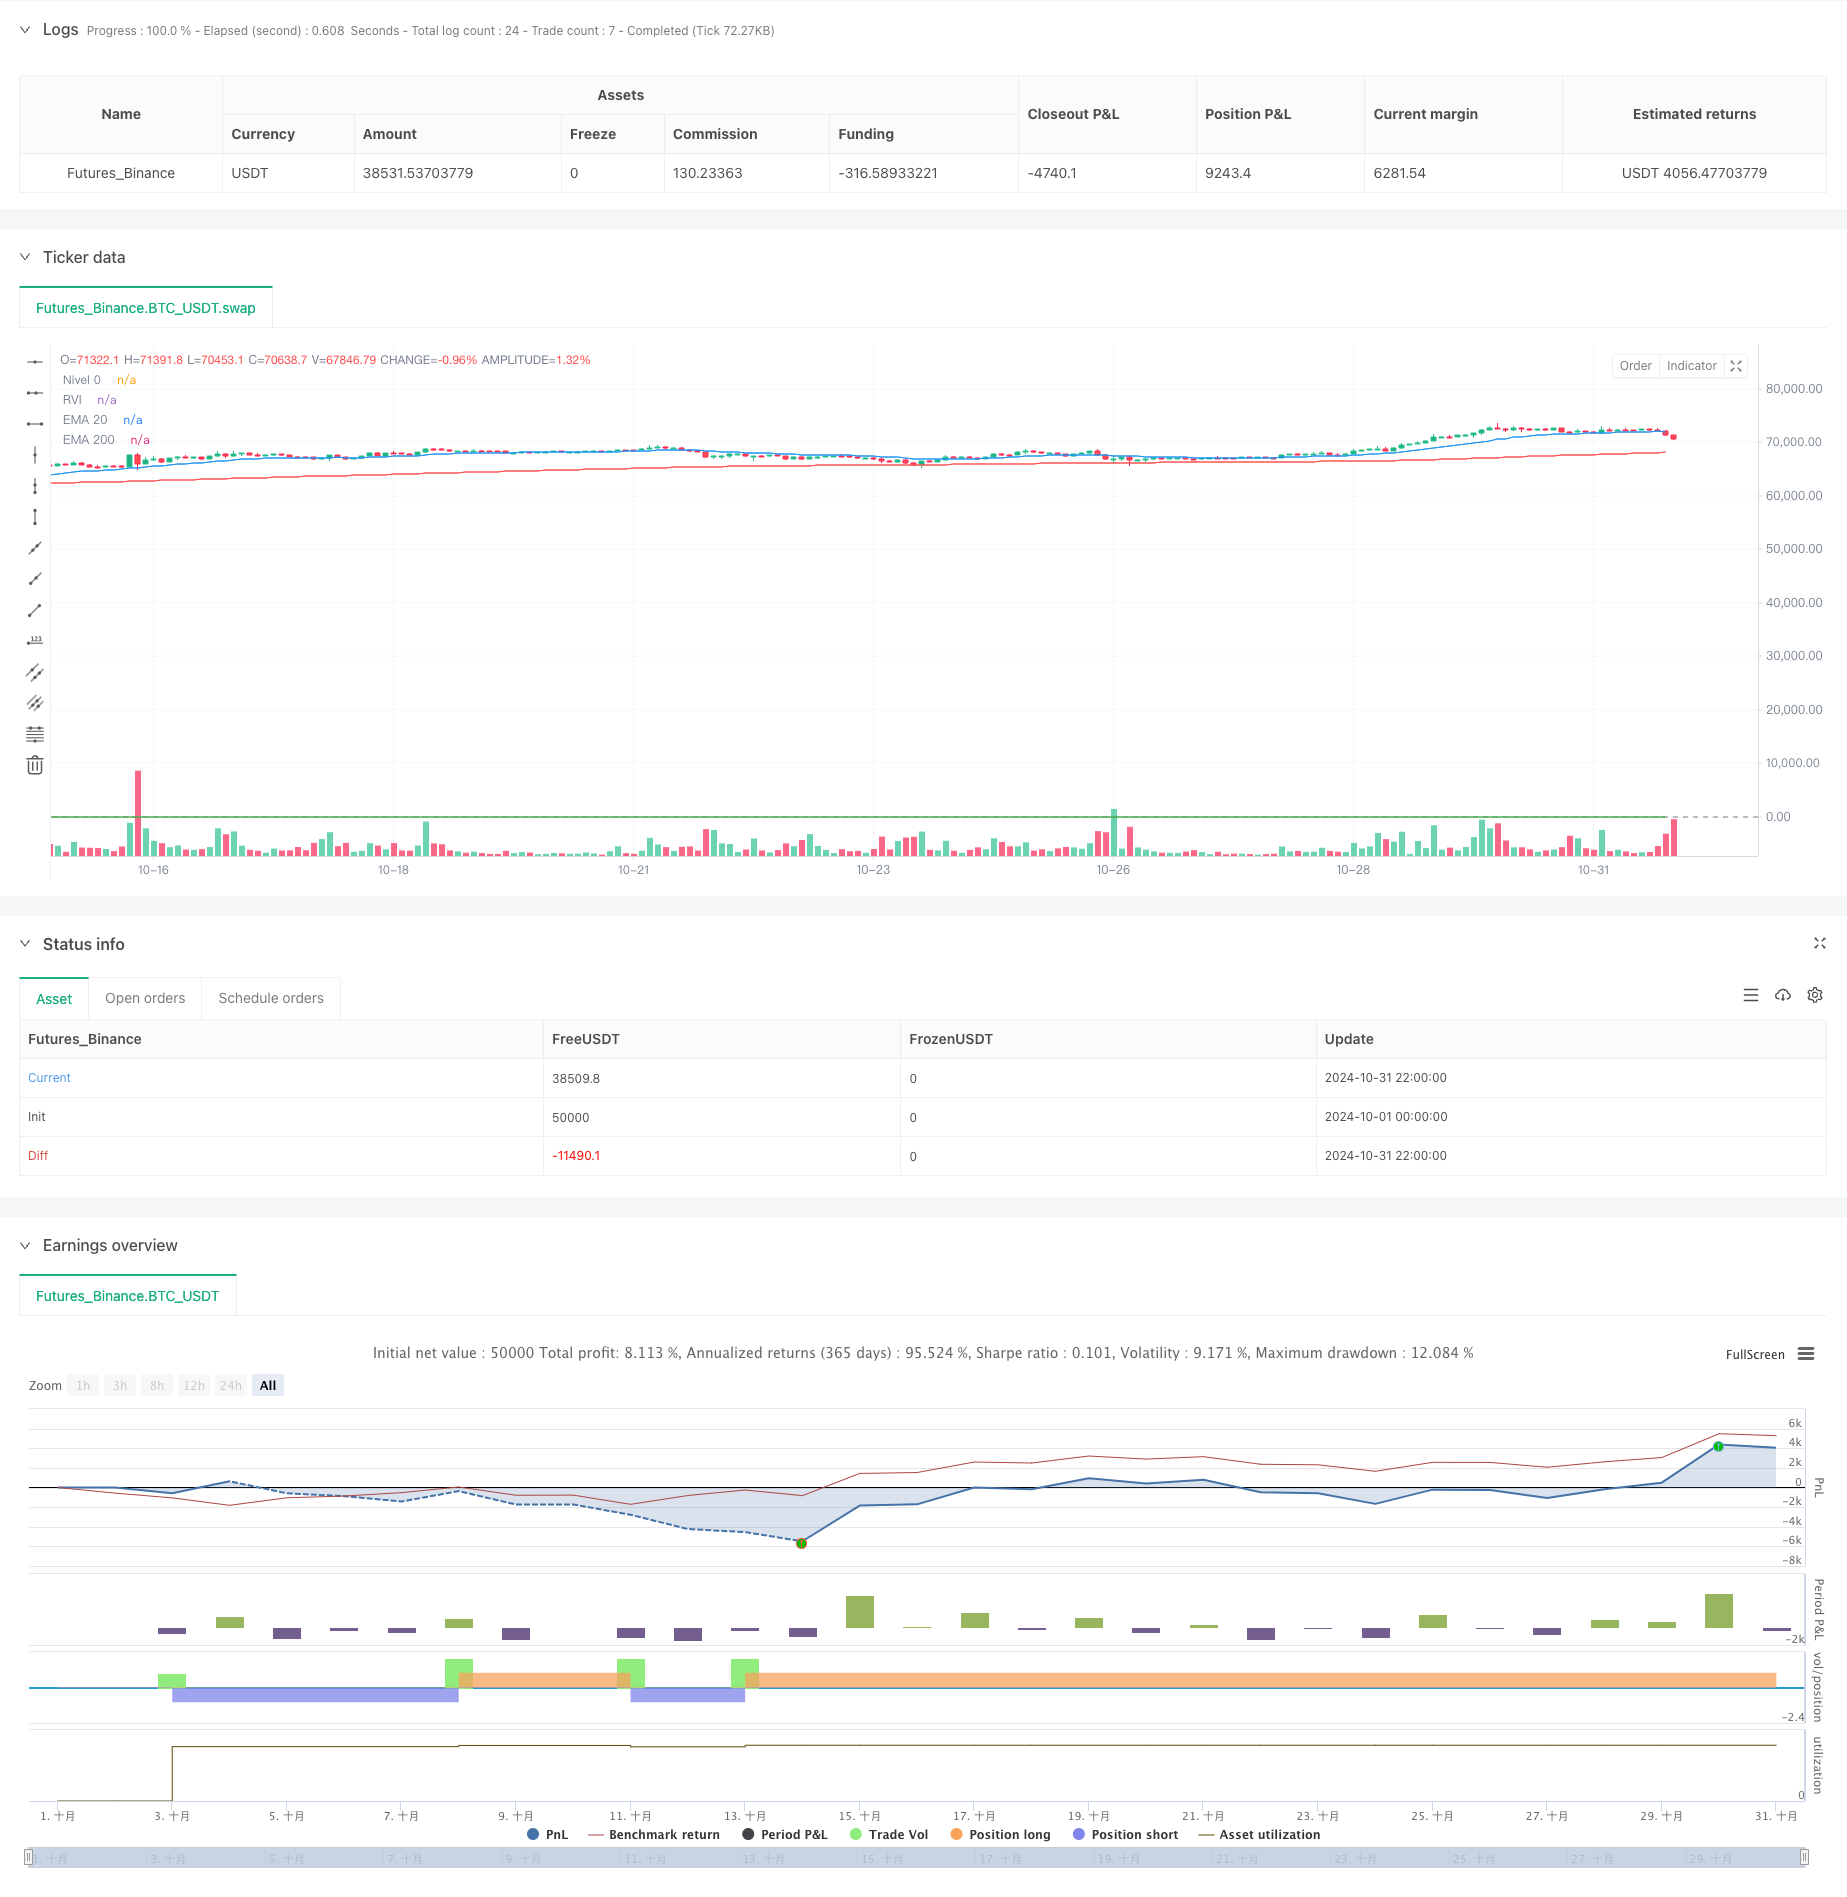
该策略是一个基于多重技术指标的量化交易系统,结合了指数移动平均线(EMA)、相对波动指数(RVI)和自定义交易信号进行交易决策。系统采用动态止损和获利目标,通过ATR指标进行风险管理,实现了一个全面的交易策略框架。
策略原理
策略主要依靠三个核心组件做出交易决策:
- 双均线系统:使用20周期和200周期的EMA,通过均线交叉判断市场趋势
- RVI指标:用于确认市场波动方向,提供额外的交易确认信号
- 自定义信号:整合外部交易信号,为交易决策提供第三重确认 系统在以下条件同时满足时进入多头:
- EMA20上穿EMA200
- RVI为正值
- 收到做多信号 空头条件相反。同时,系统使用基于ATR的动态止损和获利目标来管理风险。
策略优势
- 多重确认机制:通过多个独立指标的综合分析降低虚假信号
- 动态风险管理:基于ATR的止损设置能够适应市场波动
- 灵活的资金管理:采用基于现金的头寸规模计算
- 可视化支持:完整的图形界面支持,便于分析和优化
- 模块化设计:各组件独立,便于维护和优化
策略风险
- 均线滞后性:EMA指标本质上是滞后指标,可能导致入场延迟
- 信号依赖:过度依赖多重信号可能导致错过部分交易机会
- 市场适应性:在震荡市场中可能产生频繁的虚假信号
- 参数敏感性:多个指标参数需要精确调优,增加了优化难度 建议通过回测不同市场环境来优化参数,并考虑添加市场环境过滤器。
策略优化方向
- 市场环境识别:添加市场状态判断模块,在不同市场环境使用不同参数
- 动态参数调整:根据市场波动率自动调整EMA和RVI的周期
- 信号权重系统:为不同指标设置动态权重,提高系统适应性
- 止损优化:考虑添加移动止损,更好地保护利润
- 头寸管理:实现更复杂的头寸管理策略,如金字塔加仓
总结
该策略通过综合运用多个技术指标和风险管理工具,构建了一个相对完整的交易系统。虽然存在一些固有的局限性,但通过建议的优化方向,系统有望获得更好的表现。关键是要在实盘中持续监控和调整,确保策略在不同市场环境中都能保持稳定性。 ||
Overview
This strategy is a quantitative trading system based on multiple technical indicators, combining Exponential Moving Averages (EMA), Relative Volatility Index (RVI), and custom trading signals for decision-making. The system employs dynamic stop-loss and take-profit targets using the ATR indicator for risk management, creating a comprehensive trading strategy framework.
Strategy Principles
The strategy relies on three core components for trading decisions:
- Dual EMA System: Uses 20-period and 200-period EMAs to determine market trends through crossovers
- RVI Indicator: Confirms market volatility direction and provides additional trading confirmation
- Custom Signals: Integrates external trading signals for tertiary confirmation The system enters long positions when:
- EMA20 crosses above EMA200
- RVI is positive
- Receives a buy signal Short conditions are reversed. Additionally, the system uses ATR-based dynamic stop-loss and take-profit targets for risk management.
Strategy Advantages
- Multiple Confirmation Mechanism: Reduces false signals through multiple independent indicator analysis
- Dynamic Risk Management: ATR-based stop-loss adapts to market volatility
- Flexible Capital Management: Uses cash-based position sizing
- Visual Support: Complete graphical interface for analysis and optimization
- Modular Design: Independent components for easy maintenance and optimization
Strategy Risks
- EMA Lag: EMAs are inherently lagging indicators, potentially causing delayed entries
- Signal Dependency: Over-reliance on multiple signals may cause missed opportunities
- Market Adaptability: May generate frequent false signals in ranging markets
- Parameter Sensitivity: Multiple indicator parameters require precise tuning Recommend backtesting across different market conditions and considering market environment filters.
Optimization Directions
- Market Environment Recognition: Add market state detection module for parameter adjustment
- Dynamic Parameter Adjustment: Automatically adjust EMA and RVI periods based on volatility
- Signal Weighting System: Implement dynamic weights for different indicators
- Stop-Loss Optimization: Consider adding trailing stops for better profit protection
- Position Management: Implement more sophisticated position management strategies
Summary
The strategy builds a relatively complete trading system through the comprehensive use of multiple technical indicators and risk management tools. While there are some inherent limitations, the system shows promise for improved performance through the suggested optimizations. The key is continuous monitoring and adjustment in live trading to ensure strategy stability across different market conditions.[/trans]
Source (PineScript)
/*backtest
start: 2024-10-01 00:00:00
end: 2024-10-31 23:59:59
period: 2h
basePeriod: 2h
exchanges: [{"eid":"Futures_Binance","currency":"BTC_USDT"}]
*/

//@version=5
strategy("Gold Bot with Viamanchu, EMA20/200, and RVI - 3min", overlay=true)

// Parámetros de las EMAs
ema20 = ta.ema(close, 20)
ema200 = ta.ema(close, 200)

// Relative Volatility Index (RVI)
rvi_length = input(14, title="RVI Length")
rvi = ta.rma(close - close[1], rvi_length) / ta.rma(math.abs(close - close[1]), rvi_length)

// Simulación de Viamanchu (aleatoria para demo, se debe reemplazar por señal de Viamanchu real)
var int seed = time
simulated_vi_manchu_signal = math.random() > 0.5 ? 1 : -1  // 1 para compra, -1 para venta (puedes sustituir por la lógica de Viamanchu)

// Gestión de riesgos: Stop Loss y Take Profit usando ATR
atr_length = input(14, title="ATR Length")
atr = ta.atr(atr_length)
atr_multiplier = input.float(1.5, title="ATR Multiplier for Stop Loss/Take Profit")
stop_loss_level = strategy.position_avg_price - (atr * atr_multiplier)
take_profit_level = strategy.position_avg_price + (atr * atr_multiplier)

// Condiciones de entrada
longCondition = ta.crossover(ema20, ema200) and rvi > 0 and simulated_vi_manchu_signal == 1
shortCondition = ta.crossunder(ema20, ema200) and rvi < 0 and simulated_vi_manchu_signal == -1

// Ejecutar compra (long)
if (longCondition)
    strategy.entry("Compra", strategy.long, stop=stop_loss_level, limit=take_profit_level)

// Ejecutar venta (short)
if (shortCondition)
    strategy.entry("Venta", strategy.short, stop=stop_loss_level, limit=take_profit_level)

// Visualización de las condiciones de entrada en el gráfico
plotshape(series=longCondition, title="Compra señal", location=location.belowbar, color=color.green, style=shape.labelup, text="BUY")
plotshape(series=shortCondition, title="Venta señal", location=location.abovebar, color=color.red, style=shape.labeldown, text="SELL")

// Visualización de las EMAs en el gráfico
plot(ema20, color=color.blue, title="EMA 20")
plot(ema200, color=color.red, title="EMA 200")

// Visualización del RVI en el gráfico
plot(rvi, color=color.green, title="RVI")
hline(0, "Nivel 0", color=color.gray)
Detail
https://www.fmz.com/strategy/471705
Last Modified
2024-11-12 15:58:01