
11 KiB
Name
多重指数移动平均线交叉动量策略-Multi-EMA-Crossover-Momentum-Strategy
Author
ChaoZhang
Strategy Description
[trans]
概述
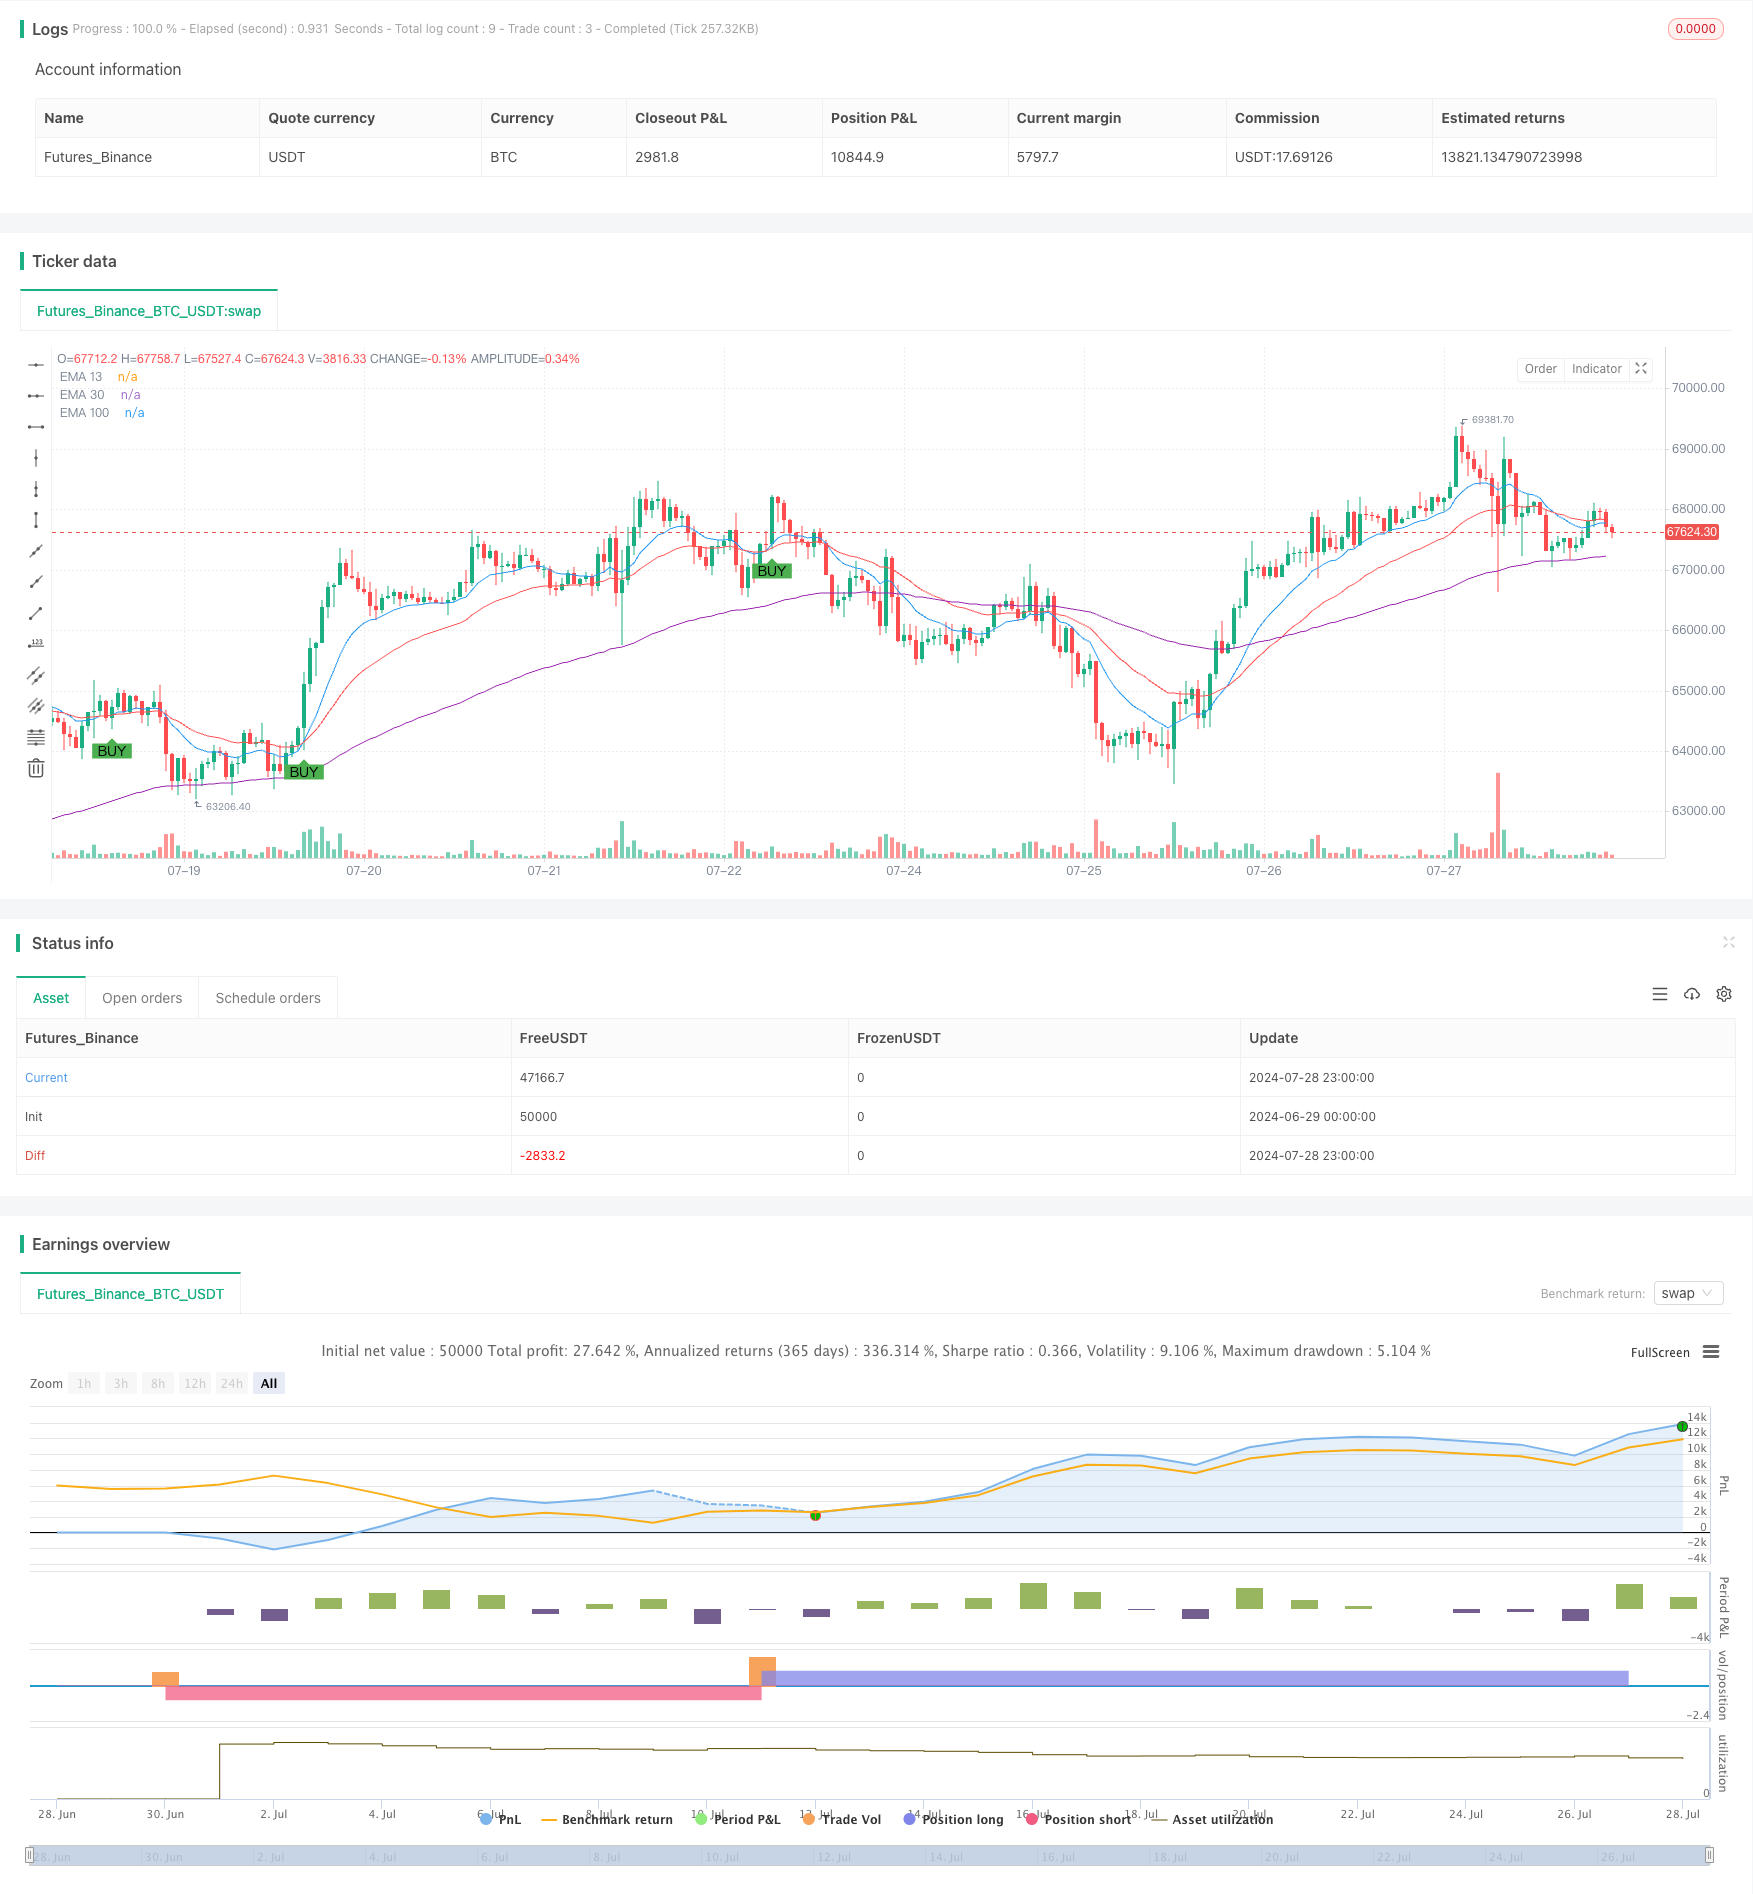
本文介绍的"多重指数移动平均线交叉动量策略"是一种基于技术分析的量化交易策略。该策略利用13周期、30周期和100周期的指数移动平均线(EMA)的交叉关系来生成买入和卖出信号。这种策略旨在捕捉市场趋势的变化,同时通过多重时间框架的结合来降低假突破的风险。
策略原理
该策略的核心原理是利用不同周期EMA之间的交叉关系来判断市场趋势的变化。具体来说:
- 买入条件:当13周期EMA向上穿越30周期EMA,且两者都位于100周期EMA之上时,触发买入信号。
- 卖出条件:当13周期EMA向下穿越30周期EMA,且两者都位于100周期EMA之下时,触发卖出信号。
这种设计利用了短期、中期和长期移动平均线的组合,旨在确认强劲的趋势变化。13周期EMA代表短期趋势,30周期EMA代表中期趋势,而100周期EMA则代表长期趋势。当这三条均线同时确认趋势时,策略认为市场方向发生了显著变化。
策略优势
-
多重时间框架确认:通过结合短期、中期和长期EMA,策略能够更准确地识别真实的趋势变化,减少假信号。
-
趋势跟踪:策略设计符合"趋势是你的朋友"的交易哲学,有助于捕捉大趋势带来的收益。
-
客观性:策略完全基于数学计算和明确的规则,消除了主观判断带来的偏差。
-
适应性:EMA对最近的价格变动反应更敏感,使得策略能够较快地适应市场变化。
-
风险管理:通过要求多个时间框架的确认,策略内置了一定的风险控制机制。
-
可视化:策略在图表上直观地显示了买卖信号,便于交易者快速理解市场状况。
策略风险
-
滞后性:作为滞后指标,EMA可能在趋势已经开始后才给出信号,导致错过部分利润。
-
震荡市场表现欠佳:在横盘震荡的市场中,策略可能频繁给出错误信号,导致频繁交易和亏损。
-
假突破风险:虽然使用了多重确认机制,但在某些市场条件下仍可能出现假突破信号。
-
过度依赖技术指标:策略完全忽视了基本面因素,可能在重大新闻或事件影响市场时表现不佳。
-
参数敏感性:EMA周期的选择可能对策略性能产生显著影响,需要careful地进行参数优化。
策略优化方向
-
引入动量指标:考虑结合RSI或MACD等动量指标,进一步确认趋势强度,减少假信号。
-
增加止损机制:在策略中加入trailing stop或固定止损点,以限制单次交易的最大亏损。
-
优化参数选择:通过历史数据回测,寻找最优的EMA周期组合,以提高策略在不同市场环境下的表现。
-
加入成交量分析:考虑将成交量作为辅助指标,帮助确认趋势的真实性和持续性。
-
实现自适应参数:开发动态调整EMA周期的机制,使策略能够根据市场波动性自动优化参数。
-
引入市场regime识别:增加对市场状态(趋势/震荡)的判断,在不同市场状态下采用不同的交易逻辑。
-
多时间框架分析:扩展策略以考虑更多的时间框架,如日线和周线的结合,以获得更全面的市场视角。
总结
"多重指数移动平均线交叉动量策略"是一种结合了短期、中期和长期市场趋势的量化交易方法。通过利用13、30和100周期EMA的交叉关系,策略旨在捕捉显著的趋势变化。其优势在于多重时间框架的确认机制,有助于减少假信号并捕捉大趋势。然而,策略也面临滞后性和在震荡市场中表现欠佳等风险。
为了进一步提升策略的有效性,可以考虑引入动量指标、优化参数选择、加入止损机制等方向进行改进。此外,结合成交量分析和市场状态识别也可能显著提高策略的稳健性和适应性。
总的来说,这是一个相对简单但潜力巨大的策略框架。通过careful的优化和个性化调整,它有望成为一个可靠的交易工具。然而,交易者在使用此策略时仍需谨慎,并结合其他分析方法和风险管理技巧,以确保长期的交易成功。
||
Overview
This article introduces the "Multi-EMA Crossover Momentum Strategy," a quantitative trading strategy based on technical analysis. The strategy utilizes the crossover relationships between 13-period, 30-period, and 100-period Exponential Moving Averages (EMAs) to generate buy and sell signals. This strategy aims to capture market trend changes while reducing the risk of false breakouts by combining multiple timeframes.
Strategy Principle
The core principle of this strategy is to use the crossover relationships between EMAs of different periods to determine changes in market trends. Specifically:
- Buy Condition: A buy signal is triggered when the 13-period EMA crosses above the 30-period EMA, and both are above the 100-period EMA.
- Sell Condition: A sell signal is triggered when the 13-period EMA crosses below the 30-period EMA, and both are below the 100-period EMA.
This design utilizes a combination of short-term, medium-term, and long-term moving averages to confirm strong trend changes. The 13-period EMA represents the short-term trend, the 30-period EMA represents the medium-term trend, and the 100-period EMA represents the long-term trend. When all three moving averages confirm a trend simultaneously, the strategy considers that a significant change in market direction has occurred.
Strategy Advantages
-
Multi-timeframe confirmation: By combining short-term, medium-term, and long-term EMAs, the strategy can more accurately identify genuine trend changes and reduce false signals.
-
Trend following: The strategy design aligns with the trading philosophy of "the trend is your friend," helping to capture profits from major trends.
-
Objectivity: The strategy is entirely based on mathematical calculations and clear rules, eliminating biases from subjective judgment.
-
Adaptability: EMAs are more sensitive to recent price changes, allowing the strategy to adapt quickly to market changes.
-
Risk management: By requiring confirmation from multiple timeframes, the strategy has built-in risk control mechanisms.
-
Visualization: The strategy displays buy and sell signals intuitively on the chart, allowing traders to quickly understand market conditions.
Strategy Risks
-
Lag: As lagging indicators, EMAs may give signals after a trend has already begun, potentially missing out on some profits.
-
Poor performance in ranging markets: In sideways, choppy markets, the strategy may frequently generate false signals, leading to excessive trading and losses.
-
False breakout risk: Although a multi-confirmation mechanism is used, false breakout signals may still occur under certain market conditions.
-
Over-reliance on technical indicators: The strategy completely ignores fundamental factors and may perform poorly when significant news or events impact the market.
-
Parameter sensitivity: The choice of EMA periods can significantly affect strategy performance, requiring careful parameter optimization.
Strategy Optimization Directions
-
Incorporate momentum indicators: Consider combining RSI or MACD to further confirm trend strength and reduce false signals.
-
Implement stop-loss mechanisms: Add trailing stops or fixed stop-loss points to limit maximum losses per trade.
-
Optimize parameter selection: Conduct historical data backtesting to find the optimal EMA period combination for improved performance across different market environments.
-
Add volume analysis: Consider using volume as a supplementary indicator to help confirm trend authenticity and sustainability.
-
Implement adaptive parameters: Develop a mechanism to dynamically adjust EMA periods, allowing the strategy to automatically optimize parameters based on market volatility.
-
Introduce market regime recognition: Add market state (trend/range) identification to apply different trading logic in various market conditions.
-
Multi-timeframe analysis: Extend the strategy to consider more timeframes, such as combining daily and weekly charts, for a more comprehensive market perspective.
Summary
The "Multi-EMA Crossover Momentum Strategy" is a quantitative trading method that combines short-term, medium-term, and long-term market trends. By utilizing the crossover relationships of 13, 30, and 100-period EMAs, the strategy aims to capture significant trend changes. Its strength lies in the multi-timeframe confirmation mechanism, which helps reduce false signals and capture major trends. However, the strategy also faces risks such as lag and poor performance in ranging markets.
To further enhance the strategy's effectiveness, consider incorporating momentum indicators, optimizing parameter selection, and adding stop-loss mechanisms. Additionally, integrating volume analysis and market state recognition could significantly improve the strategy's robustness and adaptability.
Overall, this is a relatively simple but potentially powerful strategy framework. With careful optimization and personalization, it has the potential to become a reliable trading tool. However, traders should still exercise caution when using this strategy and combine it with other analysis methods and risk management techniques to ensure long-term trading success.
[/trans]
Source (PineScript)
/*backtest
start: 2024-06-29 00:00:00
end: 2024-07-29 00:00:00
period: 1h
basePeriod: 15m
exchanges: [{"eid":"Futures_Binance","currency":"BTC_USDT"}]
*/

//@version=5
strategy("13, 30, 100 EMA Strategy with Rules", overlay=true)

// Define the EMA lengths
ema13_length = 13
ema30_length = 30
ema100_length = 100

// Calculate the EMAs
ema13 = ta.ema(close, ema13_length)
ema30 = ta.ema(close, ema30_length)
ema100 = ta.ema(close, ema100_length)

// Plot the EMAs
plot(ema13, color=color.blue, title="EMA 13")
plot(ema30, color=color.red, title="EMA 30")
plot(ema100, color=color.purple, title="EMA 100")

// Define buy and sell conditions
buyCondition = ta.crossover(ema13, ema30) and ema13 > ema100 and ema30 > ema100
sellCondition = ta.crossunder(ema13, ema30) and ema13 < ema100 and ema30 < ema100

// Generate buy and sell signals
if (buyCondition)
    strategy.entry("Buy", strategy.long)

if (sellCondition)
    strategy.close("Buy")
    strategy.entry("Sell", strategy.short)

// Plot buy and sell signals on the chart
plotshape(series=buyCondition, location=location.belowbar, color=color.green, style=shape.labelup, text="BUY")
plotshape(series=sellCondition, location=location.abovebar, color=color.red, style=shape.labeldown, text="SELL")
Detail
https://www.fmz.com/strategy/458201
Last Modified
2024-07-30 17:20:23