
36 KiB
Name
多重技术指标黄金即时变动检测与风险管理策略-Multi-Technical-Indicator-Gold-Real-Time-Movement-Detection-and-Risk-Management-Strategy
Author
ianzeng123
Strategy Description
[trans]
策略概述
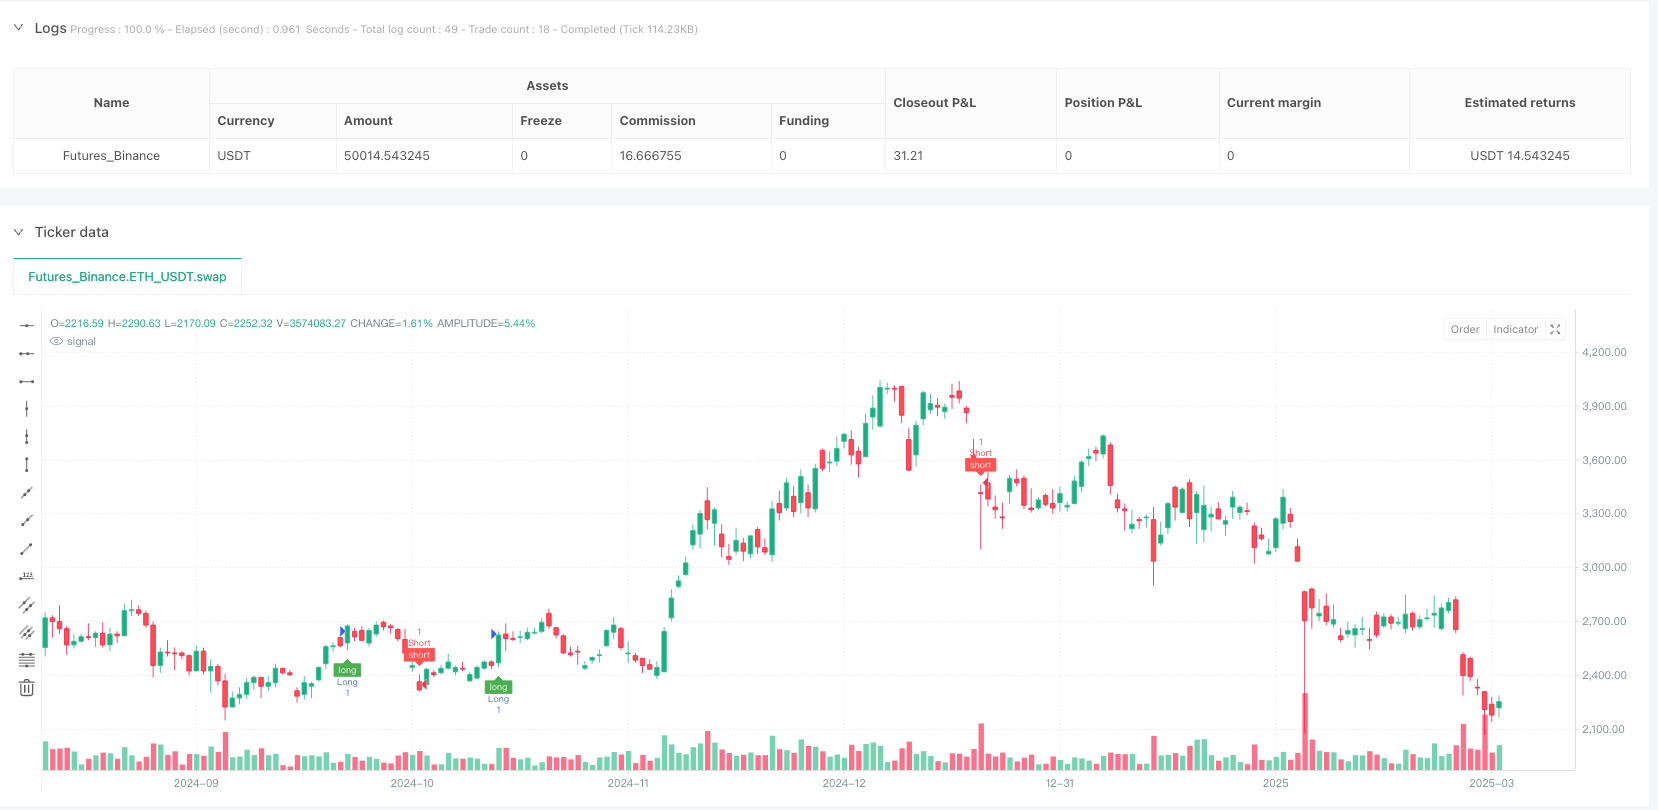
多重技术指标黄金即时变动检测与风险管理策略是一种基于1分钟Heikin Ashi图表的黄金交易系统,它结合了多种技术指标作为交易信号和确认工具。该策略主要使用烛台出口(Chandelier Exit)作为主导指标,并可选择性地结合EMA过滤器、超级趋势(SuperTrend)和沙夫趋势周期(Schaff Trend Cycle)等指标作为确认工具。策略采用了灵活的止盈止损机制,并提供直观的交易仪表盘,使交易者能够实时监控交易状态。这种多维度的技术分析方法旨在快速捕捉黄金价格的短期波动,同时通过指标确认系统降低假信号风险。
策略原理
该策略基于多层次信号确认系统,核心逻辑如下:
-
主导指标信号生成:策略以烛台出口(Chandelier Exit)作为主导指标。烛台出口是一种趋势跟踪指标,使用ATR(平均真实范围)乘数来确定止损位置,并生成多头和空头信号。
-
确认指标过滤:策略允许交易者选择性地启用多个确认指标:
- EMA过滤器:价格需要位于指定EMA线上方(多头)或下方(空头)
- 超级趋势(SuperTrend):需要与主导信号方向一致
- 沙夫趋势周期(STC):需要高于上界(多头)或低于下界(空头)
-
信号过期机制:策略实现了信号过期功能,可设置信号有效的蜡烛数量,防止在旧信号上交易。
-
交易执行逻辑:当满足所有选定条件时,策略生成进场信号,并自动设置固定点数的止盈止损。
-
数据处理优化:策略使用条件采样EMA和SMA函数,以及专用的范围过滤器,提高了技术指标的计算效率。
-
可视化系统:提供交易仪表盘显示各指标状态,并在图表上标记交易信号和止盈止损位置。
策略优势
-
多重确认机制:通过多重指标确认,显著减少假信号,提高交易准确性。当多个指标共同确认一个方向时,交易信号更为可靠。
-
灵活的指标组合:用户可自由选择启用或禁用各种确认指标,根据不同市场条件定制策略表现。
-
精确的风险管理:策略允许用户设置具体的止盈止损点数,便于精确控制每笔交易的风险回报比。
-
信号过期控制:通过设置信号有效期,策略避免在过时信号上交易,减少滞后风险。
-
高度可视化的交易界面:交易仪表盘直观显示所有指标状态,帮助交易者快速评估市场条件。
-
针对黄金市场优化:策略针对黄金市场的特性进行了参数优化,特别考虑了点值换算(1点=0.1美元)。
-
高频交易适应性:1分钟时间周期使策略能够捕捉短期价格波动,适合日内交易者。
策略风险
-
过度交易风险:1分钟周期可能生成过多交易信号,导致交易成本增加和过度交易。解决方法是调整确认指标数量或增加信号过滤条件。
-
市场噪音影响:低时间周期更容易受到市场噪音干扰,产生假信号。建议在高波动性时期谨慎使用,或结合更长周期的趋势确认。
-
指标堆叠的滞后性:多重指标确认虽然降低了假信号,但也增加了系统的滞后性,可能导致错过部分盈利机会。可以考虑减少确认指标数量以提高响应速度。
-
固定止盈止损的局限性:固定点数的止盈止损没有考虑市场波动性变化,在高波动期可能止损过近,低波动期止盈过远。建议根据当前ATR动态调整止盈止损值。
-
黄金市场特殊风险:黄金市场受到多种宏观经济因素影响,包括通胀数据、央行政策、地缘政治等,纯技术分析可能忽视这些影响。建议结合基本面分析使用。
-
主导指标依赖性:策略过度依赖烛台出口作为主导指标,该指标在区间市场表现可能不佳。建议增加选择多种主导指标的选项。
策略优化方向
-
主导指标多样化:目前策略仅支持烛台出口作为主导指标,可以扩展支持多种主导指标选择,如布林带、MACD或自适应移动平均线等,以适应不同市场环境。
-
动态止盈止损:将固定点数止盈止损改为基于ATR的动态止盈止损,可以更好地适应市场波动性变化。例如,可以使用
sl_value = atr(14) * 1.5代替固定点数。 -
时间过滤器整合:增加交易时间过滤器,避开低流动性时段或重要新闻发布时段,可以减少滑点和意外价格波动带来的风险。
-
加入成交量分析:整合成交量指标可以验证价格移动的强度,提高信号质量。例如,只有当成交量增加时才确认突破信号。
-
机器学习优化:引入机器学习算法动态调整各指标权重,根据最近市场表现自适应策略参数。
-
分批进出场机制:实施分批进出场机制,减少单一进出场点的时机风险,例如分三次建仓和分三次平仓。
-
多时间周期确认:增加更高时间周期的趋势确认,只在高时间周期趋势方向上开仓,减少逆势交易风险。
-
指标相关性分析:分析所选指标间的相关性,避免使用高度相关的指标作为确认,这可能导致假象的多重确认。
总结
多重技术指标黄金即时变动检测与风险管理策略是一种面向短期交易者的复合型交易系统,通过整合多种技术指标提供更可靠的交易信号。该策略的核心优势在于其灵活的指标确认机制和直观的可视化界面,使交易者能够根据市场状况调整策略参数。然而,用户需要警惕低时间周期交易的固有风险,包括过度交易和市场噪音影响。
通过实施建议的优化措施,特别是动态止盈止损、多时间周期确认和主导指标多样化,该策略可以进一步提高其适应性和稳健性。对于日内交易者和短线黄金交易爱好者来说,这一策略提供了一个技术分析框架,但应结合资金管理原则和市场基本面理解使用,以达到最佳效果。
最终,交易成功不仅取决于策略本身,还取决于交易者对策略的理解和正确执行。持续的策略回测、优化和适应是实现长期稳定交易结果的关键。 ||
Strategy Overview
The Multi-Technical Indicator Gold Real-Time Movement Detection and Risk Management Strategy is a gold trading system based on 1-minute Heikin Ashi charts, combining multiple technical indicators as trading signals and confirmation tools. The strategy primarily uses Chandelier Exit as the leading indicator, with optional integration of EMA filter, SuperTrend, and Schaff Trend Cycle (STC) as confirmation tools. The strategy employs a flexible take-profit and stop-loss mechanism and provides an intuitive trading dashboard that allows traders to monitor trading status in real-time. This multi-dimensional technical analysis approach aims to quickly capture short-term fluctuations in gold prices while reducing the risk of false signals through an indicator confirmation system.
Strategy Principles
The strategy is based on a multi-level signal confirmation system, with core logic as follows:
-
Leading Indicator Signal Generation: The strategy uses Chandelier Exit as the leading indicator. Chandelier Exit is a trend-following indicator that uses ATR (Average True Range) multiplier to determine stop-loss positions and generates long and short signals.
-
Confirmation Indicator Filtering: The strategy allows traders to selectively enable multiple confirmation indicators:
- EMA Filter: Price needs to be above (long) or below (short) the specified EMA line
- SuperTrend: Needs to align with the leading signal direction
- Schaff Trend Cycle (STC): Needs to be above the upper boundary (long) or below the lower boundary (short)
-
Signal Expiry Mechanism: The strategy implements a signal expiry function, which can set the number of candles for which the signal remains valid, preventing trading on old signals.
-
Trade Execution Logic: When all selected conditions are met, the strategy generates entry signals and automatically sets take-profit and stop-loss at fixed points.
-
Data Processing Optimization: The strategy uses conditional sampling EMA and SMA functions, as well as dedicated range filters, improving the calculation efficiency of technical indicators.
-
Visualization System: Provides a trading dashboard displaying the status of various indicators, and marks trading signals and take-profit/stop-loss positions on the chart.
Strategy Advantages
-
Multiple Confirmation Mechanism: Significantly reduces false signals and improves trading accuracy through multiple indicator confirmations. When multiple indicators jointly confirm a direction, the trading signal becomes more reliable.
-
Flexible Indicator Combinations: Users can freely choose to enable or disable various confirmation indicators, customizing strategy performance according to different market conditions.
-
Precise Risk Management: The strategy allows users to set specific take-profit and stop-loss points, facilitating precise control of the risk-reward ratio for each trade.
-
Signal Expiry Control: By setting signal validity periods, the strategy avoids trading on outdated signals, reducing lag risk.
-
Highly Visualized Trading Interface: The trading dashboard intuitively displays the status of all indicators, helping traders quickly assess market conditions.
-
Optimized for Gold Markets: The strategy has been parameter-optimized for the characteristics of the gold market, with special consideration for point value conversion (1 point = $0.1).
-
High-Frequency Trading Adaptability: The 1-minute timeframe enables the strategy to capture short-term price movements, suitable for intraday traders.
Strategy Risks
-
Over-Trading Risk: The 1-minute timeframe may generate excessive trading signals, leading to increased trading costs and over-trading. The solution is to adjust the number of confirmation indicators or add signal filtering conditions.
-
Market Noise Impact: Lower timeframes are more susceptible to market noise interference, producing false signals. It is recommended to use with caution during high volatility periods, or combine with longer timeframe trend confirmations.
-
Indicator Stacking Lag: While multiple indicator confirmations reduce false signals, they also increase system lag, potentially causing missed profit opportunities. Consider reducing the number of confirmation indicators to improve response speed.
-
Limitations of Fixed Take-Profit/Stop-Loss: Fixed point take-profit/stop-loss does not account for changing market volatility; during high volatility periods, stop-loss may be too close, while during low volatility periods, take-profit may be too far. It is recommended to dynamically adjust take-profit/stop-loss values based on current ATR.
-
Gold Market Specific Risks: Gold markets are influenced by various macroeconomic factors, including inflation data, central bank policies, geopolitics, etc., which pure technical analysis may ignore. It is recommended to combine with fundamental analysis.
-
Leading Indicator Dependency: The strategy overly relies on Chandelier Exit as the leading indicator, which may not perform well in ranging markets. It is recommended to add options for selecting multiple leading indicators.
Strategy Optimization Directions
-
Diversification of Leading Indicators: Currently the strategy only supports Chandelier Exit as the leading indicator. It could be expanded to support multiple leading indicator options, such as Bollinger Bands, MACD, or Adaptive Moving Averages, to adapt to different market environments.
-
Dynamic Take-Profit/Stop-Loss: Replace fixed point take-profit/stop-loss with ATR-based dynamic take-profit/stop-loss for better adaptation to market volatility changes. For example,
sl_value = atr(14) * 1.5could be used instead of fixed points. -
Time Filter Integration: Add trading time filters to avoid low liquidity sessions or important news release periods, reducing the risk of slippage and unexpected price movements.
-
Volume Analysis Integration: Integrating volume indicators can verify the strength of price movements and improve signal quality. For example, only confirm breakout signals when volume increases.
-
Machine Learning Optimization: Introduce machine learning algorithms to dynamically adjust indicator weights based on recent market performance, making strategy parameters self-adaptive.
-
Partial Entry/Exit Mechanism: Implement partial entry/exit mechanisms to reduce timing risk of single entry/exit points, such as building positions in three phases and exiting in three phases.
-
Multi-Timeframe Confirmation: Add higher timeframe trend confirmation, only entering positions in the direction of higher timeframe trends, reducing counter-trend trading risk.
-
Indicator Correlation Analysis: Analyze correlations between selected indicators to avoid using highly correlated indicators as confirmation, which might lead to illusory multiple confirmations.
Conclusion
The Multi-Technical Indicator Gold Real-Time Movement Detection and Risk Management Strategy is a composite trading system for short-term traders that provides more reliable trading signals by integrating multiple technical indicators. The core advantages of the strategy lie in its flexible indicator confirmation mechanism and intuitive visualization interface, allowing traders to adjust strategy parameters according to market conditions. However, users need to be aware of the inherent risks of low timeframe trading, including over-trading and market noise impact.
By implementing the suggested optimization measures, particularly dynamic take-profit/stop-loss, multi-timeframe confirmation, and leading indicator diversification, the strategy can further improve its adaptability and robustness. For intraday traders and short-term gold trading enthusiasts, this strategy provides a technical analysis framework but should be used in conjunction with money management principles and market fundamental understanding to achieve optimal results.
Ultimately, trading success depends not only on the strategy itself but also on the trader's understanding and correct execution of the strategy. Continuous strategy backtesting, optimization, and adaptation are key to achieving long-term stable trading results.[/trans]
Source (PineScript)
/*backtest
start: 2024-03-05 00:00:00
end: 2025-03-03 08:00:00
period: 1d
basePeriod: 1d
exchanges: [{"eid":"Futures_Binance","currency":"ETH_USDT"}]
*/

//@version=5
strategy("1 Min Gold Heikin Ashi Strategy", overlay=true, max_bars_back=500)

// Adjustable TP & SL in Pips
tp_pips = input.int(50, title="Take Profit (Pips)")
sl_pips = input.int(30, title="Stop Loss (Pips)")

// Convert pips to price value for XAUUSD (1 pip = 0.1 in Gold)
tp_value = tp_pips * 0.1
sl_value = sl_pips * 0.1

// Fixed components
justcontinue = bool(true)

ma(_source, _length, _type) =>
    switch _type
        "SMA"  => ta.sma (_source, _length)
        "EMA"  => ta.ema (_source, _length)
        "RMA"  => ta.rma (_source, _length)
        "WMA"  => ta.wma (_source, _length)
        "VWMA" => ta.vwma(_source, _length)

alarm(_osc, _message) =>
    alert(syminfo.ticker + ' ' + _osc + ' : ' + _message + ', price (' + str.tostring(close, format.mintick) + ')')

// Conditional Sampling EMA Function
Cond_EMA(x, cond, n) =>
    var val = array.new_float(0)
    var ema_val = array.new_float(1)
    if cond
        array.push(val, x)
        if array.size(val) > 1
            array.remove(val, 0)
        if na(array.get(ema_val, 0))
            array.fill(ema_val, array.get(val, 0))
        array.set(ema_val, 0, (array.get(val, 0) - array.get(ema_val, 0)) * (2 / (n + 1)) + array.get(ema_val, 0))
    EMA = array.get(ema_val, 0)
    EMA

// Conditional Sampling SMA Function
Cond_SMA(x, cond, n) =>
    var vals = array.new_float(0)
    if cond
        array.push(vals, x)
        if array.size(vals) > n
            array.remove(vals, 0)
    SMA = array.avg(vals)
    SMA

// Standard Deviation Function
Stdev(x, n) =>
    math.sqrt(Cond_SMA(math.pow(x, 2), 1, n) - math.pow(Cond_SMA(x, 1, n), 2))

// Range Size Function
rng_size(x, scale, qty, n) =>
    ATR = Cond_EMA(ta.tr(true), 1, n)
    AC = Cond_EMA(math.abs(x - x[1]), 1, n)
    SD = Stdev(x, n)
    rng_size = scale == 'Pips' ? qty * 0.0001 : scale == 'Points' ? qty * syminfo.pointvalue : scale == '% of Price' ? close * qty / 100 : scale == 'ATR' ? qty * ATR : scale == 'Average Change' ? qty * AC : scale == 'Standard Deviation' ? qty * SD : scale == 'Ticks' ? qty * syminfo.mintick : qty
    rng_size

// Two Type Range Filter Function
rng_filt(h, l, rng_, n, type, smooth, sn, av_rf, av_n) =>
    rng_smooth = Cond_EMA(rng_, 1, sn)
    r = smooth ? rng_smooth : rng_
    var rfilt = array.new_float(2, (h + l) / 2)
    array.set(rfilt, 1, array.get(rfilt, 0))
    if type == 'Type 1'
        if h - r > array.get(rfilt, 1)
            array.set(rfilt, 0, h - r)
        if l + r < array.get(rfilt, 1)
            array.set(rfilt, 0, l + r)
    if type == 'Type 2'
        if h >= array.get(rfilt, 1) + r
            array.set(rfilt, 0, array.get(rfilt, 1) + math.floor(math.abs(h - array.get(rfilt, 1)) / r) * r)
        if l <= array.get(rfilt, 1) - r
            array.set(rfilt, 0, array.get(rfilt, 1) - math.floor(math.abs(l - array.get(rfilt, 1)) / r) * r)
    rng_filt1 = array.get(rfilt, 0)
    hi_band1 = rng_filt1 + r
    lo_band1 = rng_filt1 - r
    rng_filt2 = Cond_EMA(rng_filt1, rng_filt1 != rng_filt1[1], av_n)
    hi_band2 = Cond_EMA(hi_band1, rng_filt1 != rng_filt1[1], av_n)
    lo_band2 = Cond_EMA(lo_band1, rng_filt1 != rng_filt1[1], av_n)
    rng_filt = av_rf ? rng_filt2 : rng_filt1
    hi_band = av_rf ? hi_band2 : hi_band1
    lo_band = av_rf ? lo_band2 : lo_band1
    [hi_band, lo_band, rng_filt]

// Moving Average Function
ma_function(source, length, type) =>
    if type == 'RMA'
        ta.rma(source, length)
    else if type == 'SMA'
        ta.sma(source, length)
    else if type == 'EMA'
        ta.ema(source, length)
    else if type == 'WMA'
        ta.wma(source, length)
    else if type == 'HMA'
        if (length < 2)
            ta.hma(source, 2)
        else
            ta.hma(source, length)
    else
        ta.vwma(source, length)

// Get Table Size
table_size(s) =>
    switch s
        "Auto"   => size.auto
        "Huge"   => size.huge
        "Large"  => size.large
        "Normal" => size.normal
        "Small"  => size.small
        => size.tiny

// Confirmation Setup
confirmation_counter = array.new_string(0)
confirmation_val = array.new_string(0)
confirmation_val_short = array.new_string(0)

pushConfirmation(respect, label, longCondition, shortCondition) =>
    if respect
        array.push(confirmation_counter, label)
        array.push(confirmation_val, longCondition ? "✔️" : "❌")
        array.push(confirmation_val_short, shortCondition ? "✔️" : "❌")

leadinglongcond = bool(na)
leadingshortcond = bool(na)
longCond = bool(na)
shortCond = bool(na)
longCondition = bool(na)
shortCondition = bool(na)

// Indicator Setup Inputs
setup_group = "████████ Indicator Setup ████████"
signalexpiry = input.int(defval=3, title='Signal Expiry Candle Count', group=setup_group, inline='expiry', tooltip="Number of candles to wait for all indicators to confirm a signal. Default is 3.")
alternatesignal = input.bool(true, "Alternate Signal", group=setup_group, inline='alternate')
showsignal = input.bool(true, "Show Long/Short Signal", group=setup_group, inline='showsignal', tooltip="Option to turn on/off the Long/Short signal shown on the chart.")
showdashboard = input.bool(true, "Show Dashboard", group=setup_group, inline='dashboard')

string i_tab1Ypos = input.string('bottom', 'Dashboard Position', group=setup_group, inline='dashboard2', options=['top', 'middle', 'bottom'])
string i_tab1Xpos = input.string('right', '', inline='dashboard2', group=setup_group, options=['left', 'center', 'right'])
in_dashboardtab_size = input.string(title="Dashboard Size", defval="Normal", options=["Auto", "Huge", "Large", "Normal", "Small", "Tiny"], group=setup_group, inline="dashboard3")

// Confirmation Indicator Settings
confirmation_group = "████████ Confirmation Indicators (filter) ████████"
respectce = input.bool(false, "Chandelier Exit", group=confirmation_group, inline='ce')
respectema = input.bool(false, "EMA Filter", group=confirmation_group, inline='respectema')
respectemaperiod = input.int(defval=200, minval=1, title='', group=confirmation_group, inline='respectema', tooltip="EMA filter for confirmation.")
respectst = input.bool(false, "SuperTrend", group=confirmation_group, inline='st')
respectstc = input.bool(false, "Schaff Trend Cycle (STC)", group=confirmation_group, inline='stc')

// Switchboard Indicators
switchboard_group = "████ Switch Board (Turn On/Off Overlay Indicators) ████"
switch_ema = input.bool(false, "EMA", group=switchboard_group, inline='Switch1')
switch_supertrend = input.bool(false, "Supertrend", group=switchboard_group, inline='Switch2')
switch_stc = input.bool(false, "STC", group=switchboard_group, inline='Switch3')

// ----------------------------------------
// 4. Indicator Code

// Chandelier Exit
////////////////////////////////////////////////
////// Chandelier Exit
///////////////////////////////////////////////
ChandelierE = "██████████ Chandelier Exit ██████████"
ce_length = input.int(title='ATR Period', defval=22, group=ChandelierE)
ce_mult = input.float(title='ATR Multiplier', step=0.1, defval=3.0, group=ChandelierE)
showLabels = input.bool(title='Show Buy/Sell Labels?', defval=true, group=ChandelierE)
useClose = input.bool(title='Use Close Price for Extremums?', defval=true, group=ChandelierE)
highlightState = input.bool(title='Highlight State?', defval=true, group=ChandelierE)

ce_atr = ce_mult * ta.atr(ce_length)
longStop = (useClose ? ta.highest(close, ce_length) : ta.highest(ce_length)) - ce_atr
longStopPrev = nz(longStop[1], longStop)
longStop := close[1] > longStopPrev ? math.max(longStop, longStopPrev) : longStop

shortStop = (useClose ? ta.lowest(close, ce_length) : ta.lowest(ce_length)) + ce_atr
shortStopPrev = nz(shortStop[1], shortStop)
shortStop := close[1] < shortStopPrev ? math.min(shortStop, shortStopPrev) : shortStop

var int dir = 1
dir := close > shortStopPrev ? 1 : close < longStopPrev ? -1 : dir

ce_long = dir == 1
ce_short = dir == -1

// EMA Filter
////////////////////////////////////////////////////////////////////////////
//////////// EMA Filter
////////////////////////////////////////////////////////////////////////////
respectemavalue = ta.ema(close, respectemaperiod)
isaboverespectema = close > respectemavalue
isbelowrespectema = close < respectemavalue

// SuperTrend Calculation
////////////////////////////////
///// SuperTrend
//////////////////////////////
sp_group = "██████████ SuperTrend ██████████"
Periods = input.int(title='ATR Period', defval=10, group=sp_group)
stsrc = input.source(hl2, title='Source', group=sp_group)
Multiplier = input.float(title='ATR Multiplier', step=0.1, defval=3.0, group=sp_group)
changeATR = input.bool(title='Change ATR Calculation Method?', defval=true, group=sp_group)

statr2 = ta.sma(ta.tr, Periods)
statr = changeATR ? ta.atr(Periods) : statr2
stup = stsrc - Multiplier * statr
up1 = nz(stup[1], stup)
stup := close[1] > up1 ? math.max(stup, up1) : stup
dn = stsrc + Multiplier * statr
dn1 = nz(dn[1], dn)
dn := close[1] < dn1 ? math.min(dn, dn1) : dn
sttrend = 1
sttrend := nz(sttrend[1], sttrend)
sttrend := sttrend == -1 and close > dn1 ? 1 : sttrend == 1 and close < up1 ? -1 : sttrend
stbuySignal = sttrend == 1 and sttrend[1] == -1
stsellSignal = sttrend == -1 and sttrend[1] == 1

isstup = bool(na)
isstdown = bool(na)
isstup := sttrend == 1
isstdown := sttrend != 1

// Schaff Trend Cycle (STC)
/////////////////////////
/// STC overlay signal
/////////////////////////
stc_group = "██████████ Schaff Trend Cycle (STC) ██████████"
fastLength = input.int(title='MACD Fast Length', defval=23, group=stc_group)
slowLength = input.int(title='MACD Slow Length', defval=50, group=stc_group)
cycleLength = input.int(title='Cycle Length', defval=10, group=stc_group)
d1Length = input.int(title='1st %D Length', defval=3, group=stc_group)
d2Length = input.int(title='2nd %D Length', defval=3, group=stc_group)
srcstc = input.source(title='Source', defval=close, group=stc_group)
upper = input.int(title='Upper Band', defval=75, group=stc_group)
lower = input.int(title='Lower Band', defval=25, group=stc_group)
v_show_last  = input.int(2000, "Plotting Length", group=stc_group)

macd = ta.ema(srcstc, fastLength) - ta.ema(srcstc, slowLength)
k = nz(fixnan(ta.stoch(macd, macd, macd, cycleLength)))
d = ta.ema(k, d1Length)
kd = nz(fixnan(ta.stoch(d, d, d, cycleLength)))
stc = ta.ema(kd, d2Length)
stc := math.max(math.min(stc, 100), 0)

stcColor1 = stc > stc[1] ? color.green : color.red
stcColor2 = stc > upper ? color.green : stc <= lower ? color.red : color.orange

upperCrossover = ta.crossover(stc, upper)
upperCrossunder = ta.crossunder(stc, upper)
lowerCrossover = ta.crossover(stc, lower)
lowerCrossunder = ta.crossunder(stc, lower)
stcup = stc >= upper
stcdown = stc <= lower

// ----------------------------------------
// 5. Switchboard Code

// Additional code for EMA from Switchboard
/////////////////////////////////////////////////////////////////////////
// EMA Selection
/////////////////////////////////////////////////////////////////////////
ma_group= "██████████ MAs Line ██████████"

len1bool = input.bool(true, '', group=ma_group, inline='len1')
len1 = input.int(5, title='MA 1', group=ma_group, inline='len1')
string ma_1_type = input.string(defval='EMA', title='Type', options=['RMA', 'SMA', 'EMA', 'WMA', 'HMA', 'VWMA'], inline='len1', group=ma_group)
color ma_1_colour = input.color(color.rgb(254, 234, 74, 0), '', inline='len1', group=ma_group)

len2bool = input.bool(true, '', group=ma_group, inline='len2')
len2 = input.int(13, minval=1, title='MA 2', group=ma_group, inline='len2')
string ma_2_type = input.string(defval='EMA', title='Type', options=['RMA', 'SMA', 'EMA', 'WMA', 'HMA', 'VWMA'], inline='len2', group=ma_group)
color ma_2_colour = input.color(color.rgb(253, 84, 87, 0), '', inline='len2', group=ma_group)

len3bool = input.bool(false, '', group=ma_group, inline='len3')
len3 = input.int(20, minval=1, title='MA 3', group=ma_group, inline='len3')
string ma_3_type = input.string(defval='EMA', title='Type', options=['RMA', 'SMA', 'EMA', 'WMA', 'HMA', 'VWMA'], inline='len3', group=ma_group)
color ma_3_colour = input.color(color.new(color.aqua, 0), '', inline='len3', group=ma_group)

len4bool = input.bool(true, '', group=ma_group, inline='len4')
len4 = input.int(50, minval=1, title='MA 4', group=ma_group, inline='len4')
string ma_4_type = input.string(defval='EMA', title='Type', options=['RMA', 'SMA', 'EMA', 'WMA', 'HMA', 'VWMA'], inline='len4', group=ma_group)
color ma_4_colour = input.color(color.new(color.blue, 0), '', inline='len4', group=ma_group)

len5bool = input.bool(true, '', group=ma_group, inline='len5')
len5 = input.int(200, minval=1, title='MA 5', group=ma_group, inline='len5')
string ma_5_type = input.string(defval='EMA', title='Type', options=['RMA', 'SMA', 'EMA', 'WMA', 'HMA', 'VWMA'], inline='len5', group=ma_group)
color ma_5_colour = input.color(color.new(color.white, 0), '', inline='len5', group=ma_group)

// Request Security for MA calculations
ema1 = request.security(syminfo.tickerid, timeframe.period, ma_function(close, len1, ma_1_type))
ema2 = request.security(syminfo.tickerid, timeframe.period, ma_function(close, len2, ma_2_type))
ema3 = request.security(syminfo.tickerid, timeframe.period, ma_function(close, len3, ma_3_type))
ema4 = request.security(syminfo.tickerid, timeframe.period, ma_function(close, len4, ma_4_type))
ema5 = request.security(syminfo.tickerid, timeframe.period, ma_function(close, len5, ma_5_type))

// Plot the Moving Averages
plot(len1bool and switch_ema ? ema1 : na, color=ma_1_colour, linewidth=2, title='MA 1')
plot(len2bool and switch_ema ? ema2 : na, color=ma_2_colour, linewidth=2, title='MA 2')
plot(len3bool and switch_ema ? ema3 : na, color=ma_3_colour, linewidth=2, title='MA 3')
plot(len4bool and switch_ema ? ema4 : na, color=ma_4_colour, linewidth=2, title='MA 4')
plot(len5bool and switch_ema ? ema5 : na, color=ma_5_colour, linewidth=2, title='MA 5')

// Additional code for SuperTrend from switchboard
///////////////////////////////////////////////////
// SuperTrend - Switchboard
///////////////////////////////////////////////////
upPlot = plot(sttrend == 1 and switch_supertrend ? stup : na, title='Up Trend', style=plot.style_linebr, linewidth=2, color=color.new(color.green, 0))
plotshape(stbuySignal and switch_supertrend ? stup : na, title='UpTrend Begins', location=location.absolute, style=shape.circle, size=size.tiny, color=color.new(color.green, 0))

dnPlot = plot(sttrend != 1 and switch_supertrend ? dn : na, title='Down Trend', style=plot.style_linebr, linewidth=2, color=color.new(color.red, 0))
plotshape(stsellSignal and switch_supertrend ? dn : na, title='DownTrend Begins', location=location.absolute, style=shape.circle, size=size.tiny, color=color.new(color.red, 0))

// Additional code for Schaff Trend Cycle (STC) from switchboard
/////////////////////////////////////////////
// Schaff Trend Cycle (STC) - Switchboard
/////////////////////////////////////////////
plotshape(stcdown and switch_stc ? true : na, style=shape.circle, location=location.top, show_last=v_show_last, color=color.new(color.red, 0), title='STC Sell')
plotshape(stcup and switch_stc ? true : na, style=shape.circle, location=location.top, show_last=v_show_last, color=color.new(color.green, 0), title='STC Buy')

// ----------------------------------------
// 6. Declare and Initialize 'leadingindicator'
leadingindicator = input.string(title="Leading Indicator", defval="Chandelier Exit",
  options=["Chandelier Exit"], group="████████ Main Indicator (signal) ████████")

// 6. Leading Indicator Logic
if leadingindicator == 'Chandelier Exit'
    leadinglongcond := ce_long
    leadingshortcond := ce_short

// ----------------------------------------
// 7. Confirmation Indicator Logic
longCond := leadinglongcond
shortCond := leadingshortcond

longCond := longCond  and   (respectce ? ce_long : justcontinue)
shortCond := shortCond and   (respectce ? ce_short : justcontinue)

longCond := longCond  and   (respectema ? isaboverespectema : justcontinue)
shortCond := shortCond and   (respectema ? isbelowrespectema : justcontinue)

longCond := longCond  and   (respectst ? isstup : justcontinue)
shortCond := shortCond and   (respectst ? isstdown : justcontinue)

longCond := longCond  and   (respectstc ? stcup : justcontinue)


// ----------------------------------------
// 7. Confirmation Indicator Logic

longCond := leadinglongcond
shortCond := leadingshortcond

longCond := longCond  and   (respectce ? ce_long : justcontinue)
shortCond := shortCond and   (respectce ? ce_short : justcontinue)

longCond := longCond  and   (respectema ? isaboverespectema : justcontinue)
shortCond := shortCond and   (respectema ? isbelowrespectema : justcontinue)

longCond := longCond  and   (respectst ? isstup : justcontinue)
shortCond := shortCond and   (respectst ? isstdown : justcontinue)

longCond := longCond  and   (respectstc ? stcup : justcontinue)
shortCond := shortCond and   (respectstc ? stcdown : justcontinue)

// ----------------------------------------
// 8. Function to Update Dashboard Label

pushConfirmation(respectce, "Chandelier Exit", ce_long, ce_short)
pushConfirmation(respectema, "EMA", isaboverespectema, isbelowrespectema)
pushConfirmation(respectst, "SuperTrend", isstup, isstdown)
pushConfirmation(respectstc, "Schaff Trend Cycle", stcup, stcdown)

// ----------------------------------------
// 9. Final Part (Dashboard Table and Signal Plotting)

leadingstatus = leadinglongcond ? "✔️" : "❌"
leadingstatus_short = leadingshortcond ? "✔️" : "❌"

rowcount = int(na)
if array.size(confirmation_counter) == 0
    rowcount := 5
else
    rowcount := array.size(confirmation_counter) + 4

// Signal Expiry Logic
var int leadinglong_count = 0
var int leadinglong_count2 = 0
var int leadingshort_count = 0
var int leadingshort_count2 = 0

if leadinglongcond
    leadinglong_count := leadinglong_count + 1
    leadinglong_count2 := leadinglong_count

for i = 1 to 100
    if leadinglongcond[i]
        leadinglong_count := leadinglong_count + 1
        leadinglong_count2 := leadinglong_count
    else
        leadinglong_count := 0
        break

if leadingshortcond
    leadingshort_count := leadingshort_count + 1
    leadingshort_count2 := leadingshort_count

for i = 1 to 100
    if leadingshortcond[i]
        leadingshort_count := leadingshort_count + 1
        leadingshort_count2 := leadingshort_count
    else
        leadingshort_count := 0
        break

// Expiry Condition
CondIni = 0

// If expiry option is used
longcond_withexpiry = longCond and leadinglong_count2 <= signalexpiry
shortcond_withexpiry = shortCond and leadingshort_count2 <= signalexpiry

// Without expiry
longCondition := longcond_withexpiry and CondIni[1] == -1
shortCondition := shortcond_withexpiry and CondIni[1] == 1

if alternatesignal
    longCondition := longcond_withexpiry and CondIni[1] == -1
    shortCondition := shortcond_withexpiry and CondIni[1] == 1
else
    longCondition := longcond_withexpiry
    shortCondition := shortcond_withexpiry

CondIni := longcond_withexpiry ? 1 : shortcond_withexpiry ? -1 : CondIni[1]

// Check if expiry count is crossed
is_expiry_count_crossed_long = leadinglong_count2 >= signalexpiry
is_expiry_count_crossed_short = leadingshort_count2 >= signalexpiry

// Plot signals on chart
plotshape(showsignal ? (longCondition[1] ? false : longCondition) : na, title='Buy Signal', text='long', textcolor=color.new(color.white, 0), style=shape.labelup, size=size.tiny, location=location.belowbar, color=color.new(color.green, 0))
plotshape(showsignal ? (shortCondition[1] ? false : shortCondition) : na, title='Sell Signal', text='short', textcolor=color.new(color.white, 0), style=shape.labeldown, size=size.tiny, location=location.abovebar, color=color.new(color.red, 0))

// Alerts
alertcondition(longCondition, title='Buy Alert', message='BUY')
alertcondition(shortCondition, title='Sell Alert', message='SELL')
alertcondition(longCondition or shortCondition, title='Buy or Sell Alert', message="Buy or Sell Alert")

/// ----------------------------------------
// 10. Strategy Execution - Entries & Exits

// Use already declared TP & SL values (from the start of the script)

// Long Entry Conditions
if longCondition
    strategy.entry("Long", strategy.long)
    strategy.exit("TakeProfit_Long", from_entry="Long", limit=close + tp_value, stop=close - sl_value)

// Short Entry Conditions
if shortCondition
    strategy.entry("Short", strategy.short)
    strategy.exit("TakeProfit_Short", from_entry="Short", limit=close - tp_value, stop=close + sl_value)
Detail
https://www.fmz.com/strategy/484924
Last Modified
2025-03-05 10:35:15