
9.2 KiB
Name
多重技术指标智能波动突破策略-Multi-Technical-Indicator-Smart-Volatility-Breakout-Strategy
Author
ianzeng123
Strategy Description
[trans]
概述
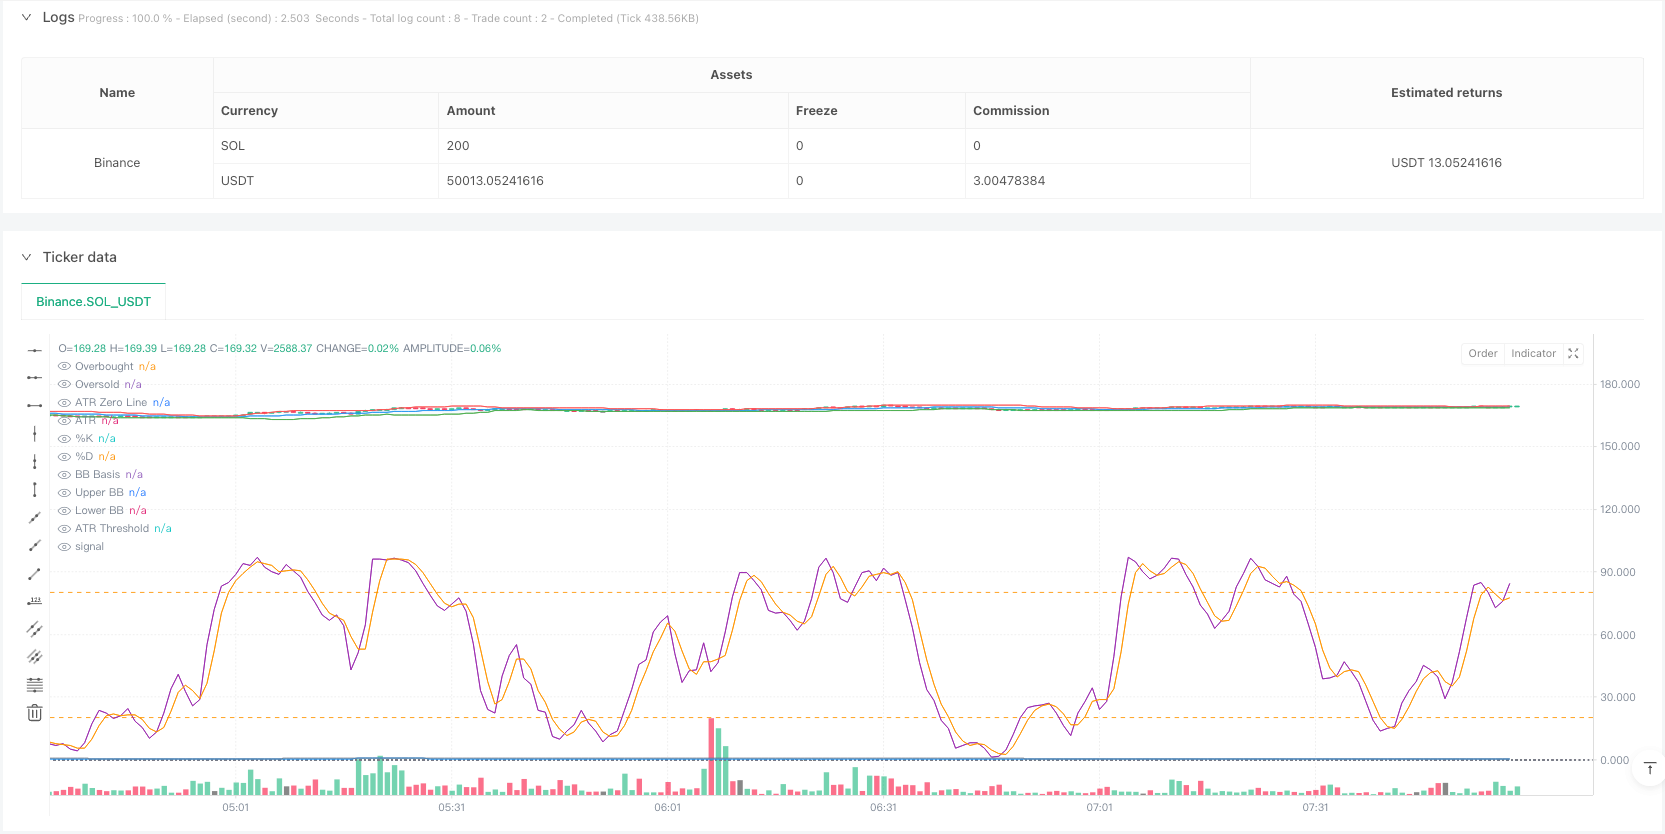
本策略是一个基于多重技术指标的智能交易系统,结合了布林带(Bollinger Bands)、随机指标(Stochastic Oscillator)和平均真实波幅(ATR)三大技术指标,通过对市场波动性、动量和趋势的综合分析来识别潜在的交易机会。该策略采用动态的止损和获利目标设置,能够根据市场波动情况自适应调整交易参数。
策略原理
策略的核心逻辑基于三重验证机制:
- 使用布林带进行价格波动区间的界定,当价格突破布林带下轨时识别超卖机会,突破上轨时识别超买机会
- 通过随机指标在超买区(>80)和超卖区(<20)进行动量确认,%K线与%D线的交叉作为入场信号
- 引入ATR指标作为波动性过滤器,确保在足够的市场波动性支持下进行交易
交易信号的产生需要满足以下条件: 买入条件:
- 价格收盘于布林带下轨以下
- 随机指标%K线在超卖区域向上穿越%D线
- ATR值高于设定的阈值,确认足够的市场波动性
卖出条件:
- 价格收盘于布林带上轨以上
- 随机指标%K线在超买区域向下穿越%D线
- ATR值维持在阈值以上,确认交易有效性
策略优势
- 多重技术指标交叉验证,显著提高交易信号的可靠性
- 动态的止损和获利目标设置,根据市场波动性自动调整风险管理参数
- 波动性过滤机制有效避免了低波动期间的假信号
- 指标参数可根据不同市场条件灵活调整,具有良好的适应性
- 策略逻辑清晰,易于理解和实施,适合各层次的交易者使用
策略风险
- 在市场剧烈波动时可能出现滑点,影响实际执行价格
- 多重指标的使用可能导致信号滞后,错过最佳入场时机
- 参数优化过度可能导致过拟合,影响策略在实盘中的表现
- 在趋势转折点可能出现虚假信号,需要配合其他分析工具
- 交易成本和佣金可能影响策略的整体收益表现
策略优化方向
- 引入趋势过滤器,如移动平均线交叉系统,以增强趋势确认
- 优化ATR阈值的动态调整机制,使其更好地适应不同市场环境
- 增加成交量指标验证,提高交易信号的可靠性
- 实现自适应参数优化,根据市场状态自动调整指标参数
- 添加时间过滤器,避免在市场波动较大的开盘和收盘时段交易
总结
该策略通过布林带、随机指标和ATR的组合应用,构建了一个完整的交易系统。策略的优势在于多重指标的交叉验证和动态风险管理,但同时也需要注意参数优化和市场环境适应性的问题。通过持续优化和完善,该策略有望在实际交易中取得稳定的收益表现。 ||
Overview
This strategy is an intelligent trading system based on multiple technical indicators, combining Bollinger Bands, Stochastic Oscillator, and Average True Range (ATR) to identify potential trading opportunities through comprehensive analysis of market volatility, momentum, and trends. The strategy employs dynamic stop-loss and profit targets that adapt to market volatility conditions.
Strategy Principles
The core logic is based on a triple verification mechanism:
- Using Bollinger Bands to define price volatility ranges, identifying oversold opportunities when price breaks below the lower band and overbought opportunities when it breaks above the upper band
- Momentum confirmation through Stochastic Oscillator in overbought (>80) and oversold (<20) regions, with %K and %D line crossovers as entry signals
- Incorporating ATR as a volatility filter to ensure trades are executed under sufficient market volatility
Trade signals require the following conditions: Buy conditions:
- Price closes below the lower Bollinger Band
- Stochastic %K line crosses above %D line in the oversold region
- ATR value exceeds the set threshold, confirming adequate market volatility
Sell conditions:
- Price closes above the upper Bollinger Band
- Stochastic %K line crosses below %D line in the overbought region
- ATR value maintains above threshold, confirming trade validity
Strategy Advantages
- Multiple technical indicator cross-validation significantly improves trading signal reliability
- Dynamic stop-loss and profit targets that automatically adjust risk management parameters based on market volatility
- Volatility filtering mechanism effectively avoids false signals during low volatility periods
- Indicator parameters can be flexibly adjusted for different market conditions, providing good adaptability
- Clear strategy logic that is easy to understand and implement, suitable for traders of all levels
Strategy Risks
- Potential slippage during intense market volatility affecting actual execution prices
- Multiple indicators may lead to signal lag, missing optimal entry points
- Over-optimization of parameters may result in overfitting, impacting strategy performance in live trading
- False signals may occur at trend turning points, requiring complementary analysis tools
- Trading costs and commissions may affect overall strategy returns
Strategy Optimization Directions
- Introduce trend filters, such as moving average crossover systems, to enhance trend confirmation
- Optimize the dynamic adjustment mechanism of ATR threshold for better adaptation to different market environments
- Add volume indicator verification to improve trading signal reliability
- Implement adaptive parameter optimization that automatically adjusts indicator parameters based on market conditions
- Add time filters to avoid trading during highly volatile market opening and closing periods
Summary
The strategy constructs a complete trading system through the combined application of Bollinger Bands, Stochastic Oscillator, and ATR. Its strengths lie in multiple indicator cross-validation and dynamic risk management, while attention must be paid to parameter optimization and market environment adaptability. Through continuous optimization and refinement, the strategy shows promise for achieving stable returns in actual trading.[/trans]
Source (PineScript)
/*backtest
start: 2025-02-13 00:00:00
end: 2025-02-19 08:00:00
period: 1m
basePeriod: 1m
exchanges: [{"eid":"Binance","currency":"SOL_USDT"}]
*/

//@version=5
strategy("Bollinger Bands + Stochastic Oscillator + ATR Strategy", overlay=true, default_qty_type=strategy.percent_of_equity, default_qty_value=10)

// Bollinger Bands Parameters
bb_length = 20
bb_mult = 2.0
basis = ta.sma(close, bb_length)
dev = bb_mult * ta.stdev(close, bb_length)
upper_bb = basis + dev
lower_bb = basis - dev

// Stochastic Oscillator Parameters
stoch_length = 14
k_smooth = 3
d_smooth = 3
stoch_k = ta.sma(ta.stoch(close, high, low, stoch_length), k_smooth)
stoch_d = ta.sma(stoch_k, d_smooth)

// ATR Parameters
atr_length = 14
atr_mult = 1.5
atr = ta.atr(atr_length)

// ATR Threshold based on ATR Moving Average
atr_ma = ta.sma(atr, atr_length)
atr_threshold = atr_ma * atr_mult

// Plot Bollinger Bands
plot(basis, color=color.blue, title="BB Basis")
p1 = plot(upper_bb, color=color.red, title="Upper BB")
p2 = plot(lower_bb, color=color.green, title="Lower BB")
fill(p1, p2, color=color.rgb(173, 216, 230, 90), title="BB Fill")

// Plot Stochastic Oscillator
hline(80, "Overbought", color=color.orange)
hline(20, "Oversold", color=color.orange)
plot(stoch_k, color=color.purple, title="%K")
plot(stoch_d, color=color.orange, title="%D")

// Plot ATR and ATR Threshold for Visualization
hline(0, "ATR Zero Line", color=color.gray, linestyle=hline.style_dotted)
plot(atr, title="ATR", color=color.blue)
plot(atr_threshold, title="ATR Threshold", color=color.gray, style=plot.style_stepline)

// Buy Condition:
// - Price closes below the lower Bollinger Band
// - Stochastic %K crosses above %D in oversold region
// - ATR is above the ATR threshold
buyCondition = close < lower_bb and ta.crossover(stoch_k, stoch_d) and stoch_k < 20 and atr > atr_threshold

// Sell Condition:
// - Price closes above the upper Bollinger Band
// - Stochastic %K crosses below %D in overbought region
// - ATR is above the ATR threshold
sellCondition = close > upper_bb and ta.crossunder(stoch_k, stoch_d) and stoch_k > 80 and atr > atr_threshold

// Plot Buy/Sell Signals
plotshape(series=buyCondition, title="Buy Signal", location=location.belowbar, color=color.green, style=shape.labelup, text="BUY")
plotshape(series=sellCondition, title="Sell Signal", location=location.abovebar, color=color.red, style=shape.labeldown, text="SELL")

// Execute Trades
if (buyCondition)
    strategy.entry("Long", strategy.long)

if (sellCondition)
    strategy.close("Long")

// Optional: Add Stop Loss and Take Profit
// Stop Loss at ATR-based distance
stop_level = close - atr_mult * atr
take_level = close + atr_mult * atr

if (buyCondition)
    strategy.exit("Take Profit/Stop Loss", from_entry="Long", stop=stop_level, limit=take_level)
Detail
https://www.fmz.com/strategy/483103
Last Modified
2025-02-21 13:42:44