
11 KiB
Name
多重技术指标动态适应性交易策略MTDAT-Multi-Technical-Indicator-Dynamic-Adaptive-Trading-Strategy-MTDAT
Author
ChaoZhang
Strategy Description
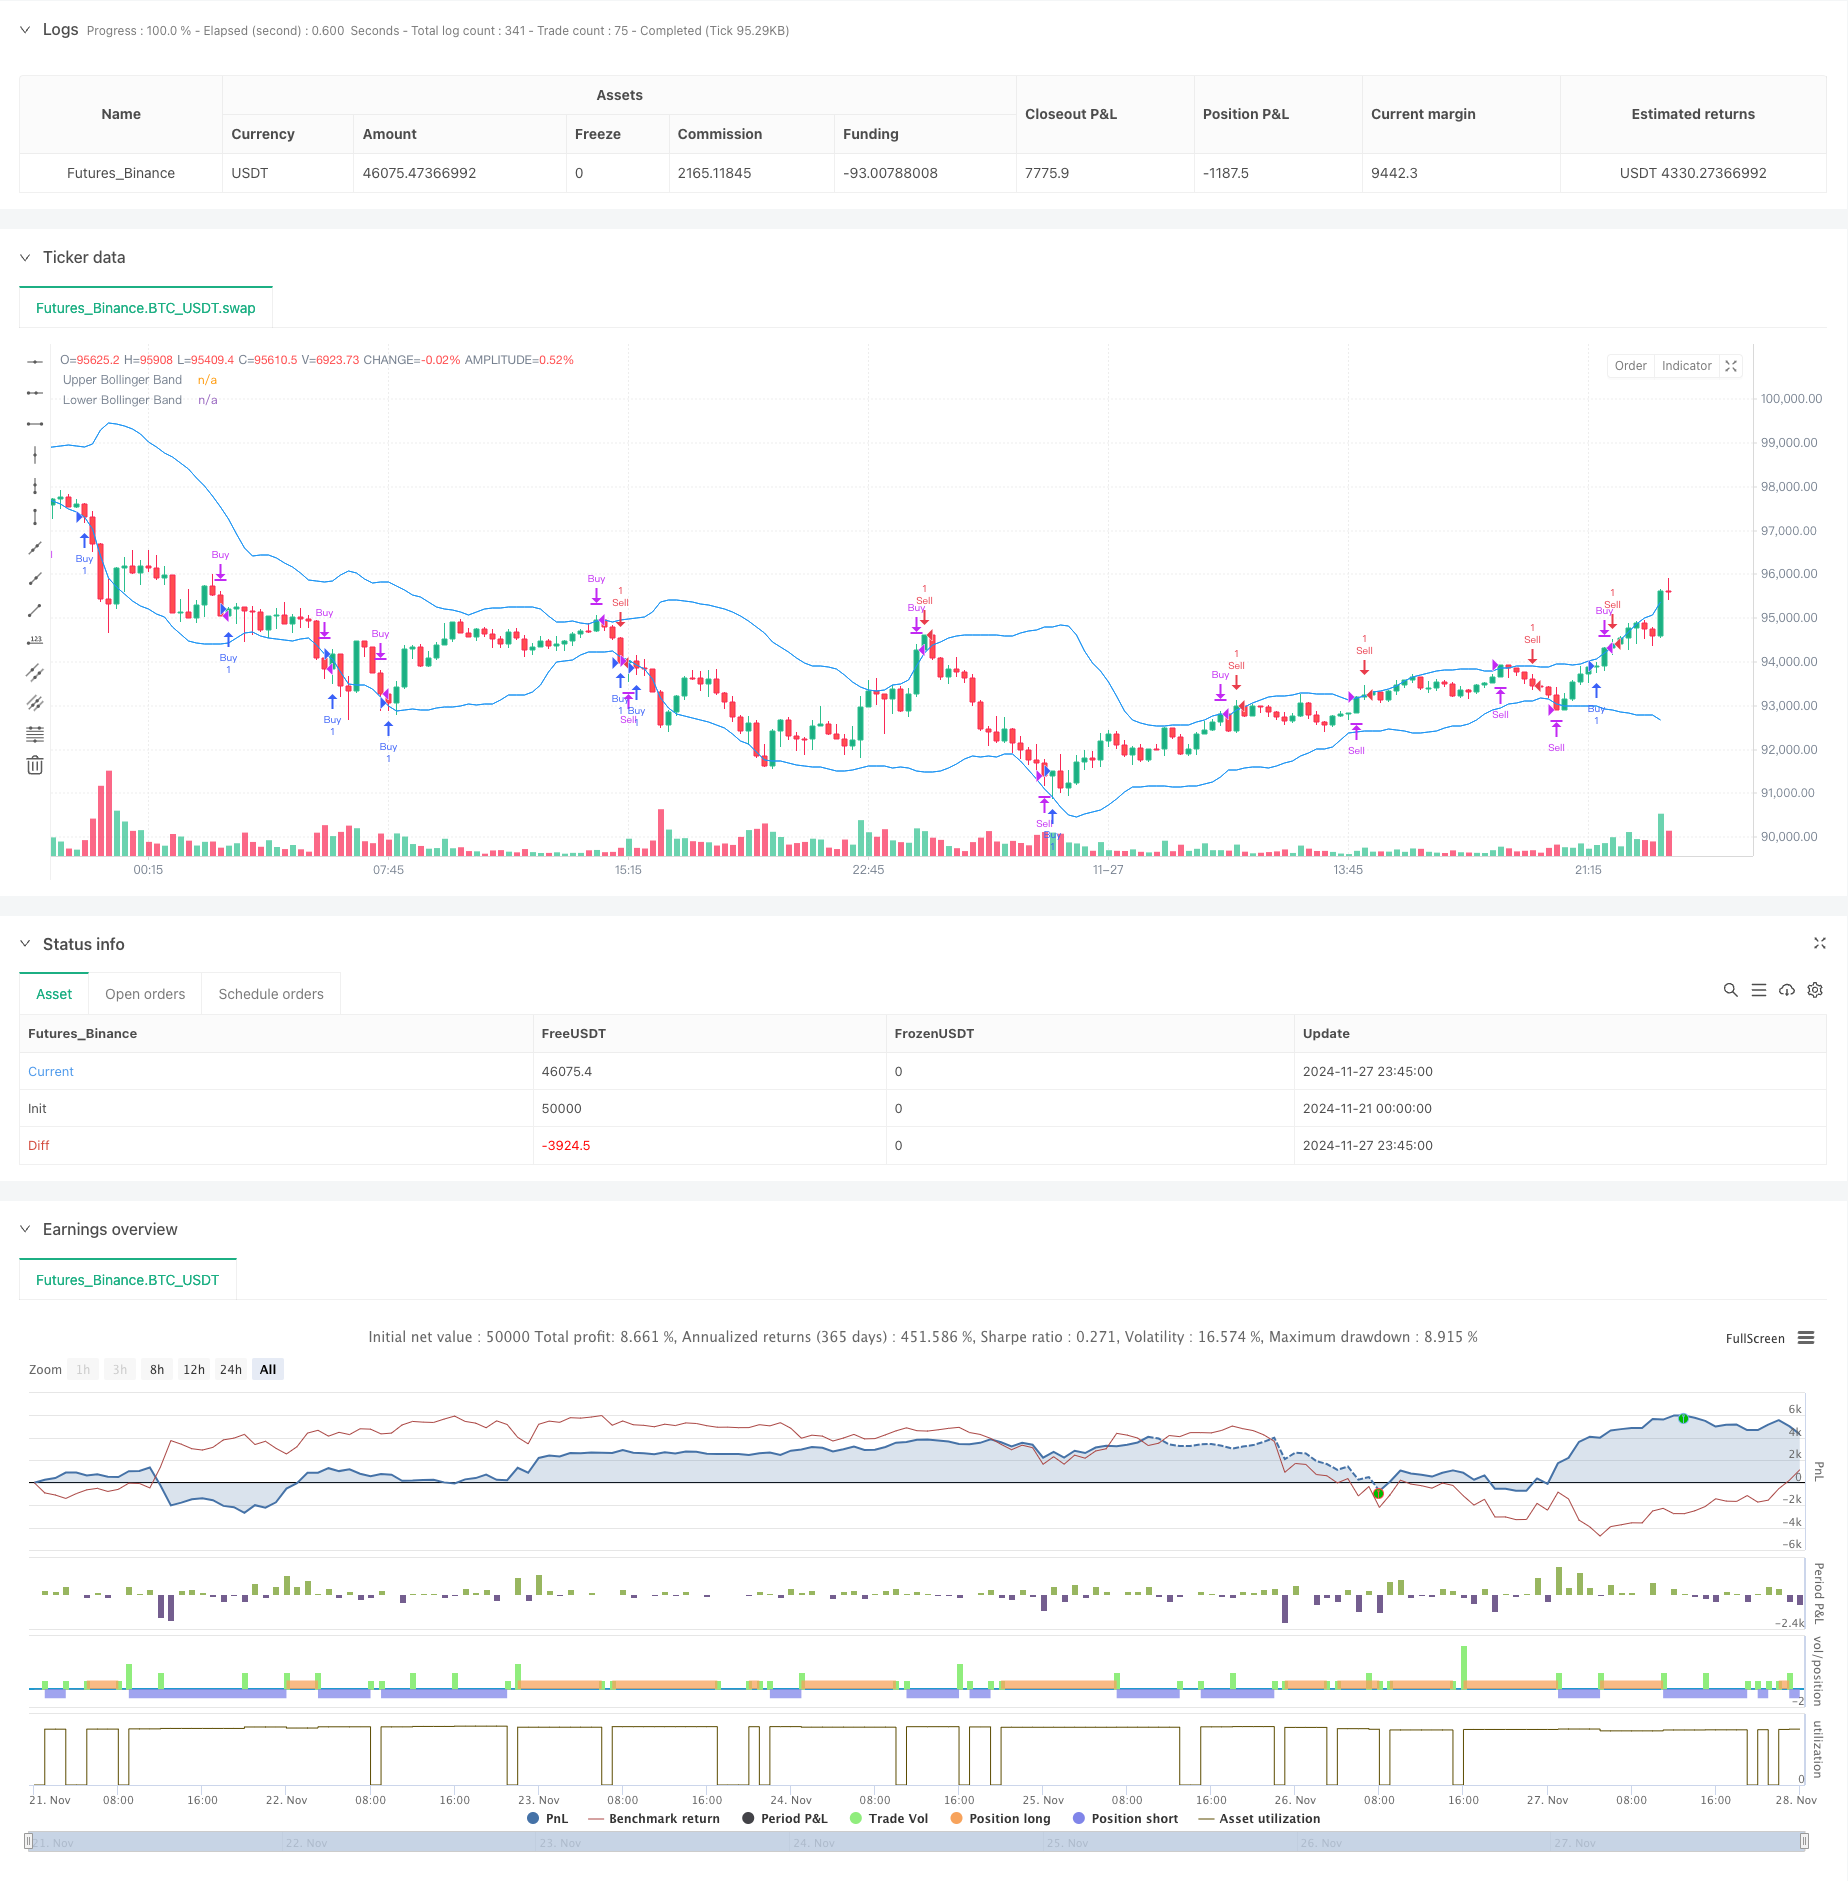
[trans]
概述
该策略是一个基于多重技术指标的综合交易系统,通过结合MACD、RSI、布林带和ATR等多个技术指标,实现对市场趋势和反转机会的捕捉。策略采用动态止损和获利方案,能够根据市场波动性自适应调整交易参数,在保证收益的同时有效控制风险。回测结果显示,该策略在过去三个月的测试期间实现了676.27%的收益率,展现出良好的市场适应性。
策略原理
策略采用多层技术指标验证系统,包括:
- MACD(12,26,9)用于捕捉动量转换信号,当MACD线上穿信号线时产生买入信号,下穿时产生卖出信号
- RSI(14)作为二级过滤器,在35以下视为超卖区域,65以上视为超买区域
- 布林带(20,2)用于识别价格波动区间,当价格触及下轨时考虑买入,触及上轨时考虑卖出
- ATR用于动态设置止损和获利水平,止损设为3倍ATR,获利目标设为5倍ATR
交易逻辑融合了趋势跟踪和反转交易两种策略,通过多重验证提高交易的准确性。系统会根据市场实时波动性自动调整止损和获利水平,实现风险管理的动态优化。
策略优势
- 多维度信号验证系统提高了交易的可靠性
- 动态止损获利方案适应不同市场环境
- 综合了趋势和反转两种交易思路,增加了交易机会
- 自动化的风险管理系统降低了人为判断错误
- 53.99%的胜率和1.44的利润因子显示策略具有稳定性
- 策略支持实时交易提醒,方便交易员操作
策略风险
- 多重指标可能导致信号滞后,在快速市场中错过机会
- 56.33%的最大回撤率需要较大的风险承受能力
- 交易频繁可能带来较高的交易成本
- 策略在剧烈波动市场中可能面临较大风险
风险控制建议:
- 严格执行资金管理计划
- 定期检查和调整参数
- 在重要数据公布期间暂停交易
- 设置每日最大损失限制
策略优化方向
-
参数优化:
- 考虑使用自适应周期的指标参数
- 优化ATR倍数设置,提高风险收益比
-
信号系统改进:
- 添加成交量指标验证
- 引入市场情绪指标
-
风险管理优化:
- 实现动态仓位管理
- 增加时间过滤器
-
技术改进:
- 添加市场波动率过滤器
- 优化进出场时机判断
总结
该策略通过多重技术指标的组合和动态风险管理系统,实现了较好的交易效果。虽然存在一定的回撤风险,但通过严格的风险控制和持续优化,策略展现出良好的市场适应性和稳定性。建议交易者在使用该策略时,严格执行风险管理制度,并根据市场变化适时调整参数。 ||
Overview
This strategy is a comprehensive trading system based on multiple technical indicators, combining MACD, RSI, Bollinger Bands, and ATR to capture both trend and reversal opportunities. The strategy employs dynamic stop-loss and profit-taking mechanisms, adapting trading parameters according to market volatility while effectively controlling risks. Backtesting results show a 676.27% return over the three-month testing period, demonstrating good market adaptability.
Strategy Principles
The strategy employs a multi-layer technical indicator validation system, including:
- MACD(12,26,9) for capturing momentum shift signals, generating buy signals when MACD line crosses above the signal line and sell signals when crossing below
- RSI(14) as a secondary filter, with readings below 35 considered oversold and above 65 overbought
- Bollinger Bands(20,2) for identifying price volatility ranges, considering buys at lower band touches and sells at upper band touches
- ATR for dynamic stop-loss and profit target setting, with stop-loss at 3x ATR and profit target at 5x ATR
The trading logic combines both trend-following and reversal trading strategies, improving accuracy through multiple validations. The system automatically adjusts stop-loss and profit levels based on real-time market volatility, optimizing risk management dynamically.
Strategy Advantages
- Multi-dimensional signal validation system improves trading reliability
- Dynamic stop-loss and profit-taking scheme adapts to different market conditions
- Combines trend and reversal trading approaches, increasing trading opportunities
- Automated risk management system reduces human judgment errors
- 53.99% win rate and 1.44 profit factor demonstrate strategy stability
- Strategy supports real-time trading alerts for convenient operation
Strategy Risks
- Multiple indicators may lead to signal lag, missing opportunities in fast markets
- 56.33% maximum drawdown requires significant risk tolerance
- Frequent trading may incur high transaction costs
- Strategy may face significant risks in highly volatile markets
Risk Control Recommendations:
- Strict implementation of money management plan
- Regular parameter review and adjustment
- Pause trading during major news releases
- Set daily maximum loss limits
Strategy Optimization Directions
-
Parameter Optimization:
- Consider using adaptive period indicator parameters
- Optimize ATR multiplier settings to improve risk-reward ratio
-
Signal System Improvements:
- Add volume indicator validation
- Incorporate market sentiment indicators
-
Risk Management Enhancement:
- Implement dynamic position sizing
- Add time-based filters
-
Technical Improvements:
- Add market volatility filters
- Optimize entry and exit timing
Summary
The strategy achieves good trading results through the combination of multiple technical indicators and dynamic risk management system. While there are drawdown risks, the strategy demonstrates good market adaptability and stability through strict risk control and continuous optimization. Traders are advised to strictly implement risk management protocols when using this strategy and adjust parameters according to market changes.[/trans]
Source (PineScript)
/*backtest
start: 2024-11-21 00:00:00
end: 2024-11-28 00:00:00
period: 15m
basePeriod: 15m
exchanges: [{"eid":"Futures_Binance","currency":"BTC_USDT"}]
*/

//@version=5
strategy("XAUUSD STRATEGY 10MIN", overlay=true)

// Spread Adjustment (38-point spread)
spread = 38 * syminfo.mintick

// MACD Calculation
[macdLine, signalLine, _] = ta.macd(close, 12, 26, 9)
macdBuy = ta.crossover(macdLine, signalLine)
macdSell = ta.crossunder(macdLine, signalLine)

// RSI Calculation
rsi = ta.rsi(close, 14)
rsiOverbought = rsi > 65
rsiOversold = rsi < 35

// Bollinger Bands Calculation
basis = ta.sma(close, 20)
dev = 2 * ta.stdev(close, 20)
upperBand = basis + dev
lowerBand = basis - dev

// ATR Calculation for Volatility-Based Stop Loss and Take Profit
atr = ta.atr(14)
stopLoss = 3 * atr
takeProfit = 5 * atr

// Variables to track entry price and line
var line entryLine = na
var int tradeNumber = 0
var string tradeType = ""
var string tradeSignalComment = ""

// Buy Condition
buyCondition = (macdBuy or rsiOversold or close < lowerBand)

// Sell Condition
sellCondition = (macdSell or rsiOverbought or close > upperBand)

// Strategy Entry and Alerts
if (buyCondition and strategy.opentrades == 0)  // Open a new buy trade
    // Remove the previous entry line if it exists
    // if not na(entryLine)
    //     line.delete(entryLine)

    // Adjust the entry price by adding the spread (ask price)
    buyPrice = close + spread

    // Enter a new buy trade at the ask price, and close it with the bid price
    strategy.entry("Buy", strategy.long, stop=buyPrice - stopLoss, limit=buyPrice + takeProfit, comment="Enter buy $" + str.tostring(buyPrice))
    tradeNumber := tradeNumber + 1  // Increment trade number
    tradeType := "Entry Long"
    tradeSignalComment := "Enter buy trade"

    // Plot new dotted entry line for the current trade
    // entryLine := line.new(bar_index, buyPrice, bar_index + 50, buyPrice, width=1, color=color.green, style=line.style_dotted)

    // Send alert for the buy entry
    alert("Trade No: " + str.tostring(tradeNumber) + "\n" +
          "Signal: " + tradeType + " - " + tradeSignalComment + "\n" +
          "Date/Time: " + str.format("{0,date,dd-MM-yyyy HH:mm}", time) + "\n" +
          "Price: " + str.tostring(buyPrice), alert.freq_once_per_bar_close)

if (sellCondition and strategy.opentrades == 0)  // Open a new sell trade
    // Remove the previous entry line if it exists
    // if not na(entryLine)
    //     line.delete(entryLine)

    // Adjust the entry price by subtracting the spread (bid price)
    sellPrice = close - spread

    // Enter a new sell trade at the bid price, and close it with the ask price
    strategy.entry("Sell", strategy.short, stop=sellPrice + stopLoss, limit=sellPrice - takeProfit, comment="Enter sell $" + str.tostring(sellPrice))
    tradeNumber := tradeNumber + 1  // Increment trade number
    tradeType := "Entry Short"
    tradeSignalComment := "Enter sell trade"

    // Plot new dotted entry line for the current trade
    // entryLine := line.new(bar_index, sellPrice, bar_index + 50, sellPrice, width=1, color=color.red, style=line.style_dotted)

    // Send alert for the sell entry
    alert("Trade No: " + str.tostring(tradeNumber) + "\n" +
          "Signal: " + tradeType + " - " + tradeSignalComment + "\n" +
          "Date/Time: " + str.format("{0,date,dd-MM-yyyy HH:mm}", time) + "\n" +
          "Price: " + str.tostring(sellPrice), alert.freq_once_per_bar_close)

// Exit conditions and alerts
if (strategy.position_size > 0 and sellCondition)  // Close buy when sell conditions met
    // Adjust the exit price by subtracting the spread (bid price)
    exitPrice = close - spread
    strategy.close("Buy", comment="Exit buy $" + str.tostring(exitPrice))

    // Remove the entry line when the trade is closed
    // if not na(entryLine)
    //     line.delete(entryLine)

    // Send alert for the buy exit
    tradeType := "Exit Long"
    tradeSignalComment := "Exit buy trade"
    alert("Trade No: " + str.tostring(tradeNumber) + "\n" +
          "Signal: " + tradeType + " - "  + tradeSignalComment + "\n" +
          "Date/Time: " + str.format("{0,date,dd-MM-yyyy HH:mm}", time) + "\n" +
          "Price: " + str.tostring(exitPrice), alert.freq_once_per_bar_close)

if (strategy.position_size < 0 and buyCondition)  // Close sell when buy conditions met
    // Adjust the exit price by adding the spread (ask price)
    exitPrice = close + spread
    strategy.close("Sell", comment="Exit sell $" + str.tostring(exitPrice))

    // Remove the entry line when the trade is closed
    // if not na(entryLine)
    //     line.delete(entryLine)

    // Send alert for the sell exit
    tradeType := "Exit Short"
    tradeSignalComment := "Exit sell trade"
    alert("Trade No: " + str.tostring(tradeNumber) + "\n" +
          "Signal: " + tradeType + " - " + tradeSignalComment + "\n" +
          "Date/Time: " + str.format("{0,date,dd-MM-yyyy HH:mm}", time) + "\n" +
          "Price: " + str.tostring(exitPrice), alert.freq_once_per_bar_close)

// Plot Indicators
plot(upperBand, title="Upper Bollinger Band", color=color.blue)
plot(lowerBand, title="Lower Bollinger Band", color=color.blue)
Detail
https://www.fmz.com/strategy/473348
Last Modified
2024-11-29 14:54:57