
8.7 KiB
Name
多重技术指标动态波段交易策略-Multi-Technical-Indicator-Dynamic-Wave-Trading-Strategy
Author
ChaoZhang
Strategy Description
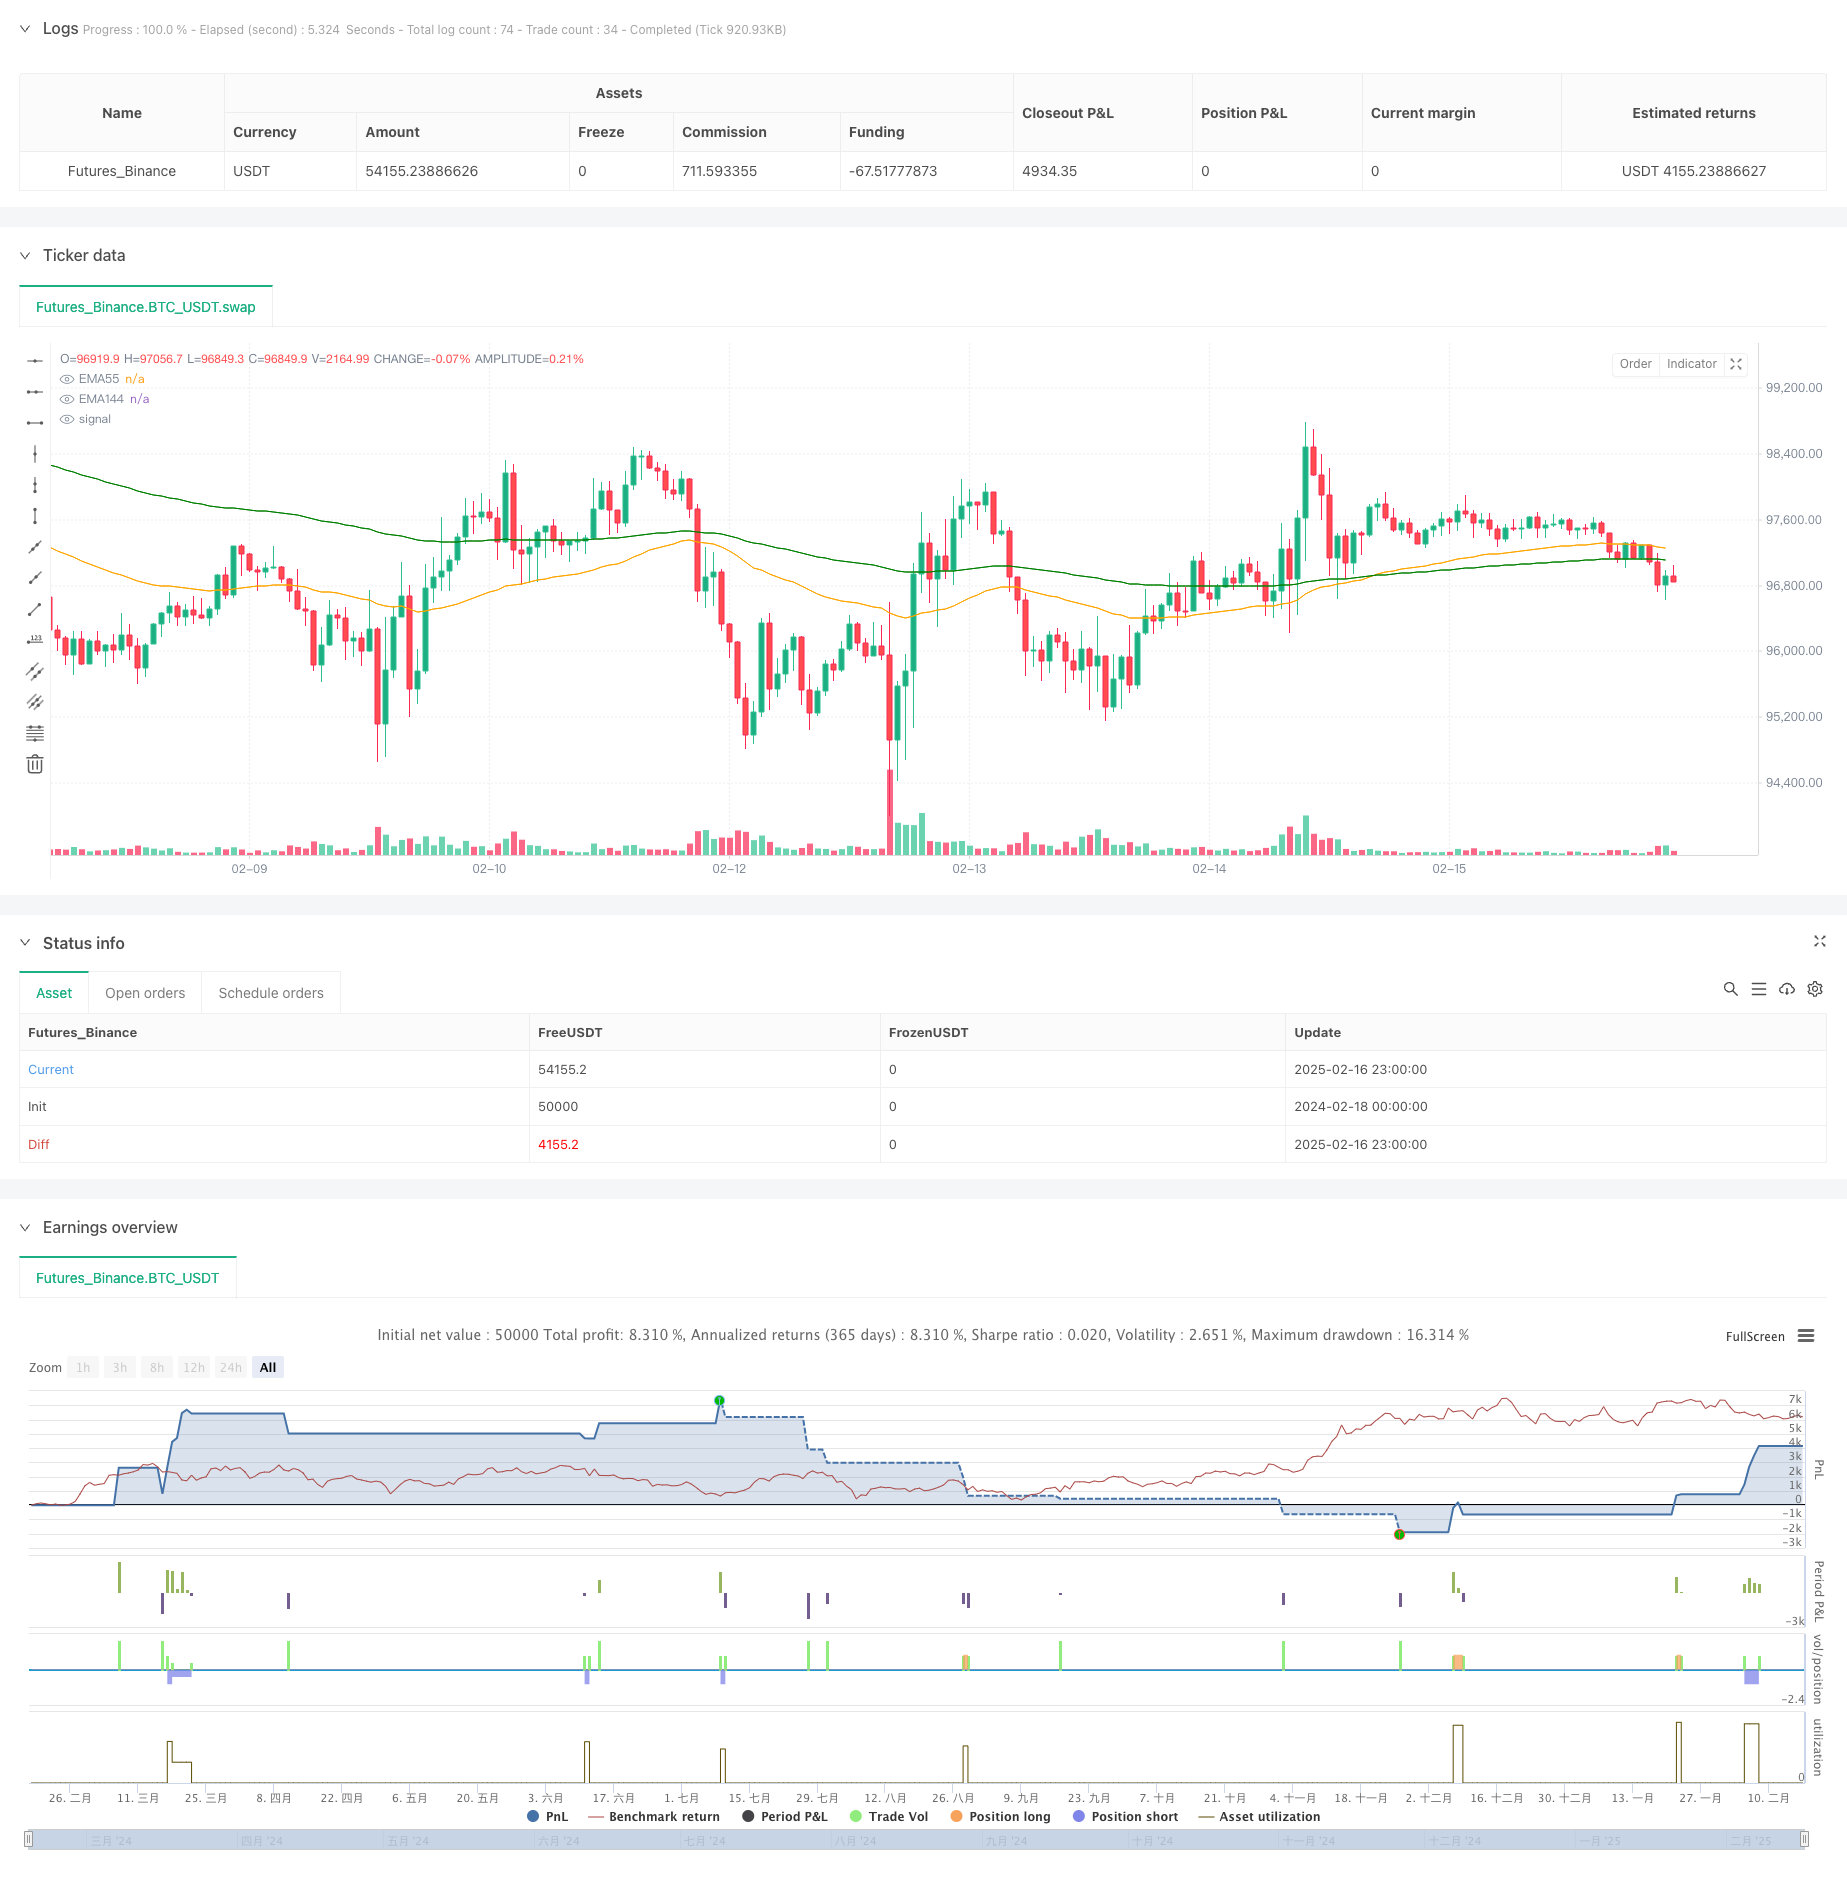
[trans]
概述
这是一个基于多重技术指标的动态波段交易策略,主要结合了趋势跟踪和波段操作的特点。策略通过EMA、ADX、RSI和MACD等多个技术指标的协同配合,在市场中寻找高胜算的交易机会。系统采用动态止损和分批止盈的方式来管理风险和获利。
策略原理
策略的核心逻辑基于以下几个关键要素:
- 趋势判断:使用EMA55和EMA144的交叉关系确定市场趋势方向,并结合ADX指标强度(阈值30)进行趋势确认。
- 入场时机:通过RSI指标识别超买超卖区域(超卖45,超买55),用于判断回调买入和反弹做空机会。
- 止损机制:采用基于ATR的动态止损,止损距离为1.5倍ATR,可以根据市场波动自适应调整。
- 获利策略:使用50周期最高/最低价作为止盈目标,采用50%仓位分批止盈的方式。
策略优势
- 多重指标验证:通过EMA、ADX、RSI等多个指标的配合使用,提高了交易信号的可靠性。
- 动态风险管理:基于ATR的动态止损可以适应不同市场环境,提供更好的风险控制。
- 渐进式获利:采用分批止盈的方式,既能锁定部分利润,又不会过早退出强势行情。
- 趋势确认:加入ADX指标过滤,避免在横盘震荡市场频繁交易。
策略风险
- 假突破风险:在市场波动加剧时可能出现误判,建议增加成交量确认。
- 滑点损失:在市场快速波动时,动态止损可能面临较大滑点。
- 横盘损失:虽然有ADX过滤,但在震荡市场仍可能产生连续小额亏损。
- 信号滞后:多重指标组合可能导致入场信号滞后,错过最佳建仓时机。
策略优化方向
- 指标参数优化:建议对EMA周期、RSI阈值等参数进行历史回测优化。
- 止损优化:可考虑增加移动止损,更好地保护利润。
- 仓位管理:建议引入波动率自适应的仓位管理系统。
- 市场适应性:可增加市场环境分类,在不同市场条件下使用不同的参数组合。
总结
该策略通过多重技术指标的协同配合,构建了一个完整的交易系统。策略既注重趋势把握,又重视风险控制,通过动态止损和分批止盈的方式来平衡风险和收益。虽然存在一定的优化空间,但整体而言是一个逻辑严谨、实用性强的交易策略。 ||
Overview
This is a dynamic wave trading strategy based on multiple technical indicators, combining trend following and wave operation characteristics. The strategy seeks high-probability trading opportunities through the coordination of multiple technical indicators including EMA, ADX, RSI, and MACD. The system manages risk and profit through dynamic stop-loss and batch profit-taking methods.
Strategy Principle
The core logic of the strategy is based on the following key elements:
- Trend Judgment: Uses EMA55 and EMA144 crossover relationships to determine market trend direction, combined with ADX indicator strength (threshold 30) for trend confirmation.
- Entry Timing: Identifies oversold and overbought areas through RSI indicator (oversold 45, overbought 55) to judge pullback buying and rebound shorting opportunities.
- Stop-Loss Mechanism: Adopts ATR-based dynamic stop-loss, with a stop-loss distance of 1.5 times ATR, which can adaptively adjust according to market volatility.
- Profit Strategy: Uses 50-period high/low prices as profit targets, adopting a 50% position batch profit-taking approach.
Strategy Advantages
- Multiple Indicator Verification: Improves trading signal reliability through the combined use of multiple indicators including EMA, ADX, and RSI.
- Dynamic Risk Management: ATR-based dynamic stop-loss can adapt to different market environments, providing better risk control.
- Progressive Profit-Taking: The batch profit-taking approach allows both securing partial profits and maintaining positions in strong trends.
- Trend Confirmation: Inclusion of ADX indicator filtering helps avoid frequent trading in sideways markets.
Strategy Risks
- False Breakout Risk: Misjudgments may occur during increased market volatility, suggesting the addition of volume confirmation.
- Slippage Loss: Dynamic stop-loss may face significant slippage during rapid market movements.
- Sideways Market Losses: Despite ADX filtering, consecutive small losses may still occur in oscillating markets.
- Signal Lag: Multiple indicator combinations may lead to delayed entry signals, missing optimal position-building opportunities.
Strategy Optimization Directions
- Indicator Parameter Optimization: Recommend historical backtesting optimization for parameters like EMA periods and RSI thresholds.
- Stop-Loss Optimization: Consider adding trailing stop-loss for better profit protection.
- Position Management: Suggest introducing a volatility-adaptive position management system.
- Market Adaptability: Can add market environment classification to use different parameter combinations under different market conditions.
Summary
The strategy constructs a complete trading system through the coordination of multiple technical indicators. It emphasizes both trend capture and risk control, balancing risk and return through dynamic stop-loss and batch profit-taking methods. While there is room for optimization, it is overall a logically rigorous and practical trading strategy.[/trans]
Source (PineScript)
/*backtest
start: 2024-02-18 00:00:00
end: 2025-02-17 00:00:00
period: 1h
basePeriod: 1h
exchanges: [{"eid":"Futures_Binance","currency":"BTC_USDT"}]
*/

//@version=6
strategy("专业级交易系统", overlay=true, max_labels_count=500)
// ===== 参数设置 =====
x1 = input.float(1.5,"atr倍数",step=0.1)
x2 = input.int(50,"k线数量",step=1)
// EMA参数
ema55_len = input.int(55, "EMA55长度")
ema144_len = input.int(144, "EMA144长度")
// ADX参数
adx_len = input.int(14, "ADX长度")
adx_threshold = input.float(30.0, "ADX趋势过滤")
// RSI参数
rsi_len = input.int(14, "RSI长度")
rsi_oversold = input.float(45.0, "RSI超卖阈值")
rsi_overbuy = input.float(55.0, "RSI超买阈值")
// MACD参数
macd_fast = input.int(12, "MACD快线")
macd_slow = input.int(26, "MACD慢线")
macd_signal = input.int(9, "MACD信号线")
// ===== 指标计算 =====
// EMA计算
ema55 = ta.ema(close, ema55_len)
ema144 = ta.ema(close, ema144_len)
// ADX计算(使用标准函数)
[di_plus, di_minus, adx] = ta.dmi(adx_len, adx_len)
// RSI计算
rsi = ta.rsi(close, rsi_len)
// MACD计算(修正参数顺序)
[macdLine, signalLine, histLine] = ta.macd(close, macd_fast, macd_slow, macd_signal)
// ===== 信号逻辑 =====
// 趋势条件:EMA55 > EMA144 且 ADX > 30
trendCondition = ema55 > ema144 and adx > adx_threshold
trendConditions = ema55 < ema144 and adx > adx_threshold
// 回调条件:RSI < 45 且 MACD柱状线 > -0.002
pullbackCondition = rsi < rsi_oversold
pullbackConditions = rsi > rsi_overbuy
// 综合信号
entrySignal = trendCondition and pullbackCondition
entrySignals = trendConditions and pullbackConditions

// ===== 可视化 =====
// 绘制EMA
plot(ema55, "EMA55", color=color.new(#FFA500, 0))
plot(ema144, "EMA144", color=color.new(#008000, 0))
//plotshape(series=entrySignal,title="买入信号",location=location.belowbar,color=color.new(color.green, 0),style=shape.labelup,text="BUY",textcolor=color.new(color.white, 0))
s = strategy.position_avg_price ,s1 = strategy.position_size
le = false
le := low < ema144 and low[1] > ema144 and ema55 > ema144 ? true : s1 > 0 ? false : le[1]
se = false
se := high > ema144 and high[1] < ema144 and ema55 < ema144 ? true : s1 < 0 ? false : se[1]
if entrySignal and low < ema144 and close > ema144
    strategy.entry("l",strategy.long)
strategy.exit("止盈一半","l",limit= ta.highest(x2),qty_percent = 50)
if s1 > 0 and low < (close - x1*ta.atr(12))[1]
    strategy.close_all("动态止损")

if entrySignals and high > ema144 and close < ema144
    strategy.entry("s",strategy.short)
strategy.exit("止盈一半","s",limit = ta.lowest(x2),qty_percent = 50)
if s1 < 0 and high > (close + x1*ta.atr(12))[1]
    strategy.close_all("动态止损")

//plotshape(series=entrySignal,title="买入信号",location=location.belowbar,color=color.new(color.green, 0),style=shape.labelup,text="BUY",textcolor=color.new(color.white, 0))
//plot(close+x1*ta.atr(12))
//plot(close-x1*ta.atr(12))
//bgcolor(le ? color.red:na)
Detail
https://www.fmz.com/strategy/482499
Last Modified
2025-02-18 17:13:58