
27 KiB
Name
多重技术指标动态止损期货交易策略-Multi-Technical-Indicator-Dynamic-Stop-Loss-Futures-Trading-Strategy
Author
ianzeng123
Strategy Description
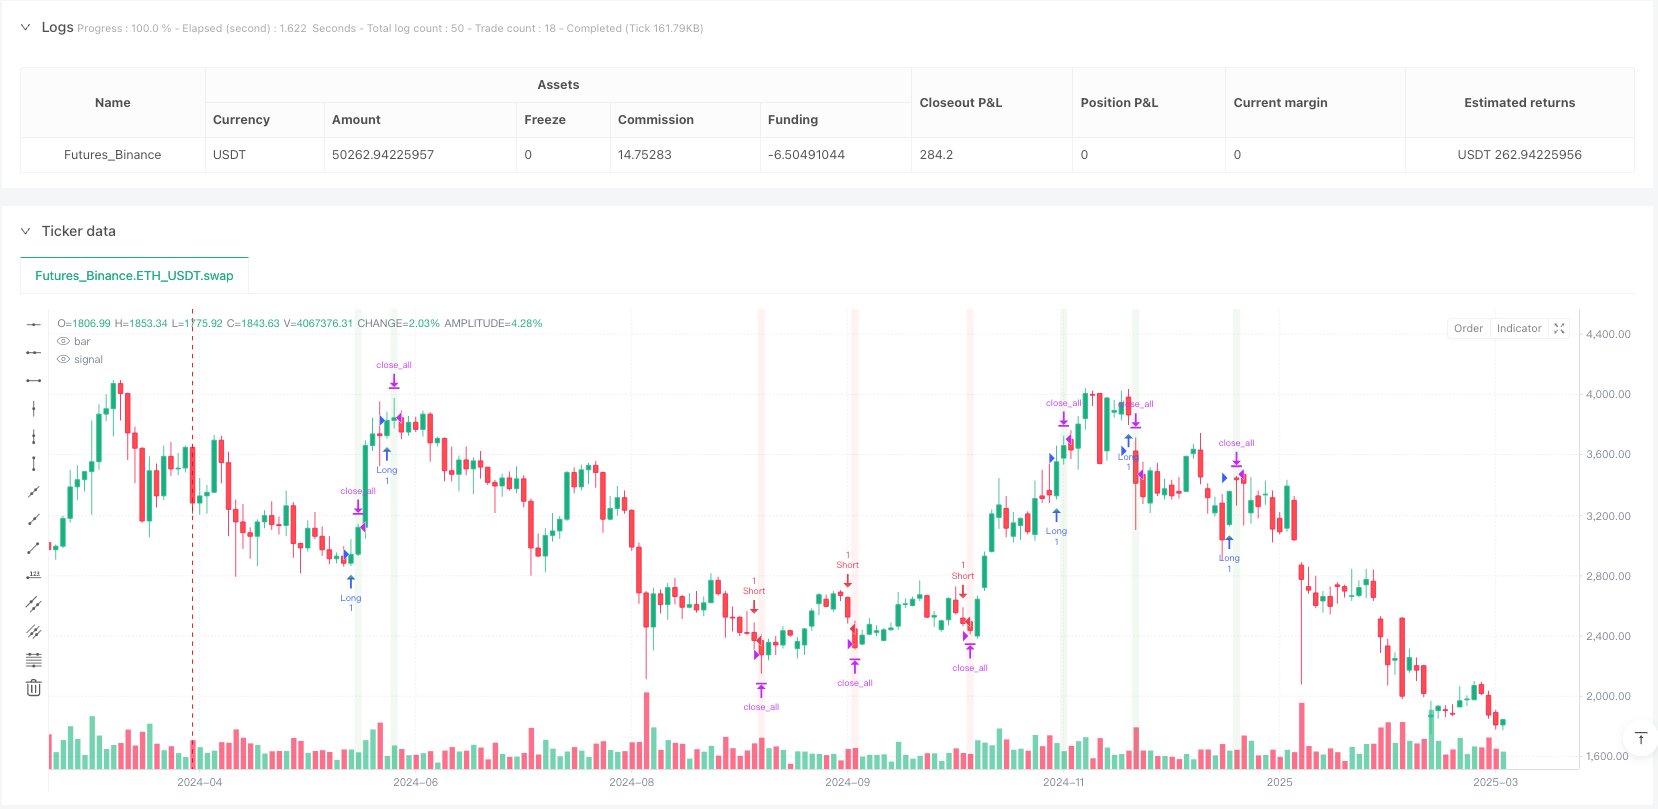
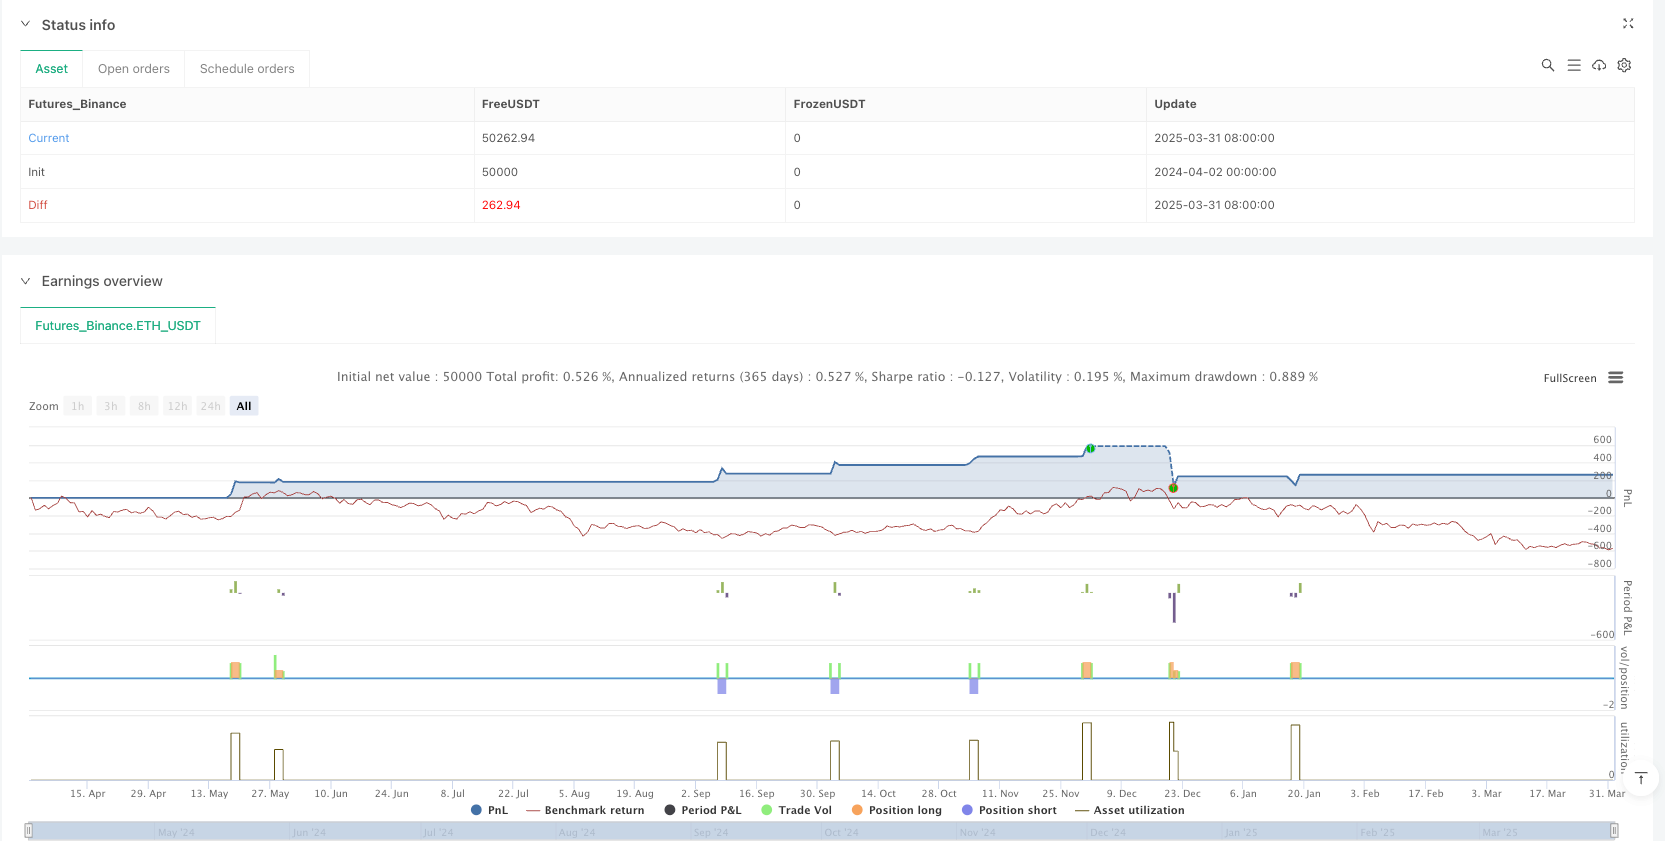
[trans]
策略概述
该策略是一种高级的期货交易系统,它结合了多个技术条件和更高时间框架分析来识别高概率交易机会。这种策略采用基于多重条件汇合的方法,要求多个技术条件同时满足才会进入交易。它整合了几个先进的技术概念,包括公允价值缺口(FVG)、订单区块(Order Blocks)、流动性扫描(Liquidity Sweeps)和结构突破(BOS)信号,同时利用不同时间周期的指标确认趋势方向。
策略原理
该策略的核心是使用多种技术分析方法的组合,以确保只有当多个指标同时给出信号时才进入交易。具体来说,策略包含以下几个关键组件:
- 公允价值缺口(FVG) - 当两个蜡烛之间出现显著的价格差距时被识别,表明市场可能存在未被填补的空间。
- 订单区块 - 这些是价格形成反转的关键区域,通常表现为强烈的拒绝蜡烛,后续成为支撑或阻力区。
- 流动性扫描 - 识别市场突破前期高点或低点后随即反转的情况,这通常表明大型机构在收集流动性。
- 结构突破(BOS) - 当价格突破前期结构,形成更高的高点或更低的低点时出现。
- 高时间周期趋势确认 - 利用15分钟和60分钟时间周期的EMA(指数移动平均线)来确认总体趋势方向。
策略只有在至少两个基本条件(在调试模式下为一个)加上结构突破信号,同时与更高时间周期趋势一致的情况下才会生成入场信号。
风险管理方面,该策略使用ATR(平均真实波幅)来设置动态止损位置,止损距离通常为ATR值的1.5倍。这一方法在高波动时增加止损距离,在低波动时减少距离,使止损更加智能。
对于获利了结,策略采用分批获利方法,在达到与风险等量(1R)的利润时获利50%的头寸,同时将剩余头寸的止损移至保本位置,从而创造无风险交易的机会。此外,还设有基于时间的退出机制,如果交易在指定时间(默认30分钟)内未能朝有利方向移动,将自动关闭。
另外,该策略还包含账户管理功能,当账户盈利达到预设目标(3000美元)或触发尾随止损(账户超过2500美元盈利后开始跟踪)时自动退出所有头寸。
策略优势
经过对代码的深入分析,我们可以总结出以下几个明显的优势:
- 多重确认系统 - 要求多个技术条件同时满足才会入场,有效减少了虚假信号并提高了交易质量。
- 智能风险管理 - 使用基于ATR的动态止损,比固定点位或百分比止损更能适应市场波动性的变化。
- 高时间周期趋势过滤 - 利用更高时间周期的趋势方向,只在趋势方向上交易,避免了逆势交易。
- 分段获利策略 - 通过分批获利和移动止损至保本位置,既保证了部分利润锁定,又为剩余头寸提供了无风险机会。
- 时间基础退出机制 - 自动退出无效交易,避免资金长时间被套牢在没有动力的交易中。
- 整体账户管理 - 通过设置利润目标和尾随止损,保护整体账户盈利,实现稳健的资金管理。
- 适应性强 - 通过多个参数提供了高度的灵活性,可以根据不同的市场情况和交易风格进行调整。
- 专业技术指标整合 - 结合了多种高级技术分析概念,通常只有专业交易者才会使用。
策略风险
尽管该策略设计精良,但仍然存在一些潜在风险,包括:
- 参数优化风险 - 策略依赖于多个参数设置,如果过度优化可能导致过拟合,在未来市场条件下表现不佳。解决方法是使用足够长的测试周期,并进行前向测试。
- 市场环境依赖 - 该策略可能在趋势市场中表现出色,但在区间震荡市场中可能产生更多虚假信号。解决方法是添加市场环境过滤器,在识别为震荡市场时调整交易频率或完全停止交易。
- 执行滑点风险 - 在高波动期间,入场和出场价格可能与预期存在较大差异,影响策略表现。解决方法是在回测中模拟真实滑点,并在实际交易中使用限价单代替市价单。
- 技术故障风险 - 自动化交易系统可能面临技术故障或网络中断。解决方法是建立备份系统和手动干预机制。
- 复杂度管理 - 策略的复杂性可能导致难以诊断问题或理解某些交易为何失败。解决方法是保持详细的交易日志并定期分析策略表现。
- 市场流动性风险 - 在特定的市场条件下,如重要新闻发布前后,流动性可能迅速下降,导致更大的滑点或无法退出头寸。解决方法是避开重要经济数据发布时段交易,或在这些时段降低头寸规模。
策略优化方向
基于对代码的分析,以下是几个潜在的优化方向:
- 增强趋势识别 - 当前策略使用简单的EMA交叉来确定趋势,可以考虑增加其他趋势指标如ADX(平均方向指数)来确认趋势强度,因为强趋势市场通常提供更好的交易机会。
- 市场状态适应 - 添加市场状态识别机制,在不同的市场环境(趋势、区间、高波动、低波动)中自动调整策略参数。这样可以使策略更加灵活,适应不同的市场条件。
- 优化入场时机 - 考虑添加动量指标如RSI或随机指标,确保在趋势方向上进入时,也避免在过度超买或超卖的情况下入场,从而减少反向风险。
- 改进获利策略 - 当前固定的1R获利可能过于保守或过于激进,可以考虑基于波动性或支撑/阻力水平来动态调整获利目标,在波动性较大时设置更远的目标。
- 风险管理精细化 - 引入动态头寸大小调整机制,根据近期策略表现和市场波动性自动调整风险敞口,在策略表现良好时增加风险,在表现不佳时减少风险。
- 添加日内时间过滤器 - 期货市场在不同的时间段有不同的特性,添加时间过滤器可以避开流动性差或无方向性的时段。
- 整合市场情绪指标 - 添加VIX等市场情绪指标,在极端情绪时调整策略参数或暂停交易。
- 优化代码效率 - 当前代码中有一些循环操作可能会影响执行效率,尤其是在更小的时间框架上。优化这些循环可以提高策略的响应速度。
总结
这是一个设计精良的多指标期货交易策略,融合了多种先进的技术分析概念,并且具有完善的风险管理和资金管理功能。它通过要求多个条件同时满足和高时间周期趋势确认来减少虚假信号,同时使用基于ATR的动态止损和分批获利策略来优化风险回报比。
该策略的主要优势在于其多层确认系统和智能风险管理,使其能够在保持较低风险的同时捕捉高概率的交易机会。然而,策略的复杂性也带来了参数优化和市场适应性的挑战,需要通过持续监控和定期调整来保持其有效性。
通过实施建议的优化措施,尤其是增强市场状态适应能力和改进风险管理系统,该策略有潜力在不同市场环境下保持稳定的表现。总的来说,这是一个适合有经验的交易者使用的先进策略,通过适当的监控和调整,可以成为交易系统中的有力工具。 ||
Strategy Overview
This strategy is an advanced futures trading system that combines multiple technical conditions and higher timeframe analysis to identify high-probability trading opportunities. The strategy employs a confluence-based approach, requiring multiple technical conditions to align before entering a trade. It integrates several sophisticated technical concepts including Fair Value Gaps (FVG), Order Blocks, Liquidity Sweeps, and Break of Structure (BOS) signals, while utilizing multi-timeframe indicators to confirm trend direction.
Strategy Principles
The core of this strategy is the combination of multiple technical analysis methods to ensure trades are only entered when several indicators align. Specifically, the strategy includes the following key components:
- Fair Value Gaps (FVG) - Identified when there is a significant price gap between two candles, indicating potential unfilled space in the market.
- Order Blocks - These are key areas where price formed a reversal, typically shown as strong rejection candles that later become support or resistance zones.
- Liquidity Sweeps - Identifies instances where the market breaks previous highs or lows and then quickly reverses, typically indicating institutional collection of liquidity.
- Break of Structure (BOS) - Occurs when price breaks a previous structure, forming higher highs or lower lows.
- Higher Timeframe Trend Confirmation - Uses 15-minute and 60-minute timeframe EMAs (Exponential Moving Averages) to confirm the overall trend direction.
The strategy only generates entry signals when at least two basic conditions (one in debug mode) plus a Break of Structure signal are present, and these align with the higher timeframe trend.
For risk management, the strategy uses ATR (Average True Range) to set dynamic stop-loss positions, typically at 1.5 times the ATR value. This approach increases stop distance during high volatility and reduces it during low volatility, making the stops more intelligent.
For profit-taking, the strategy employs a partial profit approach, taking 50% of the position at a profit equal to the risk (1R), while moving the stop-loss for the remaining position to breakeven, creating a risk-free opportunity. Additionally, there's a time-based exit mechanism that automatically closes trades if they don't move favorably within a specified time (default 30 minutes).
Furthermore, the strategy includes account management features that automatically exit all positions when the account profit reaches a preset target ($3,000) or triggers a trailing stop (which begins tracking after the account exceeds $2,500 in profit).
Strategy Advantages
After deep analysis of the code, we can summarize the following clear advantages:
- Multiple Confirmation System - Requiring several technical conditions to be met simultaneously reduces false signals and improves trade quality.
- Intelligent Risk Management - Using ATR-based dynamic stops adapts better to market volatility changes than fixed point or percentage stops.
- Higher Timeframe Trend Filtering - Utilizing higher timeframe trend direction avoids counter-trend trading by only trading in the direction of the trend.
- Partial Profit Strategy - Through partial profit-taking and moving stops to breakeven, the strategy both secures partial profits and creates risk-free opportunities for remaining positions.
- Time-Based Exit Mechanism - Automatically exits ineffective trades, preventing capital from being tied up in trades without momentum.
- Overall Account Management - Protects overall account profits through profit targets and trailing stops, achieving robust capital management.
- High Adaptability - Offers high flexibility through multiple parameters that can be adjusted according to different market conditions and trading styles.
- Professional Technical Indicator Integration - Combines multiple advanced technical analysis concepts typically used only by professional traders.
Strategy Risks
Despite its sophisticated design, there are several potential risks, including:
- Parameter Optimization Risk - The strategy relies on multiple parameter settings, which if over-optimized could lead to overfitting and poor performance in future market conditions. The solution is to use sufficiently long testing periods and conduct forward testing.
- Market Environment Dependency - The strategy may perform excellently in trending markets but could generate more false signals in range-bound markets. The solution is to add market environment filters and adjust trading frequency or stop trading entirely when a ranging market is identified.
- Execution Slippage Risk - During high volatility periods, entry and exit prices may differ significantly from expectations, affecting strategy performance. The solution is to simulate realistic slippage in backtesting and use limit orders instead of market orders in actual trading.
- Technical Failure Risk - Automated trading systems may face technical failures or network interruptions. The solution is to establish backup systems and manual intervention mechanisms.
- Complexity Management - The strategy's complexity may make it difficult to diagnose problems or understand why certain trades failed. The solution is to maintain detailed trading logs and regularly analyze strategy performance.
- Market Liquidity Risk - Under specific market conditions, such as before and after important news releases, liquidity may rapidly decrease, leading to greater slippage or inability to exit positions. The solution is to avoid trading during major economic data releases or reduce position sizes during these periods.
Strategy Optimization Directions
Based on code analysis, here are several potential optimization directions:
- Enhanced Trend Identification - The current strategy uses simple EMA crossovers to determine trends; consider adding other trend indicators like ADX (Average Directional Index) to confirm trend strength, as strong trending markets typically provide better trading opportunities.
- Market State Adaptation - Add market state recognition mechanisms to automatically adjust strategy parameters in different market environments (trending, ranging, high volatility, low volatility). This would make the strategy more flexible and adaptive to different market conditions.
- Optimized Entry Timing - Consider adding momentum indicators like RSI or stochastic oscillators to ensure that when entering in the trend direction, we also avoid entering in oversold or overbought conditions, thereby reducing reversal risk.
- Improved Profit Strategy - The current fixed 1R profit target may be too conservative or too aggressive; consider dynamically adjusting profit targets based on volatility or support/resistance levels, setting farther targets during higher volatility.
- Refined Risk Management - Introduce dynamic position sizing adjustment mechanisms that automatically adjust risk exposure based on recent strategy performance and market volatility, increasing risk when the strategy performs well and reducing it when performance declines.
- Add Intraday Time Filters - Futures markets have different characteristics during different time periods; adding time filters can avoid periods with poor liquidity or directionless markets.
- Integrate Market Sentiment Indicators - Add market sentiment indicators like VIX to adjust strategy parameters or pause trading during extreme sentiment situations.
- Optimize Code Efficiency - Some loop operations in the current code may affect execution efficiency, especially on smaller timeframes. Optimizing these loops can improve strategy response speed.
Summary
This is a well-designed multi-indicator futures trading strategy that integrates various advanced technical analysis concepts and features comprehensive risk and capital management functions. It reduces false signals by requiring multiple conditions to align simultaneously and higher timeframe trend confirmation, while using ATR-based dynamic stops and partial profit strategies to optimize the risk-reward ratio.
The strategy's main advantages lie in its multi-layered confirmation system and intelligent risk management, allowing it to capture high-probability trading opportunities while maintaining relatively low risk. However, the complexity of the strategy also brings challenges in parameter optimization and market adaptability, requiring continuous monitoring and regular adjustments to maintain its effectiveness.
By implementing the suggested optimization measures, especially enhancing market state adaptability and improving risk management systems, the strategy has the potential to maintain stable performance across different market environments. Overall, this is an advanced strategy suitable for experienced traders, which can become a powerful tool in a trading system with appropriate monitoring and adjustment.[/trans]
Source (PineScript)
/*backtest
start: 2024-04-02 00:00:00
end: 2025-04-01 00:00:00
period: 2d
basePeriod: 2d
exchanges: [{"eid":"Futures_Binance","currency":"ETH_USDT"}]
*/

// @version=5
strategy("NQ Futures Trading Strategy", overlay=true, initial_capital=50000, default_qty_type=strategy.cash, default_qty_value=5000)

// ==========================================
// Parameters
// ==========================================

// Account Parameters
accountSize = 50000
profitGoal = 3000
trailingThreshold = 2500
stopsTrailing = 52650

// Trading Parameters
atrLength = input.int(14, "ATR Period", minval=1)
atrMultiplier = input.float(1.5, "ATR Multiplier for SL", minval=0.5, maxval=3.0, step=0.1)
timeoutPeriod = input.int(30, "Exit after X minutes if trade doesn't move favorably", minval=5, maxval=120)

// FVG (Fair Value Gap) Parameters
fvgLength = input.int(5, "FVG Look-back Period", minval=2, maxval=20)
fvgThreshold = input.float(0.1, "FVG Size Threshold (%)", minval=0.05, maxval=1.0, step=0.05) * 0.01

// Order Block Parameters
obLength = input.int(5, "Order Block Look-back Period", minval=2, maxval=20)
obThreshold = input.float(0.1, "Order Block Size Threshold (%)", minval=0.05, maxval=1.0, step=0.05) * 0.01

// Liquidity Sweep Parameters
sweepLength = input.int(5, "Liquidity Sweep Look-back Period", minval=2, maxval=20)
sweepThreshold = input.float(0.05, "Sweep Size Threshold (%)", minval=0.01, maxval=0.5, step=0.01) * 0.01

// Break of Structure Parameters
bosLength = input.int(5, "BOS Look-back Period", minval=2, maxval=20)
bosThreshold = input.float(0.05, "BOS Size Threshold (%)", minval=0.01, maxval=0.5, step=0.01) * 0.01

// Debug Mode
debugMode = input.bool(false, "Debug Mode (more signals)")

// Higher Timeframe Trend Parameters
htfPeriod1 = input.timeframe("15", "First Higher Timeframe")
htfPeriod2 = input.timeframe("60", "Second Higher Timeframe")

// ==========================================
// Indicators & Calculations
// ==========================================

// ATR Calculation
atr = ta.atr(atrLength)

// Higher Timeframe EMAs for Trend Determination
htf1_ema20 = request.security(syminfo.tickerid, htfPeriod1, ta.ema(close, 20), barmerge.gaps_off, barmerge.lookahead_off)
htf1_ema50 = request.security(syminfo.tickerid, htfPeriod1, ta.ema(close, 50), barmerge.gaps_off, barmerge.lookahead_off)
htf2_ema20 = request.security(syminfo.tickerid, htfPeriod2, ta.ema(close, 20), barmerge.gaps_off, barmerge.lookahead_off)
htf2_ema50 = request.security(syminfo.tickerid, htfPeriod2, ta.ema(close, 50), barmerge.gaps_off, barmerge.lookahead_off)

// Higher Timeframe Trend
htf1_bullish = htf1_ema20 > htf1_ema50
htf1_bearish = htf1_ema20 < htf1_ema50
htf2_bullish = htf2_ema20 > htf2_ema50
htf2_bearish = htf2_ema20 < htf2_ema50

// ==========================================
// Entry Conditions
// ==========================================

// 1. Fair Value Gap (FVG)
bullishFVG = false
bearishFVG = false

for i = 1 to fvgLength
    if low[i] > high[i+2] and (low[i] - high[i+2]) / high[i+2] > fvgThreshold
        bullishFVG := true
    if high[i] < low[i+2] and (low[i+2] - high[i]) / high[i] > fvgThreshold
        bearishFVG := true

// 2. Inverse Fair Value Gap
inverseBullishFVG = false
inverseBearishFVG = false

for i = 1 to fvgLength
    if high[i+1] < low[i+2] and close[i] > open[i] and close[i] > high[i+1]
        inverseBullishFVG := true
    if low[i+1] > high[i+2] and close[i] < open[i] and close[i] < low[i+1]
        inverseBearishFVG := true

// 3. Order Block / Breaker Block
bullishOrderBlock = false
bearishOrderBlock = false

for i = 1 to obLength
    if close[i+1] < open[i+1] and (open[i+1] - close[i+1]) / close[i+1] > obThreshold and close[i] > open[i]
        bullishOrderBlock := true
    if close[i+1] > open[i+1] and (close[i+1] - open[i+1]) / open[i+1] > obThreshold and close[i] < open[i]
        bearishOrderBlock := true

// 4. Liquidity Sweep
bullishSweep = false
bearishSweep = false

lowestLow = ta.lowest(low, sweepLength+1)
highestHigh = ta.highest(high, sweepLength+1)

if low[1] < lowestLow[2] and close > open
    bullishSweep := true
if high[1] > highestHigh[2] and close < open
    bearishSweep := true

// 5. Break of Structure (BOS)
bullishBOS = false
bearishBOS = false

prevHigh = high[2]
prevLow = low[2]

if high > prevHigh and low[1] < low[2]
    bullishBOS := true
if low < prevLow and high[1] > high[2]
    bearishBOS := true

// Simpler version for debug mode
if debugMode
    bullishBOS := close > open and close > close[1]
    bearishBOS := close < open and close < close[1]

// ==========================================
// Signal Generation
// ==========================================

// Count valid entry conditions
bullishConditions = bullishFVG ? 1 : 0
bullishConditions := bullishConditions + (inverseBullishFVG ? 1 : 0)
bullishConditions := bullishConditions + (bullishOrderBlock ? 1 : 0)
bullishConditions := bullishConditions + (bullishSweep ? 1 : 0)

bearishConditions = bearishFVG ? 1 : 0
bearishConditions := bearishConditions + (inverseBearishFVG ? 1 : 0)
bearishConditions := bearishConditions + (bearishOrderBlock ? 1 : 0)
bearishConditions := bearishConditions + (bearishSweep ? 1 : 0)

// Entry signals (need at least 2 conditions + BOS confirmation)
// In debug mode, require only 1 condition
minConditions = debugMode ? 1 : 2
longSignal = bullishConditions >= minConditions and bullishBOS and (htf1_bullish or htf2_bullish)
shortSignal = bearishConditions >= minConditions and bearishBOS and (htf1_bearish or htf2_bearish)

// Debug mode override for testing
if debugMode
    longSignal := longSignal or (bullishBOS and htf1_bullish)
    shortSignal := shortSignal or (bearishBOS and htf1_bearish)

// ==========================================
// Risk Management
// ==========================================

// Calculate dynamic stop loss based on ATR
longStopDistance = atr * atrMultiplier
shortStopDistance = atr * atrMultiplier

// Default fixed values for testing
if debugMode
    longStopDistance := close * 0.01  // 1% stop
    shortStopDistance := close * 0.01  // 1% stop

// Calculate position size based on risk
nqPointValue = 20  // Each point is $20 for NQ
longPositionSize = math.floor(2000 / (longStopDistance * nqPointValue))
shortPositionSize = math.floor(2000 / (shortStopDistance * nqPointValue))

// Ensure at least 1 contract
longPositionSize := math.max(longPositionSize, 1)
shortPositionSize := math.max(shortPositionSize, 1)

// Variables to track entry time
var int entryTime = 0
var float equityCurve = accountSize

// ==========================================
// Strategy Execution
// ==========================================

// Make sure we don't get multiple signals on the same bar
var longEnteredThisBar = false
var shortEnteredThisBar = false

longEnteredThisBar := false
shortEnteredThisBar := false

// Entry conditions
if longSignal and not longEnteredThisBar and strategy.position_size <= 0
    strategy.close_all()
    strategy.entry("Long", strategy.long, qty=longPositionSize)
    longEnteredThisBar := true
    entryTime := time

if shortSignal and not shortEnteredThisBar and strategy.position_size >= 0
    strategy.close_all()
    strategy.entry("Short", strategy.short, qty=shortPositionSize)
    shortEnteredThisBar := true
    entryTime := time

// Take profit and stop loss orders
if strategy.position_size > 0
    stopPrice = strategy.position_avg_price - longStopDistance
    takeProfitPrice1 = strategy.position_avg_price + longStopDistance
    strategy.exit("Long TP1", "Long", qty_percent=50, limit=takeProfitPrice1, stop=stopPrice)

    // Move stop to breakeven after 1R move
    if high >= takeProfitPrice1
        strategy.exit("Long BE", "Long", stop=strategy.position_avg_price)

if strategy.position_size < 0
    stopPrice = strategy.position_avg_price + shortStopDistance
    takeProfitPrice1 = strategy.position_avg_price - shortStopDistance
    strategy.exit("Short TP1", "Short", qty_percent=50, limit=takeProfitPrice1, stop=stopPrice)

    // Move stop to breakeven after 1R move
    if low <= takeProfitPrice1
        strategy.exit("Short BE", "Short", stop=strategy.position_avg_price)

// Time-based exit
if strategy.position_size != 0
    currentTime = time
    if (currentTime - entryTime) >= timeoutPeriod * 60000  // Convert minutes to milliseconds
        strategy.close_all(comment="Time Exit")

// ==========================================
// Trailing Stop for Account Management
// ==========================================

// Update equity curve
equityCurve := strategy.equity

// Check if profit target is reached or trailing stop is hit
if strategy.equity >= accountSize + profitGoal
    strategy.close_all(comment="Profit Goal")

if strategy.equity >= accountSize + trailingThreshold
    trailingStop = math.max(accountSize, strategy.equity - trailingThreshold)
    if strategy.equity <= trailingStop
        strategy.close_all(comment="Trailing Stop")

// Stop trailing if account reaches the stop trailing threshold
if strategy.equity >= stopsTrailing
    strategy.close_all(comment="Stop Trailing")

// ==========================================
// Plotting
// ==========================================

// Plot entry conditions
plotshape(longSignal, title="Long Signal", location=location.belowbar, color=color.green, style=shape.triangleup, size=size.small)
plotshape(shortSignal, title="Short Signal", location=location.abovebar, color=color.red, style=shape.triangledown, size=size.small)

// Plot current position
bgcolor(strategy.position_size > 0 ? color.new(color.green, 90) : strategy.position_size < 0 ? color.new(color.red, 90) : na)

// Alert conditions
alertcondition(longSignal, title="Long Entry Signal", message="NQ LONG ENTRY: {{ticker}}, Price: {{close}}")
alertcondition(shortSignal, title="Short Entry Signal", message="NQ SHORT ENTRY: {{ticker}}, Price: {{close}}")
alertcondition(strategy.position_size > 0 and high >= strategy.position_avg_price + longStopDistance, title="Long Take Profit", message="NQ LONG TP: {{ticker}}, Price: {{close}}")
alertcondition(strategy.position_size < 0 and low <= strategy.position_avg_price - shortStopDistance, title="Short Take Profit", message="NQ SHORT TP: {{ticker}}, Price: {{close}}")
alertcondition(strategy.position_size > 0 and low <= strategy.position_avg_price - longStopDistance, title="Long Stop Loss", message="NQ LONG SL: {{ticker}}, Price: {{close}}")
alertcondition(strategy.position_size < 0 and high >= strategy.position_avg_price + shortStopDistance, title="Short Stop Loss", message="NQ SHORT SL: {{ticker}}, Price: {{close}}")
Detail
https://www.fmz.com/strategy/489135
Last Modified
2025-04-02 09:41:48