
7.5 KiB
Name
多重技术指标交叉动量趋势跟踪策略-Multi-Technical-Indicator-Crossover-Momentum-Trend-Following-Strategy
Author
ChaoZhang
Strategy Description
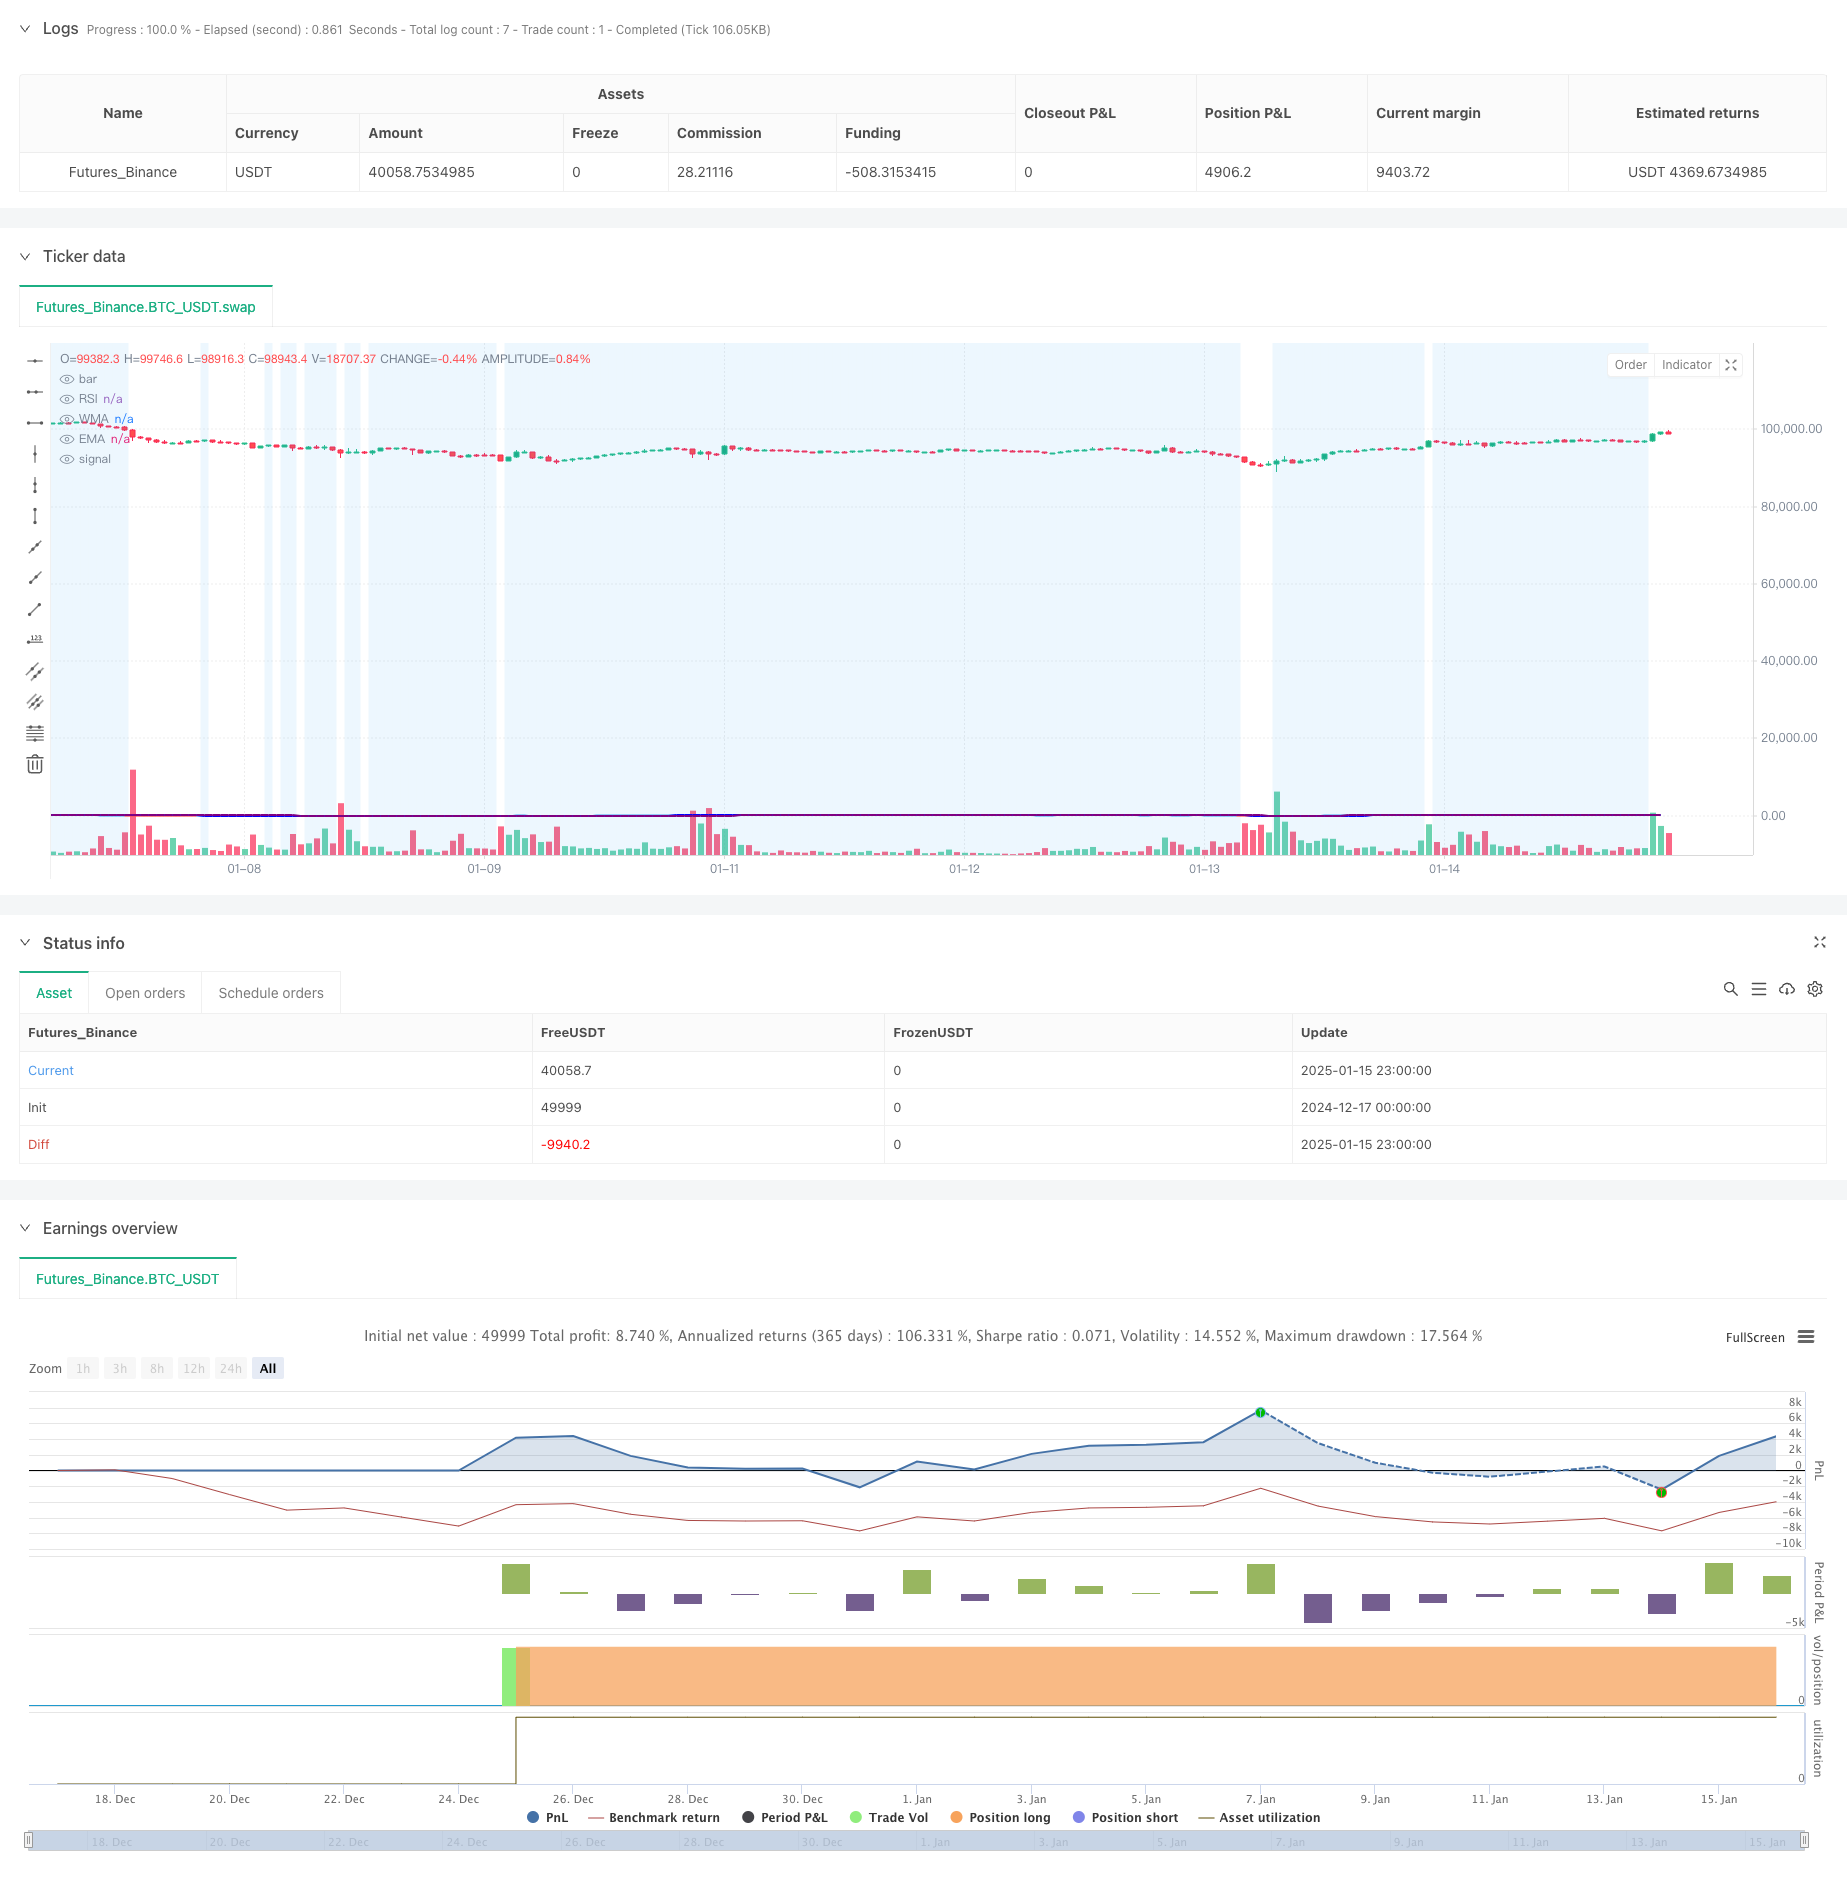
[trans]
概述
该策略是一个结合了相对强弱指数(RSI)、加权移动平均线(WMA)和指数移动平均线(EMA)的趋势跟踪交易系统。策略通过多重技术指标的配合使用,在趋势转折点捕捉市场动量变化,从而实现交易信号的产生。系统采用WMA和EMA的交叉来确认趋势方向,同时结合RSI指标来过滤市场状态,以提高交易的准确性。
策略原理
策略的核心逻辑基于以下几个关键要素:
- RSI指标计算采用14周期,用于衡量市场的超买超卖状态
- 45周期WMA和89周期EMA的交叉用于确认趋势的转换
- 入场条件:
- 做多信号:WMA上穿EMA且RSI<50
- 做空信号:WMA下穿EMA且RSI>50
- 系统通过RSI的颜色变化来可视化市场状态,当RSI>70时显示绿色,<30时显示红色
- 在RSI 30-70区间内设置蓝色背景,帮助识别中性区域
策略优势
- 多重技术指标的结合提高了交易信号的可靠性
- WMA对近期价格变化反应更敏感,而EMA则保持了对长期趋势的跟踪
- RSI作为过滤器可以有效避免在过度波动的市场中产生错误信号
- 视觉化的界面设计有助于交易者直观判断市场状态
- 包含完整的警报系统,可及时通知交易者潜在的交易机会
策略风险
- 在横盘市场中可能产生频繁的假突破信号
- 移动平均线的滞后性可能导致入场时机略有延迟
- RSI阈值的固定设置可能不适用于所有市场环境
- 没有考虑波动率因素,在高波动期可能增加风险
- 缺乏止损和止盈机制,可能影响资金管理效果
策略优化方向
- 引入自适应的RSI阈值,根据市场波动状态动态调整
- 增加ATR指标来控制持仓规模和设置动态止损
- 优化WMA和EMA的周期设置,可考虑根据不同时间框架调整
- 添加成交量指标作为辅助确认信号
- 实现更复杂的仓位管理系统,如金字塔式加仓和减仓
总结
这是一个基于多重技术指标的趋势跟踪策略,通过RSI、WMA和EMA的配合使用,在保证交易稳定性的同时,努力捕捉市场趋势转换点。虽然存在一定的滞后性和假信号风险,但通过合理的优化和风险管理措施,该策略具有良好的实用价值和扩展空间。 ||
Overview
This strategy is a trend following trading system that combines the Relative Strength Index (RSI), Weighted Moving Average (WMA), and Exponential Moving Average (EMA). By utilizing multiple technical indicators, the strategy captures market momentum changes at trend reversal points to generate trading signals. The system uses WMA and EMA crossovers to confirm trend direction while incorporating RSI to filter market conditions for improved trading accuracy.
Strategy Principles
The core logic of the strategy is based on the following key elements:
- RSI calculation uses a 14-period setting to measure market overbought/oversold conditions
- 45-period WMA and 89-period EMA crossovers confirm trend transitions
- Entry conditions:
- Long signal: WMA crosses above EMA and RSI<50
- Short signal: WMA crosses below EMA and RSI>50
- The system visualizes market conditions through RSI color changes, showing green when RSI>70 and red when RSI<30
- Blue background is set in the RSI 30-70 range to help identify neutral zones
Strategy Advantages
- The combination of multiple technical indicators enhances trading signal reliability
- WMA is more sensitive to recent price changes while EMA maintains long-term trend tracking
- RSI as a filter effectively prevents false signals in overly volatile markets
- Visual interface design helps traders intuitively judge market conditions
- Includes a complete alert system to notify traders of potential trading opportunities
Strategy Risks
- May generate frequent false breakout signals in sideways markets
- Moving averages' lag nature might cause slightly delayed entries
- Fixed RSI thresholds may not be suitable for all market environments
- Lack of volatility consideration may increase risk during high volatility periods
- Absence of stop-loss and take-profit mechanisms may affect money management effectiveness
Strategy Optimization Directions
- Introduce adaptive RSI thresholds that dynamically adjust based on market volatility
- Add ATR indicator for position sizing and dynamic stop-loss settings
- Optimize WMA and EMA periods, considering adjustments for different timeframes
- Add volume indicators as confirmation signals
- Implement more sophisticated position management systems, such as pyramid-style scaling
Summary
This is a trend following strategy based on multiple technical indicators, combining RSI, WMA, and EMA to capture market trend reversal points while maintaining trading stability. Although it has certain lag and false signal risks, through appropriate optimization and risk management measures, the strategy has good practical value and room for expansion.[/trans]
Source (PineScript)
/*backtest
start: 2024-12-17 00:00:00
end: 2025-01-16 00:00:00
period: 1h
basePeriod: 1h
exchanges: [{"eid":"Futures_Binance","currency":"BTC_USDT","balance":49999}]
*/

//@version=5
strategy(title="RSI + WMA + EMA Strategy", shorttitle="RSI Strategy", overlay=true)

// RSI Settings
rsiLengthInput = input.int(14, minval=1, title="RSI Length", group="RSI Settings")
rsiSourceInput = input.source(close, "Source", group="RSI Settings")

// WMA and EMA Settings
wmaLengthInput = input.int(45, minval=1, title="WMA Length", group="WMA Settings")
wmaColorInput = input.color(color.blue, title="WMA Color", group="WMA Settings")
emaLengthInput = input.int(89, minval=1, title="EMA Length", group="EMA Settings")
emaColorInput = input.color(color.purple, title="EMA Color", group="EMA Settings")

// RSI Calculation
change = ta.change(rsiSourceInput)
up = ta.rma(math.max(change, 0), rsiLengthInput)
down = ta.rma(-math.min(change, 0), rsiLengthInput)
rsi = down == 0 ? 100 : up == 0 ? 0 : 100 - (100 / (1 + up / down))

// WMA and EMA Calculation
wma = ta.wma(rsi, wmaLengthInput)
ema = ta.ema(rsi, emaLengthInput)

// RSI Color Logic
rsiColor = rsi > 70 ? color.new(color.green, 100 - math.round(rsi)) : rsi < 30 ? color.new(color.red, math.round(rsi)) : color.new(color.blue, 50)

// Plot RSI, WMA, and EMA
plot(rsi, "RSI", color=rsiColor)
plot(wma, title="WMA", color=wmaColorInput, linewidth=2)
plot(ema, title="EMA", color=emaColorInput, linewidth=2)

// Highlight RSI Area between 30 and 70
bgcolor(rsi >= 30 and rsi <= 70 ? color.new(color.blue, 90) : na)

// Entry and Exit Conditions
longCondition = ta.crossover(wma, ema) and rsi < 50
shortCondition = ta.crossunder(wma, ema) and rsi > 50

if (longCondition)
    strategy.entry("Long", strategy.long)
    alert("Buy Signal: WMA crossed above EMA, RSI < 50", alert.freq_once_per_bar)

if (shortCondition)
    strategy.entry("Short", strategy.short)
    alert("Sell Signal: WMA crossed below EMA, RSI > 50", alert.freq_once_per_bar)

// Optional: Plot Buy/Sell Signals on Chart
plotshape(series=longCondition, style=shape.labelup, location=location.belowbar, color=color.green, size=size.small, title="Buy Signal")
plotshape(series=shortCondition, style=shape.labeldown, location=location.abovebar, color=color.red, size=size.small, title="Sell Signal")
Detail
https://www.fmz.com/strategy/478741
Last Modified
2025-01-17 16:26:13