
18 KiB
Name
多重均衡价格趋势跟踪与反转交易策略-Multi-Equilibrium-Price-Trend-Following-and-Reversal-Trading-Strategy
Author
ChaoZhang
Strategy Description
[trans]
策略概述
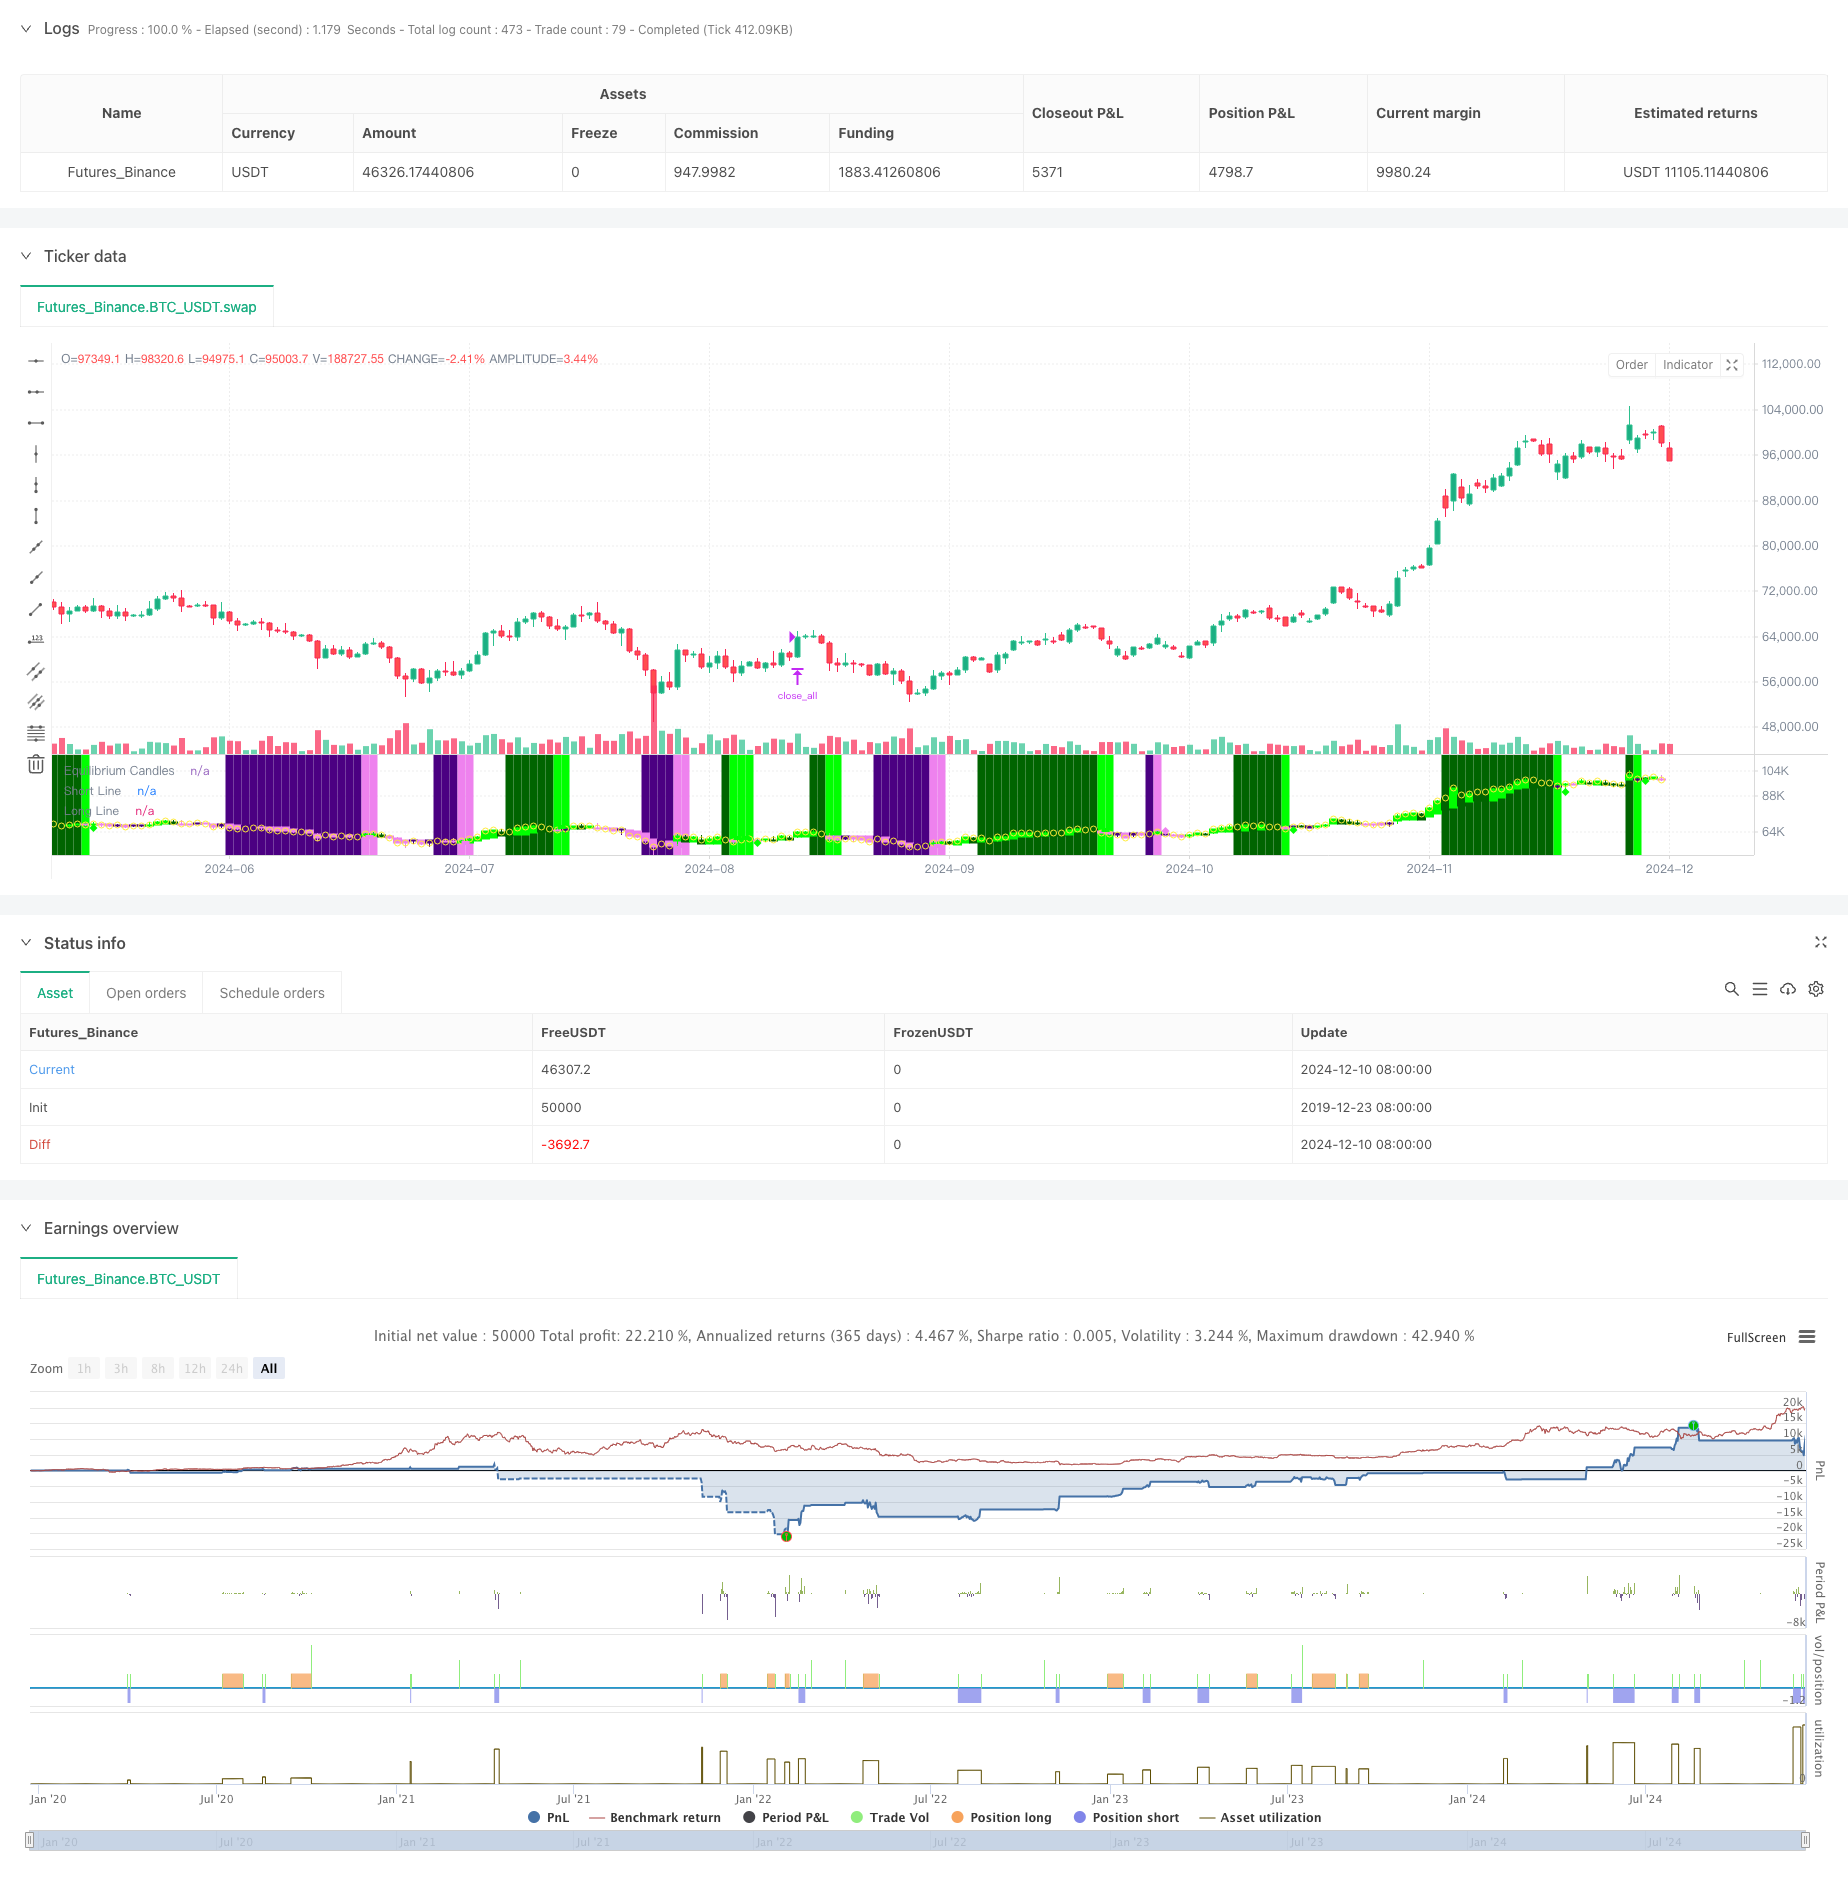
该策略是一个基于价格均衡点的趋势跟踪和反转交易系统。它通过计算过去X根K线的最高点和最低点的中间值来确定均衡价格,并根据收盘价相对于均衡价格的位置来判断趋势方向。当价格连续保持在均衡价格的一侧达到设定的K线数量时,系统会认定趋势成立。在第一次回调时(价格突破均衡价格)系统会寻求入场机会。该策略可以根据设置选择趋势跟踪或反转交易模式。
策略原理
- 均衡价格计算:使用过去X根K线的最高价和最低价的中点作为均衡价格,这与一目均衡图的基准线计算方法相同。
- 趋势判断:当价格在均衡价格的同一侧连续保持X根K线(默认7根)时,判定为趋势成立。
- 入场信号:在趋势确立后的第一次回调(价格突破均衡价格)时触发入场信号。
- 止损止盈:使用ATR的60%分位数来动态调整止损止盈距离,提供了风险控制的灵活性。
- 大幅波动保护:当价格偏离均衡点超过设定的ATR倍数时,系统会自动平仓以防止大幅回撤。
策略优势
- 适应性强:可以根据市场特性灵活切换趋势跟踪和反转交易模式。
- 风险控制完善:采用动态ATR止损,并设有大幅波动保护机制。
- 操作明确:交易信号清晰,不依赖复杂的技术指标组合。
- 可视化效果好:使用彩色K线和背景提供直观的市场状态展示。
- 自动化友好:可以方便地对接MT5等交易平台实现自动化交易。
策略风险
- 震荡市风险:在横盘震荡市场可能产生频繁的假信号。
- 滑点影响:在剧烈波动时可能面临较大滑点。
- 参数敏感性:核心参数如均衡期间、趋势判断周期等需要针对不同市场仔细优化。
- 市场切换风险:市场从趋势到震荡的转换期可能造成较大回撤。
策略优化方向
- 市场环境识别:增加市场环境判断模块,在不同市场条件下动态调整策略参数。
- 信号过滤:考虑加入成交量、波动率等辅助指标来过滤假信号。
- 仓位管理:引入更复杂的仓位管理机制,如基于波动率的动态调整。
- 多时间周期:整合多个时间周期的信号来提高交易的准确性。
- 交易成本优化:针对不同交易品种的成本特点优化进出场时机。
总结
这是一个设计合理的趋势交易系统,通过均衡价格这一核心概念提供了清晰的交易逻辑。该策略最大的特点是灵活性强,既可以用于趋势跟踪也可以用于反转交易,同时具备完善的风险控制机制。虽然在某些市场条件下可能面临挑战,但通过持续优化和灵活调整,该策略有望在各种市场环境下保持稳定的表现。 ||
Strategy Overview
This strategy is a trend following and reversal trading system based on price equilibrium points. It determines the equilibrium price by calculating the midpoint between the highest and lowest points over X bars, and judges trend direction based on the closing price's position relative to the equilibrium price. When price maintains on one side of the equilibrium for a set number of bars, the system confirms a trend. It seeks entry opportunities on the first pullback (price crossing equilibrium). The strategy can be configured for either trend following or reversal trading modes.
Strategy Principles
- Equilibrium Price Calculation: Uses the midpoint between the highest and lowest prices over X bars as equilibrium price, identical to the baseline calculation in Ichimoku Cloud.
- Trend Determination: A trend is confirmed when price stays on the same side of equilibrium for X consecutive bars (default 7).
- Entry Signals: Triggers entry on first pullback (price crossing equilibrium) after trend confirmation.
- Stop Loss and Take Profit: Uses 60th percentile of ATR for dynamic adjustment of stop loss and take profit distances, providing flexible risk control.
- Large Movement Protection: Automatically closes positions when price deviates from equilibrium beyond a set ATR multiple.
Strategy Advantages
- High Adaptability: Flexibly switches between trend following and reversal trading modes based on market characteristics.
- Comprehensive Risk Control: Employs dynamic ATR stops and large movement protection mechanisms.
- Clear Operations: Trading signals are clear and don't rely on complex technical indicator combinations.
- Good Visualization: Uses colored candlesticks and backgrounds for intuitive market state display.
- Automation Friendly: Easily interfaces with trading platforms like MT5 for automated trading.
Strategy Risks
- Choppy Market Risk: May generate frequent false signals in sideways markets.
- Slippage Impact: May face significant slippage during violent market movements.
- Parameter Sensitivity: Core parameters like equilibrium period and trend determination period need careful optimization for different markets.
- Market Transition Risk: Transitions from trending to ranging markets may cause significant drawdowns.
Strategy Optimization Directions
- Market Environment Recognition: Add market environment identification module to dynamically adjust strategy parameters under different market conditions.
- Signal Filtering: Consider adding volume, volatility, and other auxiliary indicators to filter false signals.
- Position Management: Introduce more sophisticated position management mechanisms, such as volatility-based dynamic adjustment.
- Multiple Timeframes: Integrate signals from multiple timeframes to improve trading accuracy.
- Trading Cost Optimization: Optimize entry and exit timing based on cost characteristics of different trading instruments.
Summary
This is a well-designed trend trading system that provides clear trading logic through the core concept of equilibrium price. The strategy's greatest strength is its flexibility, being suitable for both trend following and reversal trading while maintaining comprehensive risk control mechanisms. Although it may face challenges under certain market conditions, through continuous optimization and flexible adjustment, the strategy has the potential to maintain stable performance across various market environments.[/trans]
Source (PineScript)
/*backtest
start: 2019-12-23 08:00:00
end: 2024-12-11 08:00:00
period: 1d
basePeriod: 1d
exchanges: [{"eid":"Futures_Binance","currency":"BTC_USDT"}]
*/

// This Pine Script™ code is subject to the terms of the Mozilla Public License 2.0 at https://mozilla.org/MPL/2.0/
// © Honestcowboy

//@version=5
strategy("Equilibrium Candles + Pattern [Honestcowboy]", overlay=false)

// ================================== //
// ---------> User Input <----------- //
// ================================== //

candleSmoothing = input.int(9, title="Equilibrium Length", tooltip="The lookback for finding equilibrium.\nIt is same calculation as the Baseline in Ichimoku Cloud and is the mid point between highest and lowest value over this length.", group="Base Settings")
candlesForTrend = input.int(7, title="Candles needed for Trend", tooltip="The amount of candles in one direction (colored) before it's considered a trend.\nOrders get created on the first candle in opposite direction.", group="Base Settings")
maxPullbackCandles = input.int(2, title="Max Pullback (candles)", tooltip="The amount of candles can go in opposite direction until a pending trade order is cancelled.", group="Base Settings")
candle_bull_c1 = input.color(color.rgb(0,255,0), title="", inline="1", group="Candle Coloring")
candle_bull_c2 = input.color(color.rgb(0,100,0), title="", inline="1", group="Candle Coloring")
candle_bear_c1 = input.color(color.rgb(238,130,238), title="", inline="2", group="Candle Coloring")
candle_bear_c2 = input.color(color.rgb(75,0,130), title="", inline="2", group="Candle Coloring")
highlightClosePrices = input.bool(defval=true, title="Highlight close prices", group="Candle Coloring", tooltip="Will put small yellow dots where closing price would be.")
useBgColoring = input.bool(defval=true, title="color main chart Bg based on trend and entry point", tooltip="colors main chart background based on trend and entry points", group="Chart Background")
trend_bull_c = input.color(color.rgb(0,100,0,50), title="Trend Bull Color", group="Chart Background")
trend_bear_c = input.color(color.rgb(75,0,130, 50), title="Trend Bear Color", group="Chart Background")
long_zone_c = input.color(color.rgb(0,255,0,60), title="Long Entry Zone Color", group="Chart Background")
short_zone_c = input.color(color.rgb(238,130,238,60), title="Short Entry Zone Color", group="Chart Background")
atrLenghtScob = input.int(14, title="ATR Length", group = "Volatility Settings")
atrAverageLength = input.int(200, title="ATR percentile averages lookback", group = "Volatility Settings")
atrPercentile    = input.int(60, minval=0, maxval=99, title="ATR > bottom X percentile", group = "Volatility Settings", tooltip="For the Final ATR value in which percentile of last X bars does it need to be a number. At 60 it's the lowest ATR in top 40% of ATR over X bars")
useReverse = input.bool(true, title="Use Reverse", group="Strategy Inputs", tooltip="The Strategy will open short orders where normal strategy would open long orders. It will use the SL as TP and the TP as SL. So would create the exact opposite in returns as the normal strategy.")
stopMultiplier = input.float(2, title="stop+tp atr multiplier", group="Strategy Inputs")
useTPSL = input.bool(defval=true, title="use stop and TP", group="Strategy Inputs")
useBigCandleExit = input.bool(defval=true, title="Big Candle Exit", group="Strategy Inputs", inline="1", tooltip="Closes all open trades whenever price closes too far from the equilibrium")
bigCandleMultiplier = input.float(defval=1, title="Exit Multiplier", group="Strategy Inputs", inline="1", tooltip="The amount of times in ATR mean candle needs to close outside of equilibrium for it to be a big candle exit.")

tvToQPerc = input.float(defval=1, title="Trade size in Account risk %", group="Tradingview.to Connection (MT5)", tooltip="Quantity as a percentage with stop loss in the commands; the lot size is calculated based on the percentage to lose in case sl is hit. If SL is not specified, the Lot size will be calculated based on account balance.")
tvToOverrideSymbol = input.bool(defval=false, title="Override Symbol?", group="Tradingview.to Connection (MT5)")
tvToSymbol = input.string(defval="EURUSD", title="", group="Tradingview.to Connection (MT5)")
// ================================== //
// -----> Immutable Constants <------ //
// ================================== //

var bool isBullTrend = false
var bool isBearTrend = false
var bool isLongCondition = false
var bool isShortCondition = false
var int bullCandleCount = 0
var int bearCandleCount = 0
var float longLine = na
var float shortLine = na

// ================================== //
// ---> Functional Declarations <---- //
// ================================== //

baseLine(len) =>
    math.avg(ta.lowest(len), ta.highest(len))

// ================================== //
// ----> Variable Calculations <----- //
// ================================== //

longSignal = false
shortSignal = false

equilibrium = baseLine(candleSmoothing)
atrEquilibrium = ta.atr(atrLenghtScob)
atrAveraged = ta.percentile_nearest_rank(atrEquilibrium, atrAverageLength, atrPercentile)
equilibriumTop  = equilibrium + atrAveraged*bigCandleMultiplier
equilibriumBottom = equilibrium - atrAveraged*bigCandleMultiplier

// ================================== //
// -----> Conditional Variables <---- //
// ================================== //
if not isBullTrend and close>equilibrium
    bullCandleCount := bullCandleCount + 1
    bearCandleCount := 0
    isBearTrend := false

if not isBearTrend and close<equilibrium
    bearCandleCount := bearCandleCount + 1
    bullCandleCount := 0
    isBullTrend := false

if bullCandleCount >= candlesForTrend
    isBullTrend := true
    isBearTrend := false
    bullCandleCount := 0
    bearCandleCount := 0
if bearCandleCount >= candlesForTrend
    isBearTrend := true
    isBullTrend := false
    bullCandleCount := 0
    bearCandleCount := 0

// ================================== //
// ------> Strategy Execution <------ //
// ================================== //

if isBullTrend[1] and close<equilibrium
    if useReverse and (not na(atrAveraged))
        strategy.entry("short", strategy.short, limit=high)
        alert("Sell " + str.tostring((tvToOverrideSymbol ? tvToSymbol : syminfo.ticker)) + " Q=" + str.tostring(tvToQPerc) + "% P=" + str.tostring(high) + " TP=" + str.tostring(high-stopMultiplier*atrAveraged)+ " SL=" + str.tostring(high+stopMultiplier*atrAveraged), freq=alert.freq_once_per_bar)
    if (not useReverse) and (not na(atrAveraged))
        strategy.entry("long", strategy.long, stop=high)
        alert("Buy " + str.tostring((tvToOverrideSymbol ? tvToSymbol : syminfo.ticker)) + " Q=" + str.tostring(tvToQPerc) + "% P=" + str.tostring(high) + " TP=" + str.tostring(high+stopMultiplier*atrAveraged) + " SL=" + str.tostring(high+stopMultiplier*atrAveraged), freq=alert.freq_once_per_bar)
    isLongCondition := true
    isBullTrend := false
    longLine := high

if isBearTrend[1] and close>equilibrium
    if useReverse and (not na(atrAveraged))
        strategy.entry("long", strategy.long, limit=low)
        alert("Buy " + str.tostring((tvToOverrideSymbol ? tvToSymbol : syminfo.ticker)) + " Q=" + str.tostring(tvToQPerc) + "% P=" + str.tostring(low) + " TP=" + str.tostring(low+stopMultiplier*atrAveraged) + " SL=" + str.tostring(low-stopMultiplier*atrAveraged), freq=alert.freq_once_per_bar)
    if (not useReverse) and (not na(atrAveraged))
        strategy.entry("short", strategy.short, stop=low)
        alert("Sell " + str.tostring((tvToOverrideSymbol ? tvToSymbol : syminfo.ticker)) + " Q=" + str.tostring(tvToQPerc) + "% P=" + str.tostring(low) + " TP=" + str.tostring(low-stopMultiplier*atrAveraged) + " SL=" + str.tostring(low+stopMultiplier*atrAveraged), freq=alert.freq_once_per_bar)
    isShortCondition := true
    isBearTrend := false
    shortLine := low

if isLongCondition and (bearCandleCount >= maxPullbackCandles)[1]
    if useReverse
        strategy.cancel("short")
        alert("Cancel " + str.tostring((tvToOverrideSymbol ? tvToSymbol : syminfo.ticker)) + " t=sell")
    if not useReverse
        strategy.cancel("long")
        alert("Cancel " + str.tostring((tvToOverrideSymbol ? tvToSymbol : syminfo.ticker)) + " t=buy")
    isLongCondition := false
    bullCandleCount := 0
    longLine := na

if isShortCondition and (bullCandleCount >= maxPullbackCandles)[1]
    if useReverse
        strategy.cancel("long")
        alert("Cancel " + str.tostring((tvToOverrideSymbol ? tvToSymbol : syminfo.ticker)) + " t=buy")
    if not useReverse
        strategy.cancel("short")
        alert("Cancel " + str.tostring((tvToOverrideSymbol ? tvToSymbol : syminfo.ticker)) + " t=sell")
    isShortCondition := false
    bearCandleCount := 0
    shortLine := na

// ---- Save for graphical display that there is a longcondition + reset other variables
if high>longLine
    longSignal := true
    longLine := na
    isLongCondition := false

if low<shortLine
    shortSignal := true
    shortLine := na
    isShortCondition := false
// ---- Get Stop loss and Take Profit in there
if useReverse
    if useTPSL
        if strategy.position_size < 0 and strategy.position_size[1] >= 0
            strategy.exit("short exit", "short", limit=longLine[1]-stopMultiplier*atrAveraged, stop=longLine[1]+stopMultiplier*atrAveraged)
        if strategy.position_size > 0 and strategy.position_size[1] <= 0
            strategy.exit("long exit", "long", limit=shortLine[1]+stopMultiplier*atrAveraged, stop=shortLine[1]-stopMultiplier*atrAveraged)
if not useReverse
    if useTPSL
        if strategy.position_size > 0 and strategy.position_size[1] <= 0
            strategy.exit("long exit", "long", limit=longLine[1]+stopMultiplier*atrAveraged, stop=longLine[1]-stopMultiplier*atrAveraged)
        if strategy.position_size < 0 and strategy.position_size[1] >=0
            strategy.exit("short exit", "short", limit=shortLine[1]-stopMultiplier*atrAveraged, stop=shortLine[1]+stopMultiplier*atrAveraged)
// ----- Logic for closing positions on a big candle in either direction
if (strategy.position_size[1]>0 or strategy.position_size[1]<0) and useBigCandleExit
    if close>equilibriumTop or close<equilibriumBottom
        strategy.close_all("Big Candle Stop")
        alert("close " + str.tostring((tvToOverrideSymbol ? tvToSymbol : syminfo.ticker)))

// ================================== //
// ------> Graphical Display <------- //
// ================================== //

// Deviation from equilibrium using smoothed ATR and percentile nearest rank to rank the coloring of the candles
candle_c2 = close>equilibrium ? close>open ? candle_bull_c1 : candle_bull_c2 : close<open ? candle_bear_c1 : candle_bear_c2
//
plotcandle(equilibrium, high, low, close, title="Equilibrium Candles", color=candle_c2, wickcolor=candle_c2, bordercolor=candle_c2)
plotshape(highlightClosePrices ? close : na, title="Closing Bubble", style=shape.circle, location=location.absolute, color=color.yellow)
bgcolor(useBgColoring ? (isBullTrend ? trend_bull_c : isBearTrend ? trend_bear_c : isLongCondition ? long_zone_c : isShortCondition ? short_zone_c : na) : na, force_overlay=true)
plot(longLine, color=candle_bull_c1, title="Long Line", style=plot.style_linebr, linewidth=4)
plot(shortLine, color=candle_bear_c1, title="Short Line", style=plot.style_linebr, linewidth=4)
plotshape(longSignal ? math.min(equilibrium, low)+(-0.5*atrAveraged) : na, title="Long Signal", color=candle_bull_c1, style=shape.diamond, size=size.tiny, location=location.absolute)
plotshape(shortSignal ? math.max(equilibrium, high)+(0.5*atrAveraged) : na, title="Short Signal", color=candle_bear_c1, style=shape.diamond, size=size.tiny, location=location.absolute)

// =================================== //
// ------> Simple Form Alerts <------- //
// =================================== //

alertcondition(longSignal, "Simple Long Signal")
alertcondition(shortSignal, "Simple Short Signal")
Detail
https://www.fmz.com/strategy/474954
Last Modified
2024-12-13 10:23:12