
7.1 KiB
Name
多重均线趋势动量识别与止损交易系统-Multi-EMA-Trend-Momentum-Recognition-and-Stop-Loss-Trading-System
Author
ChaoZhang
Strategy Description
[trans]
概述
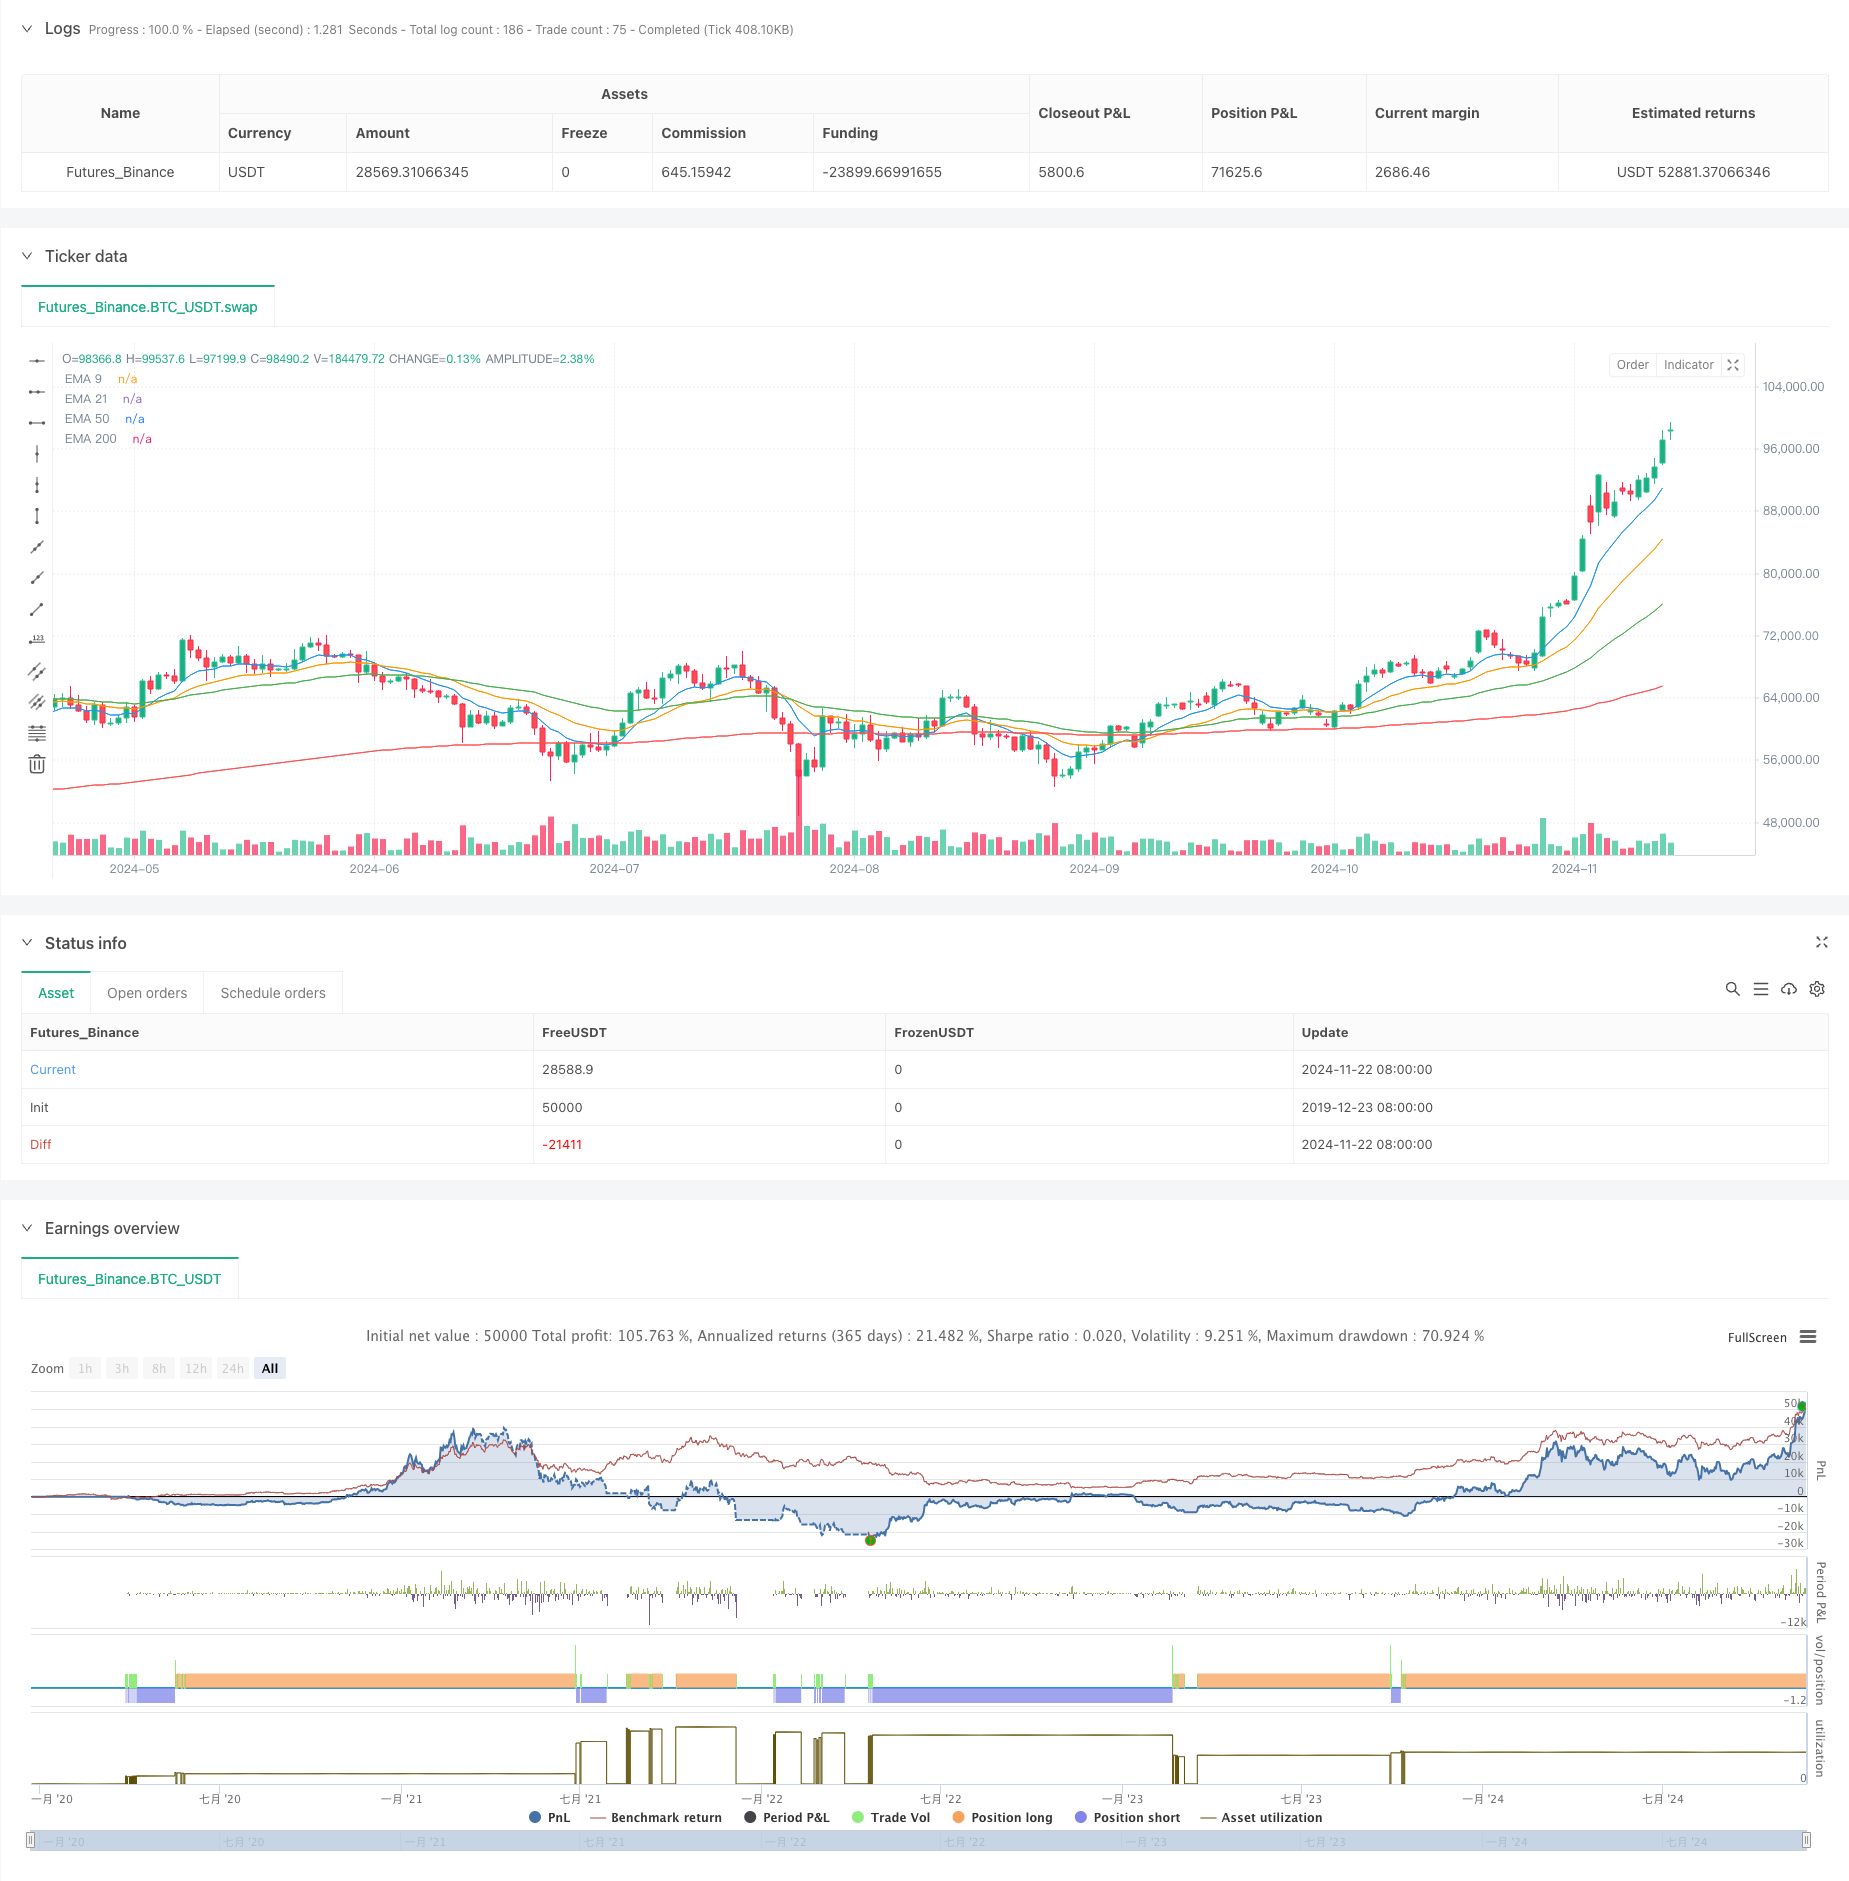
该策略是一个基于四重指数移动平均线(EMA)的趋势跟踪系统,通过9、21、50和200周期EMA的交叉和排列来识别市场趋势,并结合百分比止损进行风险控制。策略通过判断四条均线的排列顺序来确定市场趋势方向,当短期均线位于长期均线之上时入场做多,反之做空,同时设置固定百分比止损来控制风险。
策略原理
策略使用了四条不同周期的指数移动平均线(9、21、50、200),通过观察这些均线之间的关系来判断市场趋势。当9日EMA位于21日EMA之上,21日EMA位于50日EMA之上,50日EMA位于200日EMA之上时,系统认为市场处于强势上涨趋势,发出做多信号。相反,当均线呈现相反排列时,系统认为市场处于下跌趋势,发出做空信号。同时,策略引入了2%的止损设置,用于控制每笔交易的最大损失。
策略优势
- 多重均线交叉提供了更可靠的趋势确认信号,减少了假突破带来的风险
- 通过不同周期均线的排列来判断趋势强度,可以有效过滤掉市场噪音
- 固定百分比止损设置提供了明确的风险控制机制
- 策略逻辑简单清晰,易于理解和执行
- 适用于多个市场和时间周期,具有较强的普适性
策略风险
- 在震荡市场中可能产生频繁的假信号,导致连续止损
- 均线系统具有滞后性,可能错过趋势初期的重要价格变动
- 固定百分比止损可能不适合所有市场环境和波动率条件
- 没有考虑市场波动率变化对止损设置的影响
- 缺乏利润目标设置,可能导致盈利不能有效兑现
策略优化方向
- 引入ATR指标动态调整止损距离,使其更适应市场波动率变化
- 增加趋势强度过滤器,如ADX指标,以提高入场信号质量
- 添加移动止损机制,更好地保护已有盈利
- 引入成交量指标作为趋势确认的辅助指标
- 考虑添加利润目标或者移动止盈机制
- 优化均线周期参数,使其更适合特定市场特征
总结
这是一个结构完整的趋势跟踪交易系统,通过多重均线的配合使用提供了较为可靠的趋势识别机制,同时采用固定百分比止损来控制风险。虽然系统存在一定的滞后性,但通过合理的参数优化和额外指标的补充,可以进一步提升策略的稳定性和盈利能力。这个策略特别适合波动较大的市场,以及中长期的趋势跟踪交易。
||
Overview
This strategy is a trend-following system based on four Exponential Moving Averages (EMAs), using the crossovers and alignments of 9, 21, 50, and 200-period EMAs to identify market trends, combined with percentage-based stop-loss for risk control. The strategy determines market trend direction by checking the alignment order of four moving averages, entering long positions when shorter-period EMAs are above longer-period EMAs, and vice versa for short positions, while implementing a fixed percentage stop-loss for risk management.
Strategy Principles
The strategy employs four EMAs with different periods (9, 21, 50, 200) to assess market trends. A buy signal is generated when the 9-day EMA is above the 21-day EMA, which is above the 50-day EMA, which in turn is above the 200-day EMA, indicating a strong uptrend. Conversely, the opposite alignment generates sell signals. A 2% stop-loss is implemented to control maximum loss per trade.
Strategy Advantages
- Multiple EMA crossovers provide more reliable trend confirmation signals, reducing false breakout risks
- Trend strength assessment through multiple period EMA alignments effectively filters market noise
- Fixed percentage stop-loss provides clear risk management parameters
- Simple and clear strategy logic, easy to understand and execute
- Applicable across multiple markets and timeframes, offering strong versatility
Strategy Risks
- May generate frequent false signals in ranging markets, leading to consecutive stop-losses
- Moving average systems have inherent lag, potentially missing important early trend movements
- Fixed percentage stop-loss may not suit all market environments and volatility conditions
- Lacks consideration of market volatility impact on stop-loss settings
- Absence of profit targets may result in ineffective profit realization
Strategy Optimization Directions
- Incorporate ATR indicator for dynamic stop-loss adjustment based on market volatility
- Add trend strength filters like ADX to improve entry signal quality
- Implement trailing stop-loss mechanism to better protect accumulated profits
- Include volume indicators as supplementary trend confirmation
- Consider adding profit targets or trailing profit mechanisms
- Optimize EMA period parameters to better suit specific market characteristics
Summary
This is a comprehensive trend-following trading system that provides reliable trend identification through multiple EMAs while implementing fixed percentage stop-loss for risk control. Although the system has some inherent lag, it can be further enhanced through proper parameter optimization and additional indicator integration. The strategy is particularly suitable for highly volatile markets and medium to long-term trend-following trading.[/trans]
Source (PineScript)
/*backtest
start: 2019-12-23 08:00:00
end: 2024-11-23 08:00:00
period: 1d
basePeriod: 1d
exchanges: [{"eid":"Futures_Binance","currency":"BTC_USDT"}]
*/

//@version=5
strategy("4 EMA Strategy with Stop Loss", overlay=true)

// Define the EMA lengths
ema1_length = input(9, title="EMA 1 Length")
ema2_length = input(21, title="EMA 2 Length")
ema3_length = input(50, title="EMA 3 Length")
ema4_length = input(200, title="EMA 4 Length")

// Calculate the EMAs
ema1 = ta.ema(close, ema1_length)
ema2 = ta.ema(close, ema2_length)
ema3 = ta.ema(close, ema3_length)
ema4 = ta.ema(close, ema4_length)

// Plot EMAs on the chart
plot(ema1, color=color.blue, title="EMA 9")
plot(ema2, color=color.orange, title="EMA 21")
plot(ema3, color=color.green, title="EMA 50")
plot(ema4, color=color.red, title="EMA 200")

// Define conditions for Buy and Sell signals
buy_condition = (ema1 > ema2 and ema2 > ema3 and ema3 > ema4)
sell_condition = (ema1 < ema2 and ema2 < ema3 and ema3 < ema4)

// Input stop loss percentage
stop_loss_perc = input(2.0, title="Stop Loss %")

// Execute buy signal
if (buy_condition)
    strategy.entry("Buy", strategy.long)

    // Set stop loss at a percentage below the entry price
    strategy.exit("Sell", "Buy", stop=strategy.position_avg_price * (1 - stop_loss_perc / 100))

// Execute sell signal
if (sell_condition)
    strategy.entry("Sell", strategy.short)

    // Set stop loss at a percentage above the entry price
    strategy.exit("Cover", "Sell", stop=strategy.position_avg_price * (1 + stop_loss_perc / 100))
Detail
https://www.fmz.com/strategy/472936
Last Modified
2024-11-25 11:09:00